StudentShare
Contact Us
Sign In / Sign Up for FREE
Search
Go to advanced search...
Free

Lab biochemistry - Coursework Example

Cite this document
Summary
There are four subunits within NAD which consist of Zn2+ ions, the purpose of which is to aid in transfereing a hydride ion from the alcohol to NAD+ .
The graphs depicted above have…
Download full paper File format: .doc, available for editing
GRAB THE BEST PAPER93.2% of users find it useful
Lab biochemistry
Read Text Preview

Extract of sample "Lab biochemistry"

Determination of the Kinetic constants, Km, Kcat and Vmax of yeast alcohol dehydrogenase (ADH) with three alcohol substrates (ethanol, propan ol and butan-1-ol).IntroductionThe objective of this experiment is to find the Km, kcat and Vmax values of yeast alcohol dehydrogenase. We used ethanol, propan-1-ol and butan-1-ol to carry out this experiment.With a molecular weight of 150.000, yeast dehydrogenase is classified as an NAD linked enzyme. There are four subunits within NAD which consist of Zn2+ ions, the purpose of which is to aid in transfereing a hydride ion from the alcohol to NAD+ .

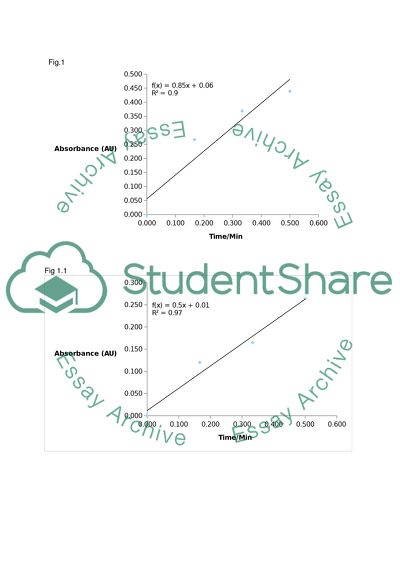
The overall reaction equation is :RCH2OH + NAD+  RCHO + NADH + H+MethodAs written in the lab protocol sheetResultsTable 1EthanolTimeAbsorbance values for Substrate concentrationsSecondsMinutes0.0800.0400.0200.0100.0050.0000.0000.0000.0000.0000.0000.00010.0000.1670.2670.1200.0810.0730.03520.0000.3330.3690.1650.1260.1330.06130.0000.5000.4390.2640.1690.1780.09840.0000.6670.5500.3180.2170.2160.12750.0000.8330.6000.3840.2580.2520.15560.0001.0000.7250.4390.3080.2870.178Fig.1Fig 1.1Fig 1.2Fig 1.3Fig 1.

4Table 2Propan-1-olTimeAbsorbance values for Substrate concentrationsSecondsMinutes0.080.040.020.010.00500.0000.0000.0000.0000.0000.000100.1670.0180.0410.0360.0330.038200.3330.0530.0610.0440.0390.040300.5000.0850.0850.0620.0520.044400.6670.1150.1110.0790.0350.052500.8330.1430.1370.0970.0760.058601.0000.1680.1590.1120.0870.063701.1670.1960.1840.1280.0990.071Fig 1.5Fig 1.6Fig 1.7 Fig 1.8Fig 1.9Table of absorbance values at 340nm using different substrate concentration for Butan-1-ol and the graphs to show this data.

Table 3Butan-1-olTimeAbsorbance values for Substrate concentrationsSecondsMinutes0.080.040.020.010.00500.0000.0000.0000.0000.0000.000100.1670.0430.030.0290.0270.024200.3330.0780.050.0480.0380.032300.5000.1190.0820.0740.0480.036400.6670.1610.1080.0830.0570.041500.8330.1930.1340.0980.0660.047601.0000.230.160.1160.0760.051701.1670.2640.1830.130.0830.054Fig 2.0Fig 2.1Fig 2.2Fig 2.3Fig 2.4The graphs depicted above have been plotted for for 0.080, 0.040, 0.020, 0.010 and 0.005M substrate concentrations.

All of these graphs have absorbance (340nm) on the y-axis and Time (min) on the x-axis. The graphs were drawn individually however due to a great deal of overlap in the data, it was better to combine it into a single graph for each alcohol as it made the interpretation of the date considerably easier. Michaelis Menten curvesVelocity calculation:1) The linear line equations of the absorbance vs. Time plot. provided the gradient.2) The gradient was divided by the Enzyme co-efficient which in this case was 6220 l/mol/cm3) The above answer was multiplied by the volume of the cuvette which was 0.

003 (3ml÷1000)4) The above answer was multiplied with 106 to convert the volume into micro mol.5) The answer from step 4 in µmol was divided by 0.1 which was the amount of enzyme used.Example for Ethanol:1) 0.851 ÷ 6220 = 1.37 x2) 1.37 x10-4 × 0.003 = 4.10 x10-73) 4.10 x10-7 × 106 = 0.414) 0.41 ÷ 0.1 = 4.1µmol min-1 ml-1The same method was used for the velocity calculation of others. The results have been tabulated above.Ethanol:Table 4EthanolGradientEnzyme co-efficient (l/mol/cm)Cuvette (L)Convert to micromoles (µmol)Enzyme used (µmol min-1 ml0.85162200.00310000000.10.50262200.

00310000000.10.33162200.00310000000.10.35662200.00310000000.10.19262200.00310000000.1Table 5Substrate Concentration (M)Velocity (V)0.0804.1050.0402.4210.0201.5960.0101.7170.0050.926Propan-1-ol:Table 6Propan-1-olGradientEnzyme co-efficient (l/mol/cm )Cuvette (L)Convert to micromolesenzyme used0.17462200.00310000000.10.16562200.00310000000.10.11662200.00310000000.10.09762200.00310000000.10.08062200.00310000000.1Table 7Substrate Concentration (M)Velocity (V)0.0800.8390.0400.7960.0200.5590.0100.4680.0050.386Butan-1-ol:Table 8Butan-1-olGradientEnzyme co-efficient (l/mol/cm )Cuvette (L)Convert to micromolesenzyme used0.23562200.00310000000.10.15962200.

00310000000.10.14462200.00310000000.10.09362200.00310000000.10.06962200.00310000000.1Table 9Substrate Concentration (M)Velocity (V)0.0801.1330.0400.7670.0200.6950.0100.4490.0050.333The Michaelis Menten graphs are attached, fig 2.5, 2.6 and 2.7.Lineweaver Burk plots. Since the velocity had already been calculated from the gradient values of the previous absorbance plots, they could be used in plotting the above mentioned plots. The Graphs of were plotted by dividing the values of velocity and substrate concentrations both by 1 Now that all the info was here, it was possible to plot the Lineweaver Burk plots.

Ethanol:Table 10EthanolSubstrate Concentration (M)Velocity (V)1/S1/V0.0804.10512.5000.2440.0402.42125.0000.4130.0201.59650.0000.6270.0101.717100.0000.5820.0050.926200.0001.080Fig 2.8Propan-1-ol:Table 11Propan-1-olSubstrate Concentration (M)Velocity (V)1/[S]1/V0.0800.00812.500125.0000.0400.00825.000125.0000.0200.00650.000166.6670.0100.005100.000200.0000.0050.004200.000250.000Fig 2.9Butan-1-ol:Table12Butan-1-olSubstrate Concentration (M)Velocity (V)1/S1/V0.0801.13312.5000.8830.0400.76725.0001.3040.0200.69550.0001.4390.0100.449100.0002.2270.0050.333200.0003.003Fig 3.

0Eadie HofsteeThe final set of graphs that needed to be plotted were the Eadie Hofstee plots. These are plots of V/[S] against velocity. All graphs for each alcohol had a negative gradient because of the inverse relationship between the V/S and velocity. Ethanol:Table 13EthanolSubstrate Concentration (M)Velocity (V)V/S0.0804.10551.3130.0402.42160.5250.0201.59679.8000.0101.717171.7000.0050.926185.200Fig 3.1Propan-1-ol:Table 14Propan-1-olSubstrate Concentration (M)Velocity (V)V/S0.0800.83910.4880.0400.79619.9000.0200.55927.9500.0100.46846.8000.0050.38677.200Fig 3.

2Butan-1-ol:Table 15Butan-1-olSubstrate Concentration (M)Velocity (V)V/S0.0801.13314.1630.0400.76719.1750.0200.69534.7500.0100.44944.9000.0050.33366.600Fig 3.3Kcat Calculations1) Step one is: 0.1÷1000= 0.001g/ml2) The molecular weight of the enzyme was 150,000g/mol3) The 0.001 g/ml is divided by 150,000 0.001÷150000= 6.67×mol/ml4) Convert mol to µmol by 6.67×mol/ml × = 6.67µmol/ml5) Kcat= Vmax÷[E]t Kcat = 3.48 ÷ 6.67 = 5217min-11/60 5217 = 86.95 s-1Summary tableVmax, Km and Kcat values for each substrate and each analytical method used have been summarized in the tables below.

Table 16 EthanolPropan-1-olButan-1-olVelocityVmax (V)4.20.851.145Km (M)0.0310.070.015Kcat   Lineweaver BurkVmax (V)3.480.821.076Km (M)0.010.010.011Kcat86.9520.4826.88Eadie HofsteeVmax (V)4.960.9131.25Km (M)0.0260.010.016Kcat123.9322.8131.23Lineweaver BurkFor the Lineweaver Burk method the Vmax and Km values were worked out using the following method:Example for Propan-1-ol:Equation of the linear line: y=0.007x + 1.216Step 1The value 1.216 has been taken from the linear line equation, which in this case is C in the equation.

Step 2Km = Slope VmaxThe value for the slop was taken from the linear line equation which was the gradient. The Vmax in the above equation has already been calculated in step 1.Eadie HofsteeExample for Butan-1-ol:Linear line equation: y=-62.20x + 77.92Y=0To work out the Vmax we want “x” to be the subject therefore:To work out the Km the following equation was used:The -62.20 value was taken from the gradient of the linear line equation. This value of gradient was then by -1 because this value was part of the Eadie Hofstee equation.

DiscussionOnly the first 4 plots were used in making the Absorbance vs. Time because using all the absorbance values would give a curvy orientation to the graph. The reason for this is that the enzyme sites were occupied by the substrates because of which there were no more enzymes sites where the substrate could bind. This is an indication of the Vmax meaning the all the catalytic sites have been occupied and the enzyme has become saturated with the substrate.

Read More
Tags
Cite this document
  • APA
  • MLA
  • CHICAGO
(“Lab biochemistry Coursework Example | Topics and Well Written Essays - 500 words”, n.d.)
Lab biochemistry Coursework Example | Topics and Well Written Essays - 500 words. Retrieved from https://studentshare.org/chemistry/1588720-lab-biochemistry
(Lab Biochemistry Coursework Example | Topics and Well Written Essays - 500 Words)
Lab Biochemistry Coursework Example | Topics and Well Written Essays - 500 Words. https://studentshare.org/chemistry/1588720-lab-biochemistry.
“Lab Biochemistry Coursework Example | Topics and Well Written Essays - 500 Words”, n.d. https://studentshare.org/chemistry/1588720-lab-biochemistry.
  • Cited: 0 times

CHECK THESE SAMPLES OF Lab biochemistry

Studies on Photosynthesis Using the Hill Reaction Report

biochemistry.... This cellular process known as photosynthesis is carried out within the chloroplasts of these organisms and involves a series of sequential… Photosynthesis is represented by the following reaction: The complex process of photosynthesis is classified in to two stages based on HILL REACTION lab REPORT pc [Pick the STUDIES ON PHOTOSYNTHESIS USING THE HILL REACTION lab REPORT Introduction Life on earth is largely based on the photochemical process of food synthesis carried out by chlorophyll carrying plants and cyanobacteria....
2 Pages (500 words) Lab Report

Protein Assay by the Bradford Method

It is worth noting that there is no single most significant protein assay method known to cause utterly perfect results.... This, thus, means that it all depends on the desired… One such true and accurate method of protein concentration determination involves using the acid hydrolyzing of a portion of sample and carrying out amino acid However, this method is somewhat expensive and a time consuming....
9 Pages (2250 words) Lab Report

Maltose Fermentation by Saccharomyces Cerevisiae

The results obtained indicated that lower concentrations of maltose led to production of higher concentrations of carbon dioxide with time.... Higher concentrations of maltose… Fermentation is the process in which carbohydrates are converted into alcohols under anaerobic conditions with the aid of yeasts and bacteria or a combination of both with the concomitant production of carbon Maltose is a disaccharide which is composed of two units of glucose joined with an α(1→4) bond....
4 Pages (1000 words) Lab Report

Testing of biomolecules

This report compiles various methods that have been developed in the testing of biomolecules and depict the importance of each in biochemistry....  The knowledge of the organic molecules forms the basis in the study of biochemistry and medical sciences together with understanding how the body works....
5 Pages (1250 words) Lab Report

Catabolite Repression and Induction of Beta-galactosidase Synthesis

The paper "Catabolite Repression and Induction of Beta-galactosidase Synthesis" demonstrates both catabolite repression and induction of beta-galactosidase synthesis during growth of E.... coli Synthesis of the enzyme beta-galactosidase is induced in wild-type E.... coli strains in response to the presence of lactose....
6 Pages (1500 words) Lab Report

Lactase Enzyme Activity

The present report is focused on the peculiarities of the lactase enzyme activity.... The first thing to be mentioned is that enzymes are biological molecules made up of a complex protein that catalyzes specific chemical change in living organisms.... … According to the author of the report, enzymes are capable of regulating the rate at which chemical reactions occur without being altered in the process....
6 Pages (1500 words) Lab Report

Genetics and Molecular Biology

This work "Genetics and Molecular Biology" describes the extraction of DNA mitochondrion from meat products that were recently exhibited by scandals owing to a public claim that they had been contaminated with horse meat.... The author outlines a PCR experiment geared towards identifying the specific components of the meat products....
6 Pages (1500 words) Lab Report

Chemical Kinetics

The paper "Chemical Kinetics" reports the reaction was timed essentially till the end.... The rate of chemical reaction was hypothesized from the concentration of the reactant at the end of the experiment.... From the experiment, it was found out that permanganate was a limiting reaction.... nbsp;… The main objective of the experiment was to find out the rate constant and the rate law when oxalic acid reacts with permanganate....
6 Pages (1500 words) Lab Report
sponsored ads
We use cookies to create the best experience for you. Keep on browsing if you are OK with that, or find out how to manage cookies.
Contact Us