StudentShare
Contact Us
Sign In / Sign Up for FREE
Search
Go to advanced search...
Free

The Level of Distress - Assignment Example

Cite this document
Summary
This paper 'The Level of Distress ' tells that Interest was in testing whether the mean level of distress differs across the different levels of financial strain with regards to difficulties in paying bills. Null hypothesis: the mean level of distress is the same across the levels of financial strain…
Download full paper File format: .doc, available for editing
GRAB THE BEST PAPER93.6% of users find it useful
The Level of Distress
Read Text Preview

Extract of sample "The Level of Distress"

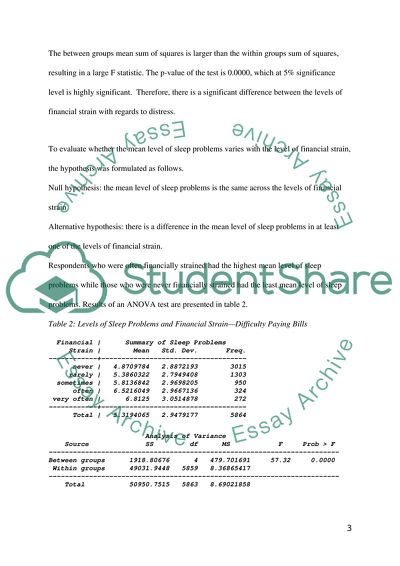
Quantitative Analysis in Social Science Research ID Question Interest was in testing whether the mean level of distress differs across the different levels of financial strain with regards to difficulties in paying bills. The hypothesis being tested is as follows Null hypothesis: the mean level of distress is the same across the levels of financial strain Alternative hypothesis: there is a difference in the mean level of distress in at least one of the levels of financial strain. The distribution of respondents based on their financial strain revealed that those who were very often financially strained had the highest distress levels while those who never were financially strained had the lowest distress level. An ANOVA test for whether there was a significant difference in the groups is shown in table 1. Table 1: Levels of Distress and Financial Strain—Difficulty Paying Bills financial | Summary of Distress strain | Mean Std. Dev. Freq. ------------+------------------------------------ never | 7.1135909 4.6651367 3002 rarely | 8.0343511 4.401147 1310 sometimes | 9.6756198 5.1753277 968 often | 10.764706 5.1637426 340 very often | 11.045455 5.7949559 330 ------------+------------------------------------ Total | 8.1598319 4.9749921 5950 Analysis of Variance Source SS df MS F Prob > F ------------------------------------------------------------------------ Between groups 10585.6409 4 2646.41022 115.13 0.0000 Within groups 136655.359 5945 22.9866037 ------------------------------------------------------------------------ Total 147241 5949 24.7505463 The between groups mean sum of squares is larger than the within groups sum of squares, resulting in a large F statistic. The p-value of the test is 0.0000, which at 5% significance level is highly significant. Therefore, there is a significant difference between the levels of financial strain with regards to distress. To evaluate whether the mean level of sleep problems varies with the level of financial strain, the hypothesis was formulated as follows. Null hypothesis: the mean level of sleep problems is the same across the levels of financial strain Alternative hypothesis: there is a difference in the mean level of sleep problems in at least one of the levels of financial strain. Respondents who were often financially strained had the highest mean level of sleep problems while those who were never financially strained had the least mean level of sleep problems. Results of an ANOVA test are presented in table 2. Table 2: Levels of Sleep Problems and Financial Strain—Difficulty Paying Bills Financial | Summary of Sleep Problems Strain | Mean Std. Dev. Freq. ------------+------------------------------------ never | 4.8709784 2.8872193 3015 rarely | 5.3860322 2.7949408 1303 sometimes | 5.8136842 2.9698205 950 often | 6.5216049 2.9667136 324 very often | 6.8125 3.0514878 272 ------------+------------------------------------ Total | 5.3194065 2.9479177 5864 Analysis of Variance Source SS df MS F Prob > F ------------------------------------------------------------------------ Between groups 1918.80676 4 479.701691 57.32 0.0000 Within groups 49031.9448 5859 8.36865417 ------------------------------------------------------------------------ Total 50950.7515 5863 8.69021858 As before, the mean sum of squares between the financial strain levels was much larger than that within the financial strain levels. This resulted in a large F statistic with a highly significant p-value (0.000) at 5% alpha level. The level of distress was hypothesized to vary with the education level of respondents. The corresponding hypothesis can be stated as follows; Null hypothesis: the mean distress level is the same across the levels of respondent’s education Alternative hypothesis: there is a difference in the mean distress levels in at least one of the respondents’ education levels. From the summary statistics (table 3 ), the respondents who had an 8th grade or less education level had the highest mean level of distress while graduates or those with advanced degree (MA/PHD) had the lowest mean distress levels. Results of an ANOVA test are presented in table 3. The P-value of 0.1573 is indicative of a non-significant difference in the mean distress across the respondents’ education level Table 3: Levels of distress and education | Summary of Distress Education | Mean Std. Dev. Freq. ---------------------------------+------------------------------------- 8th grade or less | 9.3269231 5.5367618 52 some high school but no degree | 8.5361111 5.6295902 360 high school graduate or GED | 8.014245 5.2263214 1053 specialized vocational training | 8.0605653 5.0459178 743 some college/univ, but no degree | 8.4041184 5.0854942 777 college graduate (BA/BS degree) | 8.1724138 4.7858766 2088 graduate/advanced degree (MA/PHD)| 7.9662005 4.5994799 858 ---------------------------------+------------------------------------- Total | 8.1630416 4.9754768 5931 Analysis of Variance Source SS df MS F Prob > F ------------------------------------------------------------------------ Between groups 230.247309 6 38.3745515 1.55 0.1573 Within groups 146569.091 5924 24.7415752 ------------------------------------------------------------------------ Total 146799.339 5930 24.7553691 Further statistical analysis using ANOVA may be done to evaluate whether the respondents’ level of distress varies with their gender. The hypothesis to test is as follows; Null hypothesis: there is no significant difference in the mean distress levels between males and females Alternative hypothesis: there is a significant difference between the levels of distress in males and females We expect a significant difference and therefore reject the null hypothesis. This is because males and females react do distress situations differently. QUESTION 2 A chi square test for the existence of an association between the respondents’ gender and financial strain levels was conducted and results presented in table 4. The hypothesis being tested is as follows; Null hypothesis: there is no significant association between the respondents’ gender and financial strain. Alternative hypothesis: there is a significant association between the respondents’ gender and financial strain. From the resulting output, there was no evidence of a significant association between gender and financial strain Table 4: Gender and Financial Strain--Difficulty Paying Bills Note: Low financial strain = “never, rarely, sometimes” responses to the question in Table 3.1A; High financial strain = “often, very often” responses to this same question. FIN Strain | Men Women | Total -----------+----------------------+---------- LOW | 2,187 3,135 | 5,322 | 2,167.9 3,154.1 | 5,322.0 | 89.56 88.24 | 88.77 -----------+----------------------+---------- HIGH | 255 418 | 673 | 274.1 398.9 | 673.0 | 10.44 11.76 | 11.23 -----------+----------------------+---------- Total | 2,442 3,553 | 5,995 | 2,442.0 3,553.0 | 5,995.0 | 100.00 100.00 | 100.00 Pearson chi2(1) = 2.5398 Pr = 0.111 This chi square test was for whether there was a significant association between males and females regarding job pressure. The corresponding hypotheis was; Null hypothesis: there is no significqnt association between the respondents’ gender and the feeling of being overwhelmed (Job pressure). Alternative hypothesis: there is a significant association between the respondents’ gender and job pressure From table 5 however, there was a significant association between gender and job pressure on the respondents. Table 5: Gender and Job Pressure—Felt Overwhelmed Note: Low job pressure = “never, rarely, sometimes” responses to the question in Table 3.2A; High job pressure = “often, very often” responses to this same question. JobPressure| Men Women | Total -----------+----------------------+---------- Low | 1,761 2,339 | 4,100 | 1,672.1 2,427.9 | 4,100.0 | 72.50 66.32 | 68.84 -----------+----------------------+---------- High | 668 1,188 | 1,856 | 756.9 1,099.1 | 1,856.0 | 27.50 33.68 | 31.16 -----------+----------------------+---------- Total | 2,429 3,527 | 5,956 | 2,429.0 3,527.0 | 5,956.0 | 100.00 100.00 | 100.00 Pearson chi2(1) = 25.6261 Pr = 0.000 Of interest also was the significance of the association between education and financial strain on the respondents. Null hypothesis: there is no significant association between respondents’ education and financial strain. Alternative hypothesis: there is a significant association between respondents’ education and financial strain. Results of the chi square test are presented in table 6, from which we conclude that there is a significant association between the respondents’ education level and their financial strain. Table 6: Education and Financial Strain--Difficulty Paying Bills Notes: Low financial strain = “never, rarely, sometimes” responses to the question in Table 3.1A; High financial strain = “often, very often” responses to this same question. Low education = less than college graduate (BA/BS degree) versus “high education” = college graduate (BA/BS degree) or more (from the original Table 1.4 in Part 1). Education Financial Strain | LOW HIGH | Total -----------+----------------------+---------- Low | 2,595 2,717 | 5,312 | 2,674.2 2,637.8 | 5,312.0 | 86.38 91.70 | 89.02 -----------+----------------------+---------- High | 409 246 | 655 | 329.8 325.2 | 655.0 | 13.62 8.30 | 10.98 -----------+----------------------+---------- Total | 3,004 2,963 | 5,967 | 3,004.0 2,963.0 | 5,967.0 | 100.00 100.00 | 100.00 Pearson chi2(1) = 43.0856 Pr = 0.000 Further analysis may be done on the observations on the employees perception on their job security and whether they feel the supervisor in unfair. The appropriate hypothesis to test in this case would be; Null hypothesis: there is no significant association between job security and employees’ perception on the supervisor’s fairness. Alternative hypothesis: there is a significant association between job security and employees’ perception on the supervisor’s fairness. There might be an association between these two variables in that employees who feel insecure about their jobs may more often than not find the supervisor to be unfair to them. QUESTION 3 Regression analysis to test the existence of a significant linear relationship between the psychological distress and economic hardship index was conducted. The null hypothesis presumed that there was no significant linear relationship. This assumption was however rejected based on the p-value of the covariate (table 7). There is therefore a significant positive linear relationship between the psychological distress and the economic hardship index. Therefore the mean psychological distress increases with the increase in the economic hardship index. Table 7: Psychological Distress Regressed on Economic Hardship Index Source | SS df MS Number of obs = 5889 -------------+------------------------------ Model | 13157.5418 1 13157.5418 Residual | 132515.136 5887 22.5097904 R-squared = 0.0903 -------------+------------------------------ Total | 145672.678 5888 24.7406043 ------------------------------------------------------------------------------ Distress | Coef. Std. Err. t P>|t| [95% Conf. Interval] -------------+---------------------------------------------------------------- Econ Hardship| .6063892 .0250813 24.18 0.000 .5572206 .6555577 _cons | 4.702025 .1563131 30.08 0.000 4.395594 5.008456 ------------------------------------------------------------------------------ In testing whether there is a significant linear relationship between the psychological distress levels and the job pressure index, regression analysis was conducted. Table 8 reveals that there is a significant linear relationship between these variables. Moreover, being a positive coefficient, an increase in job pressure index by one unit results in an increase in a mean psychological distress of 0. 4931643 Table 8: Psychological Distress Regressed on Job Pressure Index Source | SS df MS Number of obs = 5888 -------------+------------------------------ Model | 15887.9279 1 15887.9279 Residual | 128355.789 5886 21.8069639 R-squared = 0.1101 -------------+------------------------------ Total | 144243.717 5887 24.5020753 ------------------------------------------------------------------------------ Distress | Coef. Std. Err. t P>|t| [95% Conf. Interval] -------------+---------------------------------------------------------------- Job Pressure | .4931643 .0182707 26.99 0.000 .457347 .5289817 _cons | 5.133067 .1269768 40.43 0.000 4.884145 5.381988 ------------------------------------------------------------------------------ Another interesting research question was evaluating the association between sleep problems index and age. Regression analysis results for the existence of a linear relationship between the sleep problems index and age are presented in table 9. From the table, there was no evidence if a significant linear relationship between sleep problems index and age based on an alpha level of 5% (P-value 0.993) Table 9: Sleep Problems Index Regressed on Age Source | SS df MS Number of obs = 5818 -------------+------------------------------ Model | .000728839 1 .000728839 Residual | 50675.7726 5816 8.71316585 R-squared = 0.0000 -------------+------------------------------ Total | 50675.7733 5817 8.71166809 ------------------------------------------------------------------------------ Sleep Probs | Coef. Std. Err. t P>|t| [95% Conf. Interval] -------------+---------------------------------------------------------------- age | .0000293 .0032053 0.01 0.993 -.0062542 .0063128 _cons | 5.324398 .1489566 35.74 0.000 5.032387 5.616408 ------------------------------------------------------------------------------ Further statistical analysis using regression analysis may be done to evaluate whether the respondents’ sleep problems index varies with their gender. The hypothesis to test is as follows; Null hypothesis: there is no significant linear relationship between the mean respondents’ sleep problems index and gender. Alternative hypothesis: there is a significant linear relationship between the mean respondents’ sleep problems index and gender. We may not expect a significant difference and therefore won’t reject the null hypothesis. Read More
Cite this document
  • APA
  • MLA
  • CHICAGO
(The Level of Distress Assignment Example | Topics and Well Written Essays - 2000 words, n.d.)
The Level of Distress Assignment Example | Topics and Well Written Essays - 2000 words. https://studentshare.org/sociology/1771816-research-analysis-on-statistics
(The Level of Distress Assignment Example | Topics and Well Written Essays - 2000 Words)
The Level of Distress Assignment Example | Topics and Well Written Essays - 2000 Words. https://studentshare.org/sociology/1771816-research-analysis-on-statistics.
“The Level of Distress Assignment Example | Topics and Well Written Essays - 2000 Words”. https://studentshare.org/sociology/1771816-research-analysis-on-statistics.
  • Cited: 0 times

CHECK THESE SAMPLES OF The Level of Distress

Defining the Culture of an Organization

Discussion 8 1.... Would you consider the culture of your organization to be more proactive or reactive?... ? What example can you give to support your assessment?... The culture of our organization is one that I would categorize as proactive more than reactive.... By proactive is meant that the firm takes a strategic approach in its planning and execution, seeking to forecast the likely scenarios and having an action plan ready the scenarios that had been drawn up....
1 Pages (250 words) Essay

An Intervention to Reduce Stress Level of Medical Staff On a Cancer Ward

This will enable the researchers to determine the level of improvements from the treatment and the analysis after the intervention will enable the researchers to make a comparison.... The pre test group will be evaluated to determine the initial level of stress among the staff members before the intervention....
6 Pages (1500 words) Essay

Year 12 stress levels for australian students

Reports from the Australian Bureau of Statistics paint an alarming picture – while the 15-19 group is still one of the lowest in terms of number of suicides per 100,000 people, the figures are increasing,… For Australian students, year 12 is the most important of their secondary school years....
2 Pages (500 words) Essay

How does blood pressure relate to the level of stress

The paper tells that Cardiac Cycle consists of Atrial Systole, Atrial Diastole, Ventricular Systole and Ventricular Diastole… The idea of this research emerged from the author's interest and fascination in how does blood pressure relate to the level of stress you and the other person are typically under?... How does blood pressure relate to the level of stress you and the other person are typically under?...
1 Pages (250 words) Essay

Reduce Stress in Life

According to the text, a certain level of pressure is required for people to perform but often this pressure might too much to bear and this results in stress.... certain level of pressure is required for people to perform but often this pressure might too much to bear and this results in stress.... It can cause distress and interfere with a person's ability to deal with ordinary day today situations.... nbsp;Reducing my stress level is a personal health behavior....
2 Pages (500 words) Essay

Stress Levels for London Travelers

This research “Stress Levels for London Travelers” involves a study of the rail transport in London, and particularly the subway.... It looks at the various stress levels that people face in terms of delays, time of day in which they have to travel.... hellip; The research was carried out by the filling out of questionnaires that were administered by the group members at different subway stations....
6 Pages (1500 words) Research Paper

How to Reduce the Overall Level of Stress

The paper "How to Reduce the Overall level of Stress" describes that the department or organization that represents the first responder bears little or no culpability and helping to assist in stress reduction or preparing these individuals for the stresses that they might face on a daily basis.... hellip; The cursory level of understanding concerning the efficacy of training reveals the fact that it can only be accomplished during certain limited time frames....
5 Pages (1250 words) Essay

The Psychology of Human Destiny

… The paper “The Psychology of Human Destiny” is an engrossing version of an essay on psychology.... Proper communication and removal of the ego between two or more people help to build long term relations and ensures that the differences between people get removed.... The ability of people to remove their ego and work by looking into the shoes of another person helps to analyze the situation better....
13 Pages (3250 words) Essay
sponsored ads
We use cookies to create the best experience for you. Keep on browsing if you are OK with that, or find out how to manage cookies.
Contact Us