StudentShare
Contact Us
Sign In / Sign Up for FREE
Search
Go to advanced search...
Free

The Tiffany & Co Analysis - Research Paper Example

Cite this document
Summary
The essay "The Tiffany&Co Analysis" discusses briefly the history of the company, its products, location, distribution, and customer relation. The writer of the essay analyzes the company position by performing a SWOT analysis to determine the various parameters influencing the company…
Download full paper File format: .doc, available for editing
GRAB THE BEST PAPER95.9% of users find it useful
The Tiffany & Co Analysis
Read Text Preview

Extract of sample "The Tiffany & Co Analysis"

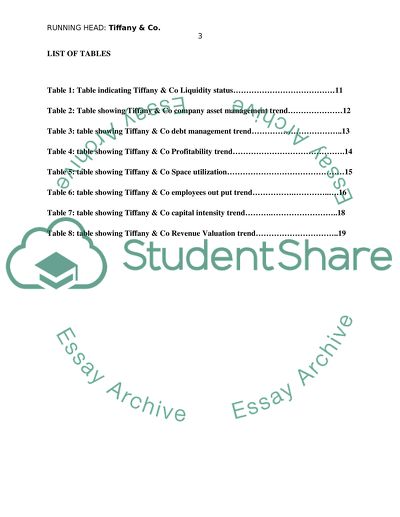
The Tiffany & Co Analysis 1. Executive summery This article is about Tiffany & Co analysis as a high end jewelry company. We discuss briefly the history of the company history, its products, pioneers, location and distribution globally, and customer relation. The article also exploits the company’s’ new ventures in the jewelry industry. We also analyze the company position by performing a SWOT analysis to determine the various parameters influencing the company. The company has profound strength in its strong local existence, Positive brand image, well known for its silvery jewelry and strong direct selling strategy. Tiffany has some weakness as a result of declining cash flows and limited product range. Contrary to the weakness, the company prides in a number of opportunities such as Singapore as a luxury retail hub for Asian market and new business venture- Corporation with other companies to expand its market dominance. For the company to maintain its positive growth, it has to address the following threats; Proliferation of imitation for its items and Economic slowdown This study also expands its analysis by looking at the quantitative variables that influence company performance. Here we scrutinize quantifiable variables of the company like company worth and predictable sales. The method involves analyzing profit and loss accounts, arithmetical state of the financial system, sales and earning histories. The variables discussed in this section are; Financial Ratio Analysis, Industry Specific Metrics and EV/Revenue Valuation. Under financial analysis we study the company’s Liquidity, Asset, and debt Management and Profitability status. For specific company metrics; Sales per Retail Square Foot, Sales per Employee and Capital Intensity are as well discussed. The analysis winds with a EV/Revenue Valuation. The article finalizes by making suggestions which if incorporated can boost the company revenue, increase customer relation and deliver quality products to customers. The change in the company’s old model of management and market strategy will improve its goods and service delivery. We also take a conclusive analysis relating both quantitative and qualitative analysis to give advice to investor, buyers and company management on critical issues that needs to be addressed. We close the study by not recommending major fix within the company, but an advice to investor of the current company position and worthiness of making an investment. The fluctuations in major determining factors do not necessarily mean that the company is on the fall, but rather is responding to a change in prevailing conditions. Tiffany has shown excellent response to change in key determining factors like recession. Introduction Tiffany & co. is the most popular lavish jewelry corporation in the United States of America. For over a century and a half, Tiffany & co. have designed superb jewelry comprising of diamond. The company often uses Tiffany & co and just Tiffany as its main trademark, and at same time as its trade name. The names TIFFANY & CO, TIFFANY and Tiffany blue box are widely used as owner’s trademark among its subsidiary company. Also a color term Tiffany blue is used for its product samples in the US and other countries. In a quest to for tiffany to maintain its giant market and dominance, we study the company pattern to maintain customer satisfaction and its prolonged dominance. This study involves a quantitative and qualitative analysis (a SWOT analysis,) for tiffany to gauge its position. This analysis also gives recommendations to potential investors and the company at large on its current position. 2. Qualitative analysis Qualitative analysis is a method that is used to assess investigate or company opportunities and decide by use of non-quantifiable method. It is mainly used as a tool to get a close look at a company. However, Sound company conclusion often comprises incorporation of both methods. (investinganswers.com) to help us analysis tiffany & co. we are going to perform a SWOT analysis for the company. SWOT Analysis is a method to evaluate the strengths, weaknesses, opportunities, and threats which affect a particular company’s progress and decision making. (wikiwealth.com) 2.1Strength These are inside generated extended terms that give tiffany advantage in the jewelry industry. Strength offers tiffany prolonged advantage over its competitors. Strong local and international existence The company has enormous store located in busy traffic places where customers can easily purchase products. It has stores in Singapore as from 1991 and over the entire period it has created a huge local existence. The company has expanded market through the world with major destination of its products in the US and Asia. The company also has market in selected African countries. Positive brand image The brand has dominated the United States market as well as market outside the US. Singapore people are vast with the brand.  It’s fashionable and stylish brand image reliability give it an international reputation. Tiffany products are well recognized for their quality which promotes its brand. Well known for its silvery jewelry Singapore dwellers for example, the sterling silver jewelry is very much popular and common among women. It is also a common product offered as gift worldwide. Sterling Silvery jewelry is among the latest advancements in tiffany product. This product has had a positive market response with high sale in Asian countries and the United States. (forbes.com) Strong direct selling strategy The company has a direct allocation channel. Within the United States, there are direct sales through tiffany stores and via business to business selling. World wide there are tiffany supply stores and boutiques. Tiffany products are sold online (tiffany.com) or through catalog supply. Through its website it offers a selection of over 3,500 products. In addition, it offers online retail service through the tiffany business portal. In 2007 there were 3.2 million names on US catalog mail and internet list. This was a rise from 2.8 million people recorded in 2005.This rising trended is showing same trend each fiscal year. 2.2Weakness Similarly, these are internally created. A weakness is a thing that causes issues for the essential company; it takes substantial time and attempt to solve and are generated or managed from within the company. Declining cash flows Comparing company operations for 2007 and 2006, there was a decline of 11.1%. In 2007 sales were $233.6 million while in 2006 the sales were $262.7 million. Also free cash flow went down by 51.6% ($51.2 million) in 2007 as opposed to 2006 ($105.7 million).This reduction in flow are restraining the company’s monetary position. Later this will bind tiffany’s’ venture options and dividends to share holders Limited product range A wide range of product is common in the US market contrary to markets within other countries. The US supplies benefit from a larger variety of design and limited version jewelry. In Singapore for instance, sterling silver assortment is tough. The company is not supposed to over concentrate on this but should be concerned with promotion of other jewelry to uphold consumer benefit. 2.3Opportunity These are external circumstances that are an advantage to a business. If these circumstances are taken into consideration then the company is likely to increase in output though it is not always a guarantee. Singapore as a luxury retail hub for Asian market Singapore is a good hub for Asian market. It is a first target for Chinese tourist to purchase luxury jewelry items. For the past two decade china and Asian countries have had a continuous positive economic growth and a change in lifestyle. Change in lifestyle has also been accompanied with demand for flashy jewelry product. Singapore acts as a hub for Asian countries market. (globalchange.com) New business venture In 2006 Tiffany signed a decade of eyewear certificate agreement with Luxottica Group for manufacturing, design and global distribution. These products are under tiffany and company trade name. This consignment leads tiffany to enter eyewear product, launch of lavish collection from 2008.This venture diversify its wide collection of products and hence enable customers to have a wide selection of products. 2.4Threats These are outside circumstances that are demerits to a company’s success. These may include an economy uncertainty or closed economy in a SWOT analysis. Proliferation of imitation for its items Lately, Tiffany & Co did not get through with the appeal against Ebay. It launched a court suite to end its trademark breach for promotion of forged goods on its website. Since Ebay is not responsible for counterfeit vendors; the corporation has to devise methods to penalize person found guilty. Economic slowdown From a business research carried out in April 2012, approximately 34% of people are having a second thought on buying luxury jewelry and watches. This has affected the sale of tiffany product to a large extent. The slowdown in buying will finally convert to lesser profits for the company. Also a major recession that hit the western country for nearly a decade now has slowed down flown of tiffany products, hence a threat to its set goals 3. Quantitative analysis This is a numerical scrutiny of the quantifiable figures of a business, such as the worth of property or predictable sales. It exempts from skewed evaluation of the excellence of administration. The method involves analyzing profit and loss accounts, arithmetical state of the financial system, sales and earning histories rather than looking at skewed factors like management know-how, workers attitude, and brand acknowledgment (thefreedictionary.com). 3.1Financial Ratio Analysis Liquidity ratio Tiffany & co. has maintained is short term goals amid global recession and low demand for luxury goods. It has had a current ratio above three for almost a decade. Its quick ratio is less compared to the current ratio as a result of high inventory level. These levels are usually a matter of concern for tiffany, it’s not as the inventory comprised of valuable commodities like gold, platinum and diamond. Liquidity ratios analyses fast and simple the company can translate its assets to cash. Observably the simpler it is to change; the cheaper it is as well. Tiffany’s high Current ratio shows that it has a high cash flow. This figures to investors and analysis shows how ready the company is to meet its due, loans and short term loans. Tiffany & co 2006 2007 2008 2009 2010 2011 2012 Current Ratio 4.66 3.77 3.15 3.40 4.07 5.59 4.61 Quick Ratio 1.77 1.03 1.03 0.74 1.70 2.21 1.30 Cash Ratio 1.08 0.42 0.42 0.27 1.30 1.54 0.71 Source: Tiffany & Co Table 1: Table indicating Tiffany & Co Liquidity status Asset Management The company has an average asset management rating. It is close to the bottom or middle in the midst of its peers with regard to inventory management, entire asset turnover and set asset turnover. This is as a result of high value jewelry sells at a first-class price that attracts upper class customers and therefore do not rely on number of sales with comparison to other companies that sell law quality merchandise in large quantities. As it is a tradition for luxury co operations to experience low turnover, for Tiffany DSI is on the rise. The company records effective asset management understands their assets, know where they are, know who to control, their true value and improvement to reduce losses. Tiffany & co 2006 2007 2008 2009 2010 2011 2012 Days Sales in Inventory (DSI) 367.55 378.07 390.89 481.20 441.86 469.70 507.26 Average Collection Period (ACP) 20.68 23.29 24.09 21.38 21.38 22.00 18.44 Fixed Asset Turnover 2.77 2.84 3.93 3.86 3.96 4.64 4.75 Total Asset Turnover 0.86 0.93 0.98 0.92 0.78 0.83 0.88 Source: Tiffany & Co Table 2: Table showing Tiffany & Co company asset management trend Debt Management Tiffany’s present capital formation consists primarily of equity which is in accordance with latest chronological trends. While this may at the outset appear to be a below average for the reason that the rate of equity is superior compared to that of liability, further scrutiny demonstrates the reason as to why it is good to have equity in such a case. The company operates in an extremely cyclical commerce sphere where downturn effects in wealth are exacerbated due to the optional nature of the luxury sells. This means as equity raises, tiffany is in a better to counter recession. This is an indication a good debt management plan; sets direct debts on payment, sets reminders on debts, consolidates debits, aims to increase income to service depts and reduces expenses. Tiffany & Co. 2006 2007 2008 2009 2010 2011 2011 Debt Ratio 0.34 0.37 0.43 0.49 0.46 0.42 0.44 Debt to Equity 0.52 0.58 0.75 0.95 0.85 0.72 0.77 Days Payable Outstanding (DPO) 70.26 67.22 55.25 67.19 71.77 74.74 80.49 Times Interest Earned 16.59 15.93 22.54 12.93 8.00 10.95 14.58 Source: Tiffany & Co Table 3: table showing Tiffany & Co debt management trend Profitability Tiffany has had good market profits as a result of pricing for its products. Even within the recession period, the company has maintained its profit margins. Profit margins are on the rise; 56% for 2010 to almost 60% in 2012, while operational margins rose from 16% for 2010 to almost 20% in 2012. These profitability ratios illustrate the company's general efficiency and performance. These profit margins measure are after considering expenses including depreciation, taxes, and interest. Tiffany & Co. 2006 (%) 2007 (%) 2008 (%) 2009 (%) 2010 (%) 2011 (%) 2012 (%) Gross Profit Margin 56.04 555.72 56.39 57.53 56.47 59.06 59.5 Operating Profit Margin 15.98 15.69 18.96 13.11 16.26 19.26 19.45 Net Profit Margin 10.63 9.59 11.01 7.69 9.77 11.94 12.05 Return on Assets 9.17 8.92 10.78 7.09 7.59 9.86 10.56 Return on Equity 13.91 140.4 18.85 13.85 14.92 16.92 18.70 Source: Tiffany & Co Table 4: table showing Tiffany & Co Profitability trend 3.2Industry Specific Metrics Sales per Retail Square Foot Sales per Retail Square Foot Fiscal year ending 12/31 2009 20010 2011 2012 Americas $2,644.39 $2,252.31 $2,446.51 $2,733.14 Asia-Pacific $3,704.83 $3,686.36 $4,267.26 $4,968.22 Japan $3,704.83 $3,686.36 $3,720.47 $4,293.21 Europe $2,936.48 $3,038.90 $3,344.12 $3,766.91 Overall $3,049.06 $2,761.42 $3,005.84 $3,417.03 Source: Tiffany & Co Table 5: table showing Tiffany & Co Space utilization The sales/retail square feet is an assessment of profits divided by the actual estate footage the company owns apart from the area used to store stock and hold office, it only includes retail area. If this figure is high it means that the corporation is optimizing its assets to raise revenue and minimize costs. Tiffany has gradually increased its sale per square foot which is credited for its elevated natural expansion. Tiffany is second best rank after Apple in the US for sale per retail square foot. Sales per Employee Sales per Employee Fiscal year ending 12/31 2008 2009 2010 2011 2012 Total Number of Employees 8,800 9,000 8,400 9,200 9,800 Total Annual Revenue (in thousands) $2,938,771 $2,848,859 $2,709,704 $3,085,290 $3,642,937 Revenue per employee (in thousands) $333.95 $316.54 $322.58 $335.36 $371.73 Source: Tiffany & Co Table 6: table showing Tiffany & Co employees out put trend Sales per employee is the simple metric measuring on average how much revenue an employee brings in per year. This is a valuable metric because employee pay and work costs tend to make up a big proportion of operating costs. Over the past 5 years Tiffany has managed to increase this metric every year with the exception of fiscal year ending 2009 when it hired more employees while losing revenue. Ever since on average TIF has been raising revenue at a faster rate than it higher employees. In general, the larger the figure the more effective the company employees humans as a resource; however this figure is only directly used when making comparison with other firms of similar nature. Moreover there are no standards which govern best levels of income per employee. Since tiffany is a giant jewelry company with high Sales per Employee figures, the company has best human resource deployment strategy compared to other players in the same jewelry industry. The Sales per Employee can also be use to define management efficiencies; therefore, tiffany exhibits best practices as far as management is concerned. Capital Intensity Capital Intensity ratio (Total Capital/Net Revenue) signifies that it (tiffany) require more money and resources to create a single sales unit. The ratio is frequently used to evaluation a company’s competent exploitation of its assets. This ratio measure how tiffany has invested in total assets as compared to its earning in revenue. This figure shows the ability of tiffany to use its capital to generate a single unit of its revenue. Tiffany has shown strength to its capital intensity ration study. Comparing tiffany and its competitors in the same industry, it has a stable ratio than others. We can conclude that this company’s management employs best strategies to to have high capital intensity. Capital Intensity 2007 2008 2009 2010 2011 Average Tiffany & Co. 1.02 1.09 1.29 1.21 1.14 1015 Signet 1.01 0.92 0.93 0.90 0.96 0.95 Zales 0.74 0.66 0.69 0.72 0.68 0.70 Industry Average 0.93 0.89 0.97 0.94 0.93 0.93 Source: Tiffany & Co Table 7: table showing Tiffany & Co capital intensity trend 3.3Enterprise Value Revenue Valuation This valuation technique compares tiffany value to its sales. This value is also use by investors to get a clue to the company’s sales worth. This measure is accurate as capitalization of market is not considered unlike the enterprise value that considers debts of the company. The EV/sale computation can be negatively skewed when company cash is higher than the debt structure and market capitalization, indicating that the company be bought by means of its own cash. 2007 2008 2009 2010 2011 Average Tiffany & Co. 2.10 1.64 1.40 1.97 2.42 1.90 Signet 0.56 0.39 0.52 0.74 0.85 0.61 Zales 0.61 0.34 0.40 0.72 0.94 0.60 Peer Average 1.09 0.79 0.77 1.14 1.40 1.04 Source: Tiffany & Co Table 8: table showing Tiffany & Co Revenue Valuation trend Enterprise Value Revenue Assumptions The analysis of EV/Revenue multiples for Tiffany & Co alongside its competitors, the company revenue is evident for trade premium assigned. To commence the assessment we employ both the major likelihood and cynical revenue facts predictable in the pro forma income account. The faction chose to pertain the half decade chronological manifold to the pessimistic situation and the standardize manifold realized in 2010 and 2011. 4. Recommendation There is no major recommendation for a major fix within Tiffany & Co models. Rather, the company’s 100 year old tactic should be somewhat be modified and updated to cop up with the changing global economies and purchaser preferences. Tiffany & Co is facing two strategic issues. The primary one is the danger the brand, it is being alleged as of inferior quality comparative to its competitors. Since its start, Tiffany & Co has all ears on sterling silver. The triumph of sterling silver, indicated by the Elsa Peretti heart necklace has enlarged access to its brand to more market. However, enlarged availability and affordability has resulted in the Company brand trailing in status related with uniqueness and luxury. Tiffany is a vast and powerful company with a competitive advantage due to its brand in the lavishness jewelry product industry. It shows expansion potential but for the subsequent reasons it’s a recommending not buy: The stock value reflects growth prospective and positive traits of the corporation but the stock for most parts is fairly valued. There are many threats that exist and can unfavorably influence cash flows as well as prospective market worth. Towards end of 2012, the company’s gross profit margins remain unchanged as compared to previous year. Sales increased though net income decreased. The company generally has a weak liquidity ratio. A quick ratio of 0.71, indicate inability to curve short-term needs for 2012. The cooperation has shown strength in liquidity. High current ratio does not always mean that tiffany has a high cash flow; there are exceptions in this concept. This exception may be fatal to investors. Overall, its worth investing with tiffany due to its management policy to utilize its resource and maintain growth. The EV/sales is at times deceiving: high EV/Sales does not necessarily mean a bad performance, it can be a symbol that investors think the prospect of sales will increase. Lower EV/sales can be an indicator that the upcoming sales predictions are not attractive. It is essential to evaluate this quantity to that of other players in the same industry, and have deeper analyses into the company in the case study. A study into jewelry industry with comparison to other companies, enterprise revenue valuation for tiffany is high. A high enterprise revenue valuation indicates better management of generated revenue. Therefore, tiffany has show excellent utilization of its revenue as compared to other players in the very industry. It’s worth concluding that tiffany are champions in the jewelry industry, hence it’s recommendable to invest in the industry. 5. References http://brandtiffanyandco.wordpress.com/brand-positioning. Retrieved 28 November 2012 Tiffany & Co, (2007), SWOT Analysis, Data monitor. Jenn Wilcox, Scott Damassa, Zeeshan Hyder, (2007), Harkness Consulting Innovation through Collaboration, Harkness Consulting. Global change.com, Apr. 2011, Retrieved 10 Dec 2012 http://forbes.com, Tiffany & Co. (NYSE: TIF), 2012 , Retrieved 10 Dec 2012 Dietz, Ulysses Grant, Jenna Weissman Joselit, and Kevin J. Smead, (1992), The Glitter and the Gold: Fashioning America’s Jewelry. Newark. Kirk Craig, Brian Pabian, Ben Smith, (2012), Tiffany & Co, Tiffany & Co. http://www.thestreet.com/r/ratings/reports/analysis/TIF.html, june 2012. Retrived 10 December 2012 Kirk Craig, Brian Pabian, Ben Smith, (2012), Tiffany & Co, Tiffany & Co Loring, John, (1999), Tiffany Jewels. New York: Abrams, Loring, John. (1987), Tiffany’s 150 Years, New York: Doubleday, Hood, William P., with Roslyn Berlin and Edward Wawrynek, (1845–1905), Suffolk, England: Antique Collectors Club Hood, William P., with Roslyn Berlin and Edward Wawrynek, (1999) Tiffany Silver Flatware: When Dining was an Art. Suffolk, England: Antique Collectors Club, Bezdek, Richard H, (1999), American Swords and Sword Makers, Boulder, Colorado: Paladin Press, Bizot, Chantal, Marie-Noël de Gary, and Évelyne Possémé, (2001), The Jewels of Jean Schlumberger, New York: Harry N. Abrams, Publisher, (English translation) Read More
Cite this document
  • APA
  • MLA
  • CHICAGO
(“The Tiffany & Co Analysis Research Paper Example | Topics and Well Written Essays - 3750 words”, n.d.)
The Tiffany & Co Analysis Research Paper Example | Topics and Well Written Essays - 3750 words. Retrieved from https://studentshare.org/marketing/1402562-tiffany-co
(The Tiffany & Co Analysis Research Paper Example | Topics and Well Written Essays - 3750 Words)
The Tiffany & Co Analysis Research Paper Example | Topics and Well Written Essays - 3750 Words. https://studentshare.org/marketing/1402562-tiffany-co.
“The Tiffany & Co Analysis Research Paper Example | Topics and Well Written Essays - 3750 Words”, n.d. https://studentshare.org/marketing/1402562-tiffany-co.
  • Cited: 0 times

CHECK THESE SAMPLES OF The Tiffany & Co Analysis

Tiffany & Co. analysis

This paper is mainly about Tiffany & co analysis.... It sets the background of this company through a briefly the history, its products, pioneers, location and distribution globally, and customer relation and analyzes the company's position through performing a SWOT analysis.... hellip; This analysis also expands its portfolio through examining the quantitative variables that influences its performance, thus, scrutinizing the quantifiable variables of the company like company worth and predictable sales....
17 Pages (4250 words) Essay

The Franklin Fund and Tiffany & Co

The essay "The Franklin Fund and Tiffany & co" is a project report on Atlas Investments.... The writer of this essay analyzes whether The Franklin Fun' should invest at Tiffany & co.... hellip; Established first in New York in the year 1830, Tiffany & co.... Tiffany & co.... A brief history of the company Established first in New York in the year 1830, Tiffany & co.... It was in 1867, that Tiffany and co got international recognition, when a foreign jury at Paris Exposition Universelle handed over the grand prize for silver craftsmanship....
8 Pages (2000 words) Research Paper

Swatch Marketing Strategy

In this report, stress should be given to analyzing the marketing function, product design function, and the operation function of Swiss Watch industry.... This research tells that Swiss Watch and Clock Industry is one of the leading industries in the global markets.... hellip; The research has identified that Swiss Watch and Clock Industry are contributing a major portion towards the economy as a whole....
8 Pages (2000 words) Case Study

A Comparison of Moon River Breakfast at Tiffany's

It also provides the resader with analysis of the original soundtrack score of the film and explores differences between versions of Moon River.... The researcher then gives comparison and analysis of the recordings.... This essay focuses on comparison of the recordings that were used in the Breakfast at tiffany's movie and written by Henry Mancini.... This essay not only describes the background of Breakfast at tiffany's, it's actors and creation process, but also deeply analyzes the power of the music in the movie and methods that were used to impress the viewer, such as music tempo, dynamic and overall style....
8 Pages (2000 words) Essay

Financial Analysis: Tiffany & Co

With the rapidly changing business environment, performing an environmental scan is becoming increasingly important for business entities like tiffany.... Conducting this scan In discussing tiffany in the context of the forces considered in performing and environmental scan, it has been evident that the last couple of years, politics and economics have continued to play a critical role in driving different companies in the jewelry industry so as to stay competitive....
4 Pages (1000 words) Essay

Hurricane Andrew in Florida

This research paper “Hurricane Andrew in Florida” depicts the socioeconomic, physical, and psychological impact of Hurricane Andrew in the process of shaping Miami Dade County, Florida.... In the early morning hours of August 24, 1992, a powerful category 5 hurricane made landfall in Miami....
14 Pages (3500 words) Research Paper

Tiffany Marketing Strategy through Segmentation, Targeting and Positioning

Also, the author examines the applying these methods for widening a market of the tiffany company… The paper describes the prospective client company (Tiffany & Co) and their product and market details, gives a theoretical description and analysis of the principles and practices of the process of market segmentation, targeting and product positioning and examines the applying these principles and practices in the context of Tiffany and co.... The researcher of the paper examines marketing strategy of tiffany company which includes a segmentation, targeting and positioning....
6 Pages (1500 words) Essay

Breakfast at Tiffanys

The analysis I will focus on is specifically for the time between 00:41:55-00:43:55.... nbsp;She is portrayed as a naïve, unusual societal girl and as the film begins, she is seen alighting from a yellow taxi at Tiffany & co.... She is portrayed as a naïve, unusual societal girl and as the film begins, she is seen alighting from a yellow taxi at Tiffany & co, walks past the door to look into the windows as she eats the pastry and the coffee she had brought (0:00–0:45, no implied temporal ellipses)....
2 Pages (500 words) Admission/Application Essay
sponsored ads
We use cookies to create the best experience for you. Keep on browsing if you are OK with that, or find out how to manage cookies.
Contact Us