StudentShare
Contact Us
Sign In / Sign Up for FREE
Search
Go to advanced search...
Free

Protein Quantification - BCA Assay Method - Lab Report Example

Cite this document
Summary
The author of the paper "Protein Quantification - BCA Assay Method" argues in a well-organized manner that the Protein standard solutions D, E, F, G and H, 18 microcentrifuge tubes, blank(water), three unknown protein concentrations X, Y, and Z, floating rack…
Download full paper File format: .doc, available for editing
GRAB THE BEST PAPER92.9% of users find it useful
Protein Quantification - BCA Assay Method
Read Text Preview

Extract of sample "Protein Quantification - BCA Assay Method"

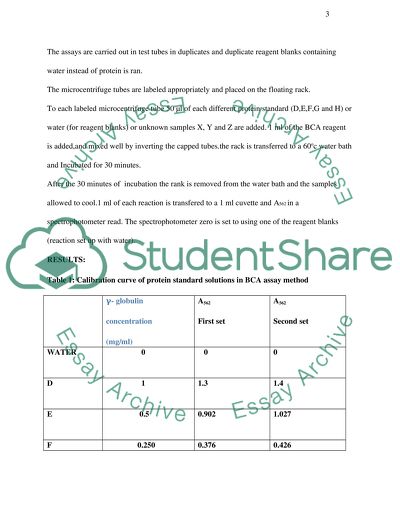
PROTEIN QUANTIFICATION By: Presented BCA assay method: Reagents: BCA reagent Solutions: Solution A g sodium bicinchoninate (BCA) 2 g sodium carbonate 0.16 g sodium tartrate 0.4 g NaOH 0.95 g sodium bicarbonate up to 100 ml with purified water pH adjusted to11.25 with 10 M NaOH Solution B: 0.4 g cupric sulphate pentahydrate in 10 ml purified water. BCA reagent: 100 volumes of solution A to 2 volumes Procedure: Required: The Protein standard solutions D,E,F,G and H, 18 microcentrifuge tubes, blank(water), three unknown protein concentrations X, Y and Z, floating rack. The assays are carried out in test tubes in duplicates and duplicate reagent blanks containing water instead of protein is ran. The microcentrifuge tubes are labeled appropriately and placed on the floating rack. To each labeled microcentrifuge tube 50 μl of each different protein standard (D,E,F,G and H) or water (for reagent blanks) or unknown samples X, Y and Z are added. 1 ml of the BCA reagent is added,and mixed well by inverting the capped tubes.the rack is transferred to a 60oc water bath and Incubated for 30 minutes. After the 30 minutes of incubation the rank is removed from the water bath and the samples allowed to cool.1 ml of each reaction is transfered to a 1 ml cuvette and A562 in a spectrophotometer read. The spectrophotometer zero is set to using one of the reagent blanks (reaction set up with water). RESULTS: Table 1: Calibration curve of protein standard solutions in BCA assay method γ- globulin concentration (mg/ml) A562 First set A562 Second set WATER 0 0 0 D 1 1.3 1.4 E 0.5 0.902 1.027 F 0.250 0.376 0.426 G 0.125 0.225 0.384 H 0.065 0.098 0.083 Calibration curve for BSA for other group BSA concentration (mg/ml) A562 First set A562 Second set WATER 0 0 0 D 1 1.643 1.669 E 0.5 1.165 1.190 F 0.250 0.640 0.672 G 0.125 0.317 0.344 H 0.065 0.148 0.164 Table 1.1: Calibration curve of unknown protein samples in γ-globulin assay method Sample A562 First set A562 Second set Average Concentration (mg/ml) X 1.408 1.408 1.408 0.949 Y 1.012 1.225 1.118 0.7537 Z 0.090 0.099 0.0945 0.0637 Calibration curve of unknown protein samples in BSA assay method Sample A562 First set A562 Second set Average Concentration (mg/ml) X 1.702 1.716 1.709 0.9255 Y 1.349 1.340 1.345 0.7284 Z 0.053 0.039 0.046 0.0249 Standard Curve using BCA Assay with BSA standard curve and y-globulin curve γ- globulin test BSA test Calculations: Coordinates: when x=0,y=0 and when x=1, y=1.4834. M1 The equation regression line(y-globulin standard curve): Coordinates: (0,0), (1,1.4834) M1= = when x=0,y=0 and when x=1, y=1.8465. M2= The equation regression line(BSA standard curve): Coordinates: (0,0), (1,1.8465) M1= = Calculate the Concentration of unknown protein samples in BSA standard:  mg/ml mg/ml Calculate the Concentration of unknown protein samples in -Globulin standard. 2.Bradford Protein Determination Method: Reagent: Bradford reagent Solutions: Bradford reagent: 100 mg Brilliant Blue G-250 50 ml 95% Ethanol 100 ml 85% orthophosphoric acid up to 1L with purified water Procedure: For the Bradford Assay the materials needed are only the protein standard C, D, E, F, and G, 18 microcentrifuge tubes, rack, unknown samples X,Y and Z. The assays are carried out in duplicate in microcentrifuge tubes. Duplicate reagent blanks containing water instead of protein are ran. The microcentrifuge tubes are labled appropriately and placed in the provided rack To each labelled test tube 20 μl of each different protein standard (C, D, E, F and G) or water (for reagent blanks) or unknown samples X, Y and Z are added. 1 ml of the Bradford reagent is added and mix well by inverting the tube and Incubated at room temperature for 5 minutes. After the 5 minutes of incubation 1 ml of each reaction is transfered to a 1 ml cuvette and A595 in a spectrophotometer is read. The spectrophotometer is set to zero using one of the reagent blanks (reaction set up with water). RESULTS: Table 2: Calibration curve of protein standard solutions in Bradford assay method γ- globulin concentration (mg/ml) A595 First set A595 Second set WATER 0 0 0 C 2 0.774 0.973 D 1 0.451 0.521 E 0.5 0.208 0.366 F 0.250 0.091 0.086 G 0.125 0.052 0.044 BSA concentration (mg/ml) A595 First set A595 Second set WATER 0 0 0 C 2 1.204 1.167 D 1 0.851 0.851 E 0.5 0.545 0.515 F 0.250 0.312 0.276 G 0.125 0.166 0.233 Table 2.1: Calibration curve of unknown protein samples in γ-globulin assay method Sample A595 First set A595 Second set Average Concentration (mg/ml) X 1.112 1.099 1.105 2.4485 Y 0.536 0.483 0.509 1.1279 Z 0.061 0.051 0.056 0.1241 Calibration curve of unknown protein samples in BSA assay method Sample A595 First set A595 Second set Average Concentration (mg/ml) X 1.458 1.412 1.435 2.1326 Y 0.609 0.554 0.5815 0.8642 Z 0.025 0.037 0.031 0.0461 Standard Curve using Bradford Assay with BSA and Y-globulin standard curve γ- globulin test BSA test Calculations: Coordinates: when x=0,y=0 and when x=2, y=0.9026. M1 The equation regression line(y-globulin standard curve): Coordinates: (0,0), (2,0.9026) M1= = when x=0,y=0 and when x=1, y=1.3458. M2= The equation regression line(BSA standard curve): Coordinates: (0,0), (2,1.3458) M1= = Calculate the Concentration of unknown protein samples in BSA standard:  mg/ml mg/ml Calculate the Concentration of unknown protein samples in -Globulin standard. 3. Protein quantification using the Lowry method: Reagents: Lowry reagent 1: 1 ml solution A 50 ml solution B Lowry reagent 2: 10 ml Folin-Ciocalteu phenol reagent 10 ml water Solutions: Protein solution of unknown concentration (X, Y, Z) Solution A: 0.5 g copper sulphate 1 g sodium citrate up to 100 ml with purified water Solution B: 20 g sodium carbonate 4 g sodium hydroxide up to 1 L purified water Procedure: Required: The Protein standard solutions F,G, H, I and J, 18 glass tubes, blank(water), three unknown protein concentrations X, Y and Z, rack. The assays are carried out in test tubes in duplicates.and duplicate reagent blanks containing water instead of protein is ran. The test tubes are labeled appropriately and placed on the rack. To each labeled test tube 500 μl of each different protein standard (F, G, H, I and J) or water (for reagent blanks) or unknown samples X, Y and Z are added. 2.5 ml of the Lowry reagent 1 is added and mixed well using the vortex mixer and Incubated at room temperature for 10 minutes. After the 10 minutes of incubation 250 μl Lowry reagent 2 are added and mixed well using the vortex mixer and Incubated for 30 minutes at room temperature. After the 30 minutes of incubation 1 ml of each reaction is transfered to a 1 ml cuvette and A750 in a spectrophotometer read.The spectrophotometer zero is set to using one of the reagent blanks (reaction set up with water). RESULTS: Table 3: Calibration curve of protein standard solutions in Lowry assay method γ – globulin concentration (mg/ml) A750 First set A750 Second set WATER 0 0 0 F 250 0.564 0.594 G 125 0.311 0.390 H 65.5 0.122 0.129 I 31.25 0.051 0.055 J 15.7 0.024 0.078 Standard Curve using Lowry Reagent with BSA standard curve and Y-globulin standard curve BSA concentration (mg/ml) A750 First set A750 Second set WATER 0 0 0 F 250 0.642 0.661 G 125 0.350 0.331 H 65.5 0.173 0.170 I 31.25 0.071 0.053 J 15.7 0.030 0.029 Table 3.1: Calibration curve of unknown protein samples in γ-globulin assay method Sample A595 First set A595 Second set Average Concentration (mg/ml) X 1.73 0.087 0.91 379.1667 Y 1.057 1.141 1.1 458.3333 Z 0.095 0.080 0.09 37.5 Calibration curve of unknown protein samples in BSA assay method Sample A595 First set A595 Second set Average Concentration (mg/ml) X 2.133 2.096 2.115 813.4615 Y 1.227 1.245 1.236 475.3846 Z 0.086 0.087 0.0865 33.2692 γ- globulin test BSA test Calculations: Coordinates: when x=0,y=0 and when x=250, y=0.6. M1 The equation regression line(y-globulin standard curve): Coordinates: (0,0), (250,0.6) M1= = when x=0,y=0 and when x=250, y=0.65. M2= The equation regression line(BSA standard curve): Coordinates: (0,0), (250,0.65) M1= = Calculate the Concentration of unknown protein samples in BSA standard: mg/ml mg/ml Calculate the Concentration of unknown protein samples in -Globulin standard. 4. Protein quantification using the Biuret method: Reagents: Biuret reagent: Solutions: Protein solution of unknown concentration (X, Y, Z) Biuret reagent: 9 g sodium potassium tartrate 3 g copper sulphate 5 g potassium iodide up to 400 ml with 0.2 M sodium hydroxide Procedure: Required: The Protein standard solutions A, B,C,D and E, 18 microcentrifuge tubes, blank(water), three unknown protein concentrations X, Y and Z, rack. The assays are carried out in tubes in duplicates.and duplicate reagent blanks containing water instead of protein is ran. The microcentrifuge tubes are labeled appropriately and placed on the rack. To each labeled test tube 100 μl of each different protein standard (A,B,C,D and E) or water (for reagent blanks) or unknown samples X, Y and Z are added. 1 ml of the Biuret reagent is added and mixed well by inverting the tubes and Incubated at room temperature for 20 minutes. After the 30 minutes of incubation 1 ml of each reaction is transfered to a 1 ml cuvette and A550 in a spectrophotometer read. The spectrophotometer zero is set to using one of the reagent blanks (reaction set up with water). Table 4: Calibration curve of protein standard solutions in Biuret assay method γ- globulin concentration (mg/ml) A550 First set A550 Second set WATER 0 0 0 A 8 0.286 0.243 B 4 0.081 0.156 C 2 0.041 0.078 D 1 0.020 0.036 E 0.5 0.017 0.020 BSA concentration (mg/ml) A550 First set A550 Second set WATER 0 0 0 A 8 0.156 0.164 B 4 0.076 0.076 C 2 0.039 0.037 D 1 0.019 0.016 E 0.5 0.009 0.007 Table 3.1: Calibration curve of unknown protein samples in γ-globulin assay method Sample A595 First set A595 Second set Average Concentration (mg/ml) X 0.308 0.295 0.302 9.3789 Y 0.011 0.014 0.013 0.4037 Z 0.003 0.003 0.003 0.0932 Calibration curve of unknown protein samples in BSA assay method Sample A595 First set A595 Second set Average Concentration (mg/ml) X 0.289 0.286 0.288 14.6193 Y 0.010 0.011 0.011 0.5584 Z 0.002 0.002 0.002 0.1015 Standard curve using Biuret Assay with BSA and y-globulin standard curves γ- globulin test BSA test Calculations: Coordinates: when x=0,y=0 and when x=8, y=0.1576. M1 The equation regression line(BSA standard curve): Coordinates: (0,0), (8,0.1576) M1= = when x=0,y=0 and when x=8, y=0.2576. M2= The equation regression line(y-globulin standard curve): Coordinates: (0,0), (8,0.2576) M1= = Calculate the Concentration of unknown protein samples in BSA standard: mg/ml mg/ml Calculate the Concentration of unknown protein samples in -Globulin standard. Sample Real concentration BCA Bradford Lowry Biuret BSA -GLO BSA -GLO BSA -GLO BSA -GLO X 12 0.926 0.949 2.133 2.449 813.46 379.17 14.619 9.379 Y 0.6 0.728 0.7537 0.864 1.128 475.38 458.33 0.558 0.404 Z 0.04 0.0249 0.06 0.046 0.124 33.27 37.5 0.1015 0.0932 Read More
Cite this document
  • APA
  • MLA
  • CHICAGO
(“Protein Quantification Lab Report Example | Topics and Well Written Essays - 2750 words”, n.d.)
Protein Quantification Lab Report Example | Topics and Well Written Essays - 2750 words. Retrieved from https://studentshare.org/health-sciences-medicine/1619725-protein-quantification
(Protein Quantification Lab Report Example | Topics and Well Written Essays - 2750 Words)
Protein Quantification Lab Report Example | Topics and Well Written Essays - 2750 Words. https://studentshare.org/health-sciences-medicine/1619725-protein-quantification.
“Protein Quantification Lab Report Example | Topics and Well Written Essays - 2750 Words”, n.d. https://studentshare.org/health-sciences-medicine/1619725-protein-quantification.
  • Cited: 0 times

CHECK THESE SAMPLES OF Protein Quantification - BCA Assay Method

Protein Estimation by Bradford's Method

Protein estimation by Bradford's method Tutor name November 2, 2012 Abstract Proteins are essential body components and are fundamental to biochemical processes in the body.... This paper applies the Bradford's method to investigate the relationship between protein concentration and absorbance rate.... Protein estimation by Bradford's method Introduction Proteins are essential components of cells and organs, a factor that forms the basis of their significance in the body as well as the need for their intake in nutrients to meet required levels for a healthy body....
3 Pages (750 words) Lab Report

Interferences in the Assay of Serum Albumin Using the Bromcresol Green Indicator

Performing a simple experiment using the Bromcresol-Green(BCG) method for Albumin concentration determination in human serum an observation was made that upon the addition of protein globulins an interference occurs raising the result significantly.... The BCG method was thoroughly researched.... When compared to a benchmark analytic method Capillary Zone Electrophoresis(CZE), the positive bias for BCG was 3.... Our experiment produced linear curves needed in detection and quantification of albumin concentrations....
10 Pages (2500 words) Lab Report

Food poisoning and skin abscess: Staphylococcus aureus

Staphylococcus aureus exist everywhere: in air, dust, water, food or on food equipment, humans, and animals.... Staphylococcus aureus is a commensal bacteria that resides in the nose and other parts of the body like the groin and gastrointestinal tract.... .... ... ... The abscess in Mr.... T's skin was caused by the localized infection of Staphylococcus aureus....
9 Pages (2250 words) Essay

The Gene Expression of Cyclin D

(2005), molecular analyses reveal the amplification, rearrangement of the cyclin D1 gene (localized on chromosome 11q13) and overexpression of cyclin D1 protein.... The paper "The Gene Expression of Cyclin D" tells that the gene expression of cyclin D1 in the given breast tumour and normal tissue specimens at mRNA level using semi-quantitative reverse transcriptase PCR and agarose gel electrophoresis techniques....
11 Pages (2750 words) Lab Report

Protein Assay by the Bradford Method

It is worth noting that there is no single most significant protein assay method known to cause utterly perfect results.... This experiment employed the Bradford protein assay method in determining of protein.... The bradford dye-binding assay is a colorimetric assay method for measuring protein concentration in solution samples.... There are various methods of protein quantification such as the Ultra violet Absorbance, Lowry Assay and bca assay (Mathews, 2000)....
9 Pages (2250 words) Lab Report

Evaluation of Extraction Methods for Trypsin Enzymes From Corn Using a Colourimetric Protein Assay

The paper "Evaluation of Extraction Methods for Trypsin Enzymes From Corn Using a Colourimetric Protein assay" is an outstanding example of a biology literature review.... The paper "Evaluation of Extraction Methods for Trypsin Enzymes From Corn Using a Colourimetric Protein assay" is an outstanding example of a biology literature review.... The paper "Evaluation of Extraction Methods for Trypsin Enzymes From Corn Using a Colourimetric Protein assay" is an outstanding example of a biology literature review....
29 Pages (7250 words) Literature review

Definition and Methods of Quantitative Investigation

The paper "Definition and Methods of Quantitative Investigation" outlines that the aim of qualitative analysis is a complete, detailed description.... In quantitative research, we classify features, count them, and construct statistical models in an attempt to explain what is observed.... ... ... ...
9 Pages (2250 words) Case Study

Body Fluid Identification in Forensics

This literature review "Body Fluid Identification in Forensics" presents the process related to the immediate identification of body fluids at the crime scene that is considered to be a vital aspect of forensic science.... Nanodrop spectrometry is mostly adopted for the purpose of assessing DNA.... ...
7 Pages (1750 words) Literature review
sponsored ads
We use cookies to create the best experience for you. Keep on browsing if you are OK with that, or find out how to manage cookies.
Contact Us