StudentShare
Contact Us
Sign In / Sign Up for FREE
Search
Go to advanced search...
Free

Financial Statements for Harvey Norman Australia - Essay Example

Cite this document
Summary
Financial statement analysis includes using ratios to compare the financial performance of Norman Harvey Australia (Fridson, 2011). The study delves into using the activity, profitability, and liquidity ratios of Harvey Norman Australia (Roth, 2010)…
Download full paper File format: .doc, available for editing
GRAB THE BEST PAPER91.4% of users find it useful
Financial Statements for Harvey Norman Australia
Read Text Preview

Extract of sample "Financial Statements for Harvey Norman Australia"

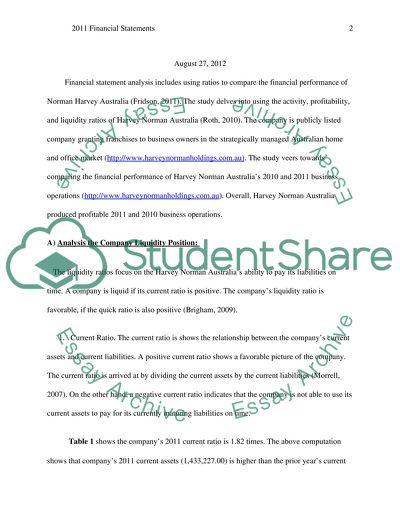
? financial ments for Harvey Norman Australia August 27, Financial ment analysis includes using ratios to compare the financial performance of Norman Harvey Australia (Fridson, 2011). The study delves into using the activity, profitability, and liquidity ratios of Harvey Norman Australia (Roth, 2010). The company is publicly listed company granting franchises to business owners in the strategically managed Australian home and office market (http://www.harveynormanholdings.com.au). The study veers towards comparing the financial performance of Harvey Norman Australia’s 2010 and 2011 business operations (http://www.harveynormanholdings.com.au). Overall, Harvey Norman Australia produced profitable 2011 and 2010 business operations. A) Analysis the Company Liquidity Position: The liquidity ratios focus on the Harvey Norman Australia’s ability to pay its liabilities on time. A company is liquid if its current ratio is positive. The company’s liquidity ratio is favorable, if the quick ratio is also positive (Brigham, 2009). 1. Current Ratio. The current ratio is shows the relationship between the company’s current assets and current liabilities. A positive current ratio shows a favorable picture of the company. The current ratio is arrived at by dividing the current assets by the current liabilities (Morrell, 2007). On the other hand, a negative current ratio indicates that the company is not able to use its current assets to pay for its currently maturing liabilities on time. Table 1 shows the company’s 2011 current ratio is 1.82 times. The above computation shows that company’s 2011 current assets (1,433,227.00) is higher than the prior year’s current assets (1,254,100). Likewise, the company’s 2011 current liabilities (786,852.00) are higher than the 2010 current liabilities (669,328.00). The ratio shows that the company’s current assets are 1.82 times higher than the company’s current liabilities. However, the company’s 2010 current ratio (1.87) is higher than the 2011 current ratio (1.82). The current ratio financial statement analysis indicates the two current ratios affirms the company performed financially better in 2010, compared to 2011. Consequently, the company will be able to pay its currently maturing obligation on time. 2. Quick Ratio. The quick ratio is shows the relationship between the company’s quick assets and current liabilities. The quick asset amount is arrived at by deducting the inventory amount from the total current asset amount. Similarly, a positive current ratio indicates a positive image of the company. The current ratio is generated by dividing the quick assets by the current liabilities (Smart, 2008). Table 2 espouses the company’s 2011 quick ratio is 6.33 times. The ratio shows that the company’s 2011 quick assets (1,291,009.00) are higher than the prior year’s quick assets (1,200,183.00). The ratio shows that the company’s quick assets are 6.33 times more than the company’s current liabilities. The company’s 2010 quick ratio (5.64) is lower than the 2011 quick ratio (6.33). Using the quick ratio financial statement analysis, the two quick ratios show the company performed financially better in 2011, when compared to 2010. The quick ratio similarly proves that the company has the available funds to defray its present liabilities. B) Activity Position: The activity ratios measure the efficiency and liquidity of Harvey Norman Australia’s management. The ratios include determining how fast the company converts cash into other assets and the other assets back into cash (Taylor, 2006). 1. Inventory Turnover Ratio. The ratio determines how fast inventory is sold. The ratio is arrived at by dividing the company’s cost of goods sold by the average inventory (Taylor, 2006). Table 3 confirms the company’s 2011 inventory turnover ratio is 11.52 times. The ratio analysis shows that the company’s 2011 cost of goods figure (1,129,517.00) is lower than the prior year’s cost of goods amount (1,344,455.00). The ratio also indicates that the company’s 2011 average inventory (98,067.50) is lower than the 2010 average inventory figure (260,775.5). The ratio illustrates that the company’s inventory is sold 6.33 times in order to generate the company’s current cost of sales amount. The company’s 2010 inventory turnover ratio (5.16) is less than the 2011 inventory turnover ratio (11.52). Based on the inventory turnover ratio analysis, the two inventory turnover ratios demonstrate that the company performed financially better in 2011, when compared to 2010. The inventory turnover ratio similarly proves that the company was able to sell more inventories in 2011, compared to the prior year (Ojugo, 2009). 2. Receivables Turnover Ratio. The receivables turnover ratio determines the relationship between the average receivables and the company’s net sales. The ratio is arrived at by dividing the net revenue by the average receivables amount (Rich, 2011). Table 4 explains the company’s 2011 receivables turnover ratio is 52.42 times. The ratio analysis shows that the company’s 2011 net credit sales figure (1,556,384.00) is better than the prior year’s net credit sales outcome (1,344,455.00). The same ratio indicates that the company’s 2011 average receivables (29,689.50) are higher than the 2010 figure, 22,012. The ratio exemplifies that the company’s receivables is turned over 52.42 times in order to generate the company’s current year net sales figure. The company’s 2010 receivables turnover ratio (61.08) is better than the 2011 inventory turnover ratio (52.422). Based on the receivables turnover ratio tool, the two receivables turnover ratios indicate that the company performed financially better in 2010, when compared to 2011. The receivables turnover ratio similarly shows convincing evidence that the company was able to collect more receivables during 2010, compared to the current year, 2011 (Porter, 2010). 3. Working Capital Turnover Ratio. The ratio focuses on the relationship between net working capital and the current year’s cost of sales amount. The ratio is used to show how many times the company’s working capital was turned over to produce the net sales. The ratio is arrived at by dividing the net sales by the net working capital. The net working capital is arrived at by deducting the current liabilities from the current assets (Gibson, 2010). Table 5 demonstrates the company’s 2011 working capital turnover ratio is 1.75 times. The ratio indicates that the company’s 2011 net working capital figure (646,376.00) is better compared to the 2010 net working capital result (584,772.00). The ratio shows convincing proof that the company’s working capital is turned over 1.75 times in order to produce the company’s current year net cost of sales figure. The company’s 2010 working capital turnover ratio (1.66) is better than the 2011 working capital turnover ratio (1.75). Using the working capital turnover ratio analysis, the two working capital turnover ratios prove that the company performed financially better in 2011, when compared to 2010. The working capital turnover ratio offers reliable proof that the company was able to better maximise its working capital during 2011, compared to the prior year, 2010 (Siddiqui, 2006). C) Profitability position: The profitability ratio shows Harvey Norman Australia’s capacity to generate profits. There popular profitability ratios are gross profit ratio, and net profit ratio. A higher profitability ratio shows a better financial picture of the company (Pinson, 2008). 1. Gross profit Ratio. The gross profit ratio focuses on the relationship between the gross profit and net sales. The ratio indicates the percentage of sales dollar that remains the costs has been incurred. The ratio is arrived at by dividing the gross profit amount by the net sales (Bragg, 2012). Table 6 illustrates that the company generated a 2011 gross profit ratio of 0.27. The ratio analysis offers reliable evidence that the company’s 2011 gross profit figure (426,867.00) is profitably higher than the prior year’s gross profit performance (376,182.00). The ratio also indicates that the company’s 2011 net sales result (1,556,384.00) is successfully better than the 2010 net sales amount (1,344,455.00). During 2011, the company successfully generated a favorable gross profit ratio. Compared to 2010, the company produced a higher 0.28 gross profit ratio. During 2011, management was no able to generate better gross profit figure, when compared to its 2010 gross profit performance. 2. Net Profit Ratio. The net profit ratio shows the financial success of the company. A company’s bottom line, success goal, or benchmark is generating periodic net profits. Without a net profit performance, the company receives a financial grade of failed. The ratio is generated by dividing the company’s net income or net profit by its net sales amount (Pinson, 2008). Table 7 indicates that the company generated a 2011 net profit ratio of 0.17. The ratio analysis offers convincing confirmation that the company’s 2011 net income amount (259,620.00) is higher than the prior year’s net income performance (237,988.00). During 2011, the company profitably ventured into business with a favorable net profit ratio. Compared to 2010, the company produced a better 0.28 net profit ratio. During 2011, management failed to keep up with the prior year’s net profit level (Gitman, 2008). 3. Return on Assets Ratio. The ratio is used to determine relation of the company’s net income to its average total assets. The ratio is generated by dividing the company’s net income by its average total assets. The ratio is sometimes called return on investment ratio. The ratio shows management’s efficiency in maximising its assets to generate the company’s net income outcomes (Wisner, 2008). Table 8 indicates that the company produced a 2011 return on assets ratio of 0.08. The ratio also brings reliable proof that the company’s 2011 average total assets (3,385,970.00) is financially better than the company’s 2010 average total assets performance (3,122,399.50). During 2011, the company profitably maximised its total assets to generate the current year’s net profits. Compared to 2010, the company generated a similar 0.08 return on assets ratio. During 2011, management was able to keep up with its prior year’s return on assets output (Walton, 2006). 4. Return on Equity Ratio. The ratio is generated to show the relation of the company’s net income to its stockholders’ equity amount. The ratio is generated by dividing the company’s net income by its current year’s stockholders’ equity figure. The ratio shows management’s efficiency in maximising its stockholders’ equity figure to produce the company’s net income performance. Table 9 discusses that the company produced a 2011 return on stockholders’ equity ratio of 0.12. The ratio affirms that the company’s 2011 stockholders’ equity figure (2,128,548.00) is profitably better than the prior year’s stockholders’ equity result (1,996,957.00). During 2011, the company profitably maximised its stockholders’ equity figure to contribute to the current year’s net profits. Compared to the 2010 operating results, the company generated a similar 0.12 return on stockholders’ equity ratio. During 2011, management successfully reached its prior year’s return on stockholders’ equity performance (Palepu, 2007). COMPUTATION: Table 1   Current Ratio   2011   2010         Current Assets = 1,433,227.00 = 1,254,100.00     Current Liabilities 786,852.00 669,328.00         1.82 = 1.87                 Table 2   Quick Ratio   2011   2010         Current Assets- Inventories = 1,291,009.00 = 1,200,183.00     Current Liabilities 203,981.50 212,949.00         6.33 = 5.64                 Table 3 Inventory Turnover Ratio       2011 2010     Cost of Goods Sold = 1,129,517.00 = 1,344,455 Average Inventory 98,067.5 260,775.5       = 11.52 = 5.16           Table 4 Receivables Turnover Ratio:       2011 2010     Net Credit Sales = 1,556,384.00 = 1,344,455.00 Average Receivables 29,689.50 22,012       = 52.42 = 61.08           Table 5 Working Capital Turnover Ratio       2011 2010     Cost of Sales = 1,129,517.00 = 968,273 Net Working Capital 646,376 584,772       = 1.75 = 1.66           Table 6   Gross Profit Ratio   2011   2010         Gross Profit = 426,867.00 = 376,182.00     Net Sales 1,556,384.00 1,344,455.00         = 0.27 = 0.28                 Table 7   Net Profit Ratio   2011   2010         Net Income = 259,620.00 = 237,988.00     Net Sales 1,556,384.00 1,344,455.00         = 0.17 = 0.18                 Table 8   Return on Assets   2011   2010         Net Income = 259,620.00 = 237,988.00     Average Total Assets 3,385,970.00 3,122,399.50         = 0.08 = 0.08                 Table 9   Return on Equity 2011   2010         Net income = 259,620.00 = 237,988.00     Equity 2,128,548.00 1,996,957.00         0.12 = 0.12                 Based on the above discussion, financial statement analysis includes using ratios used to ascertain Harvey Norman’s financial 2011 financial health. The research compares the favorable financial output of Harvey Norman Australia, based on its 2011 and 2010 financial data. The research indicates Harvey has generally healthy activity, profitability, and liquidity ratios. Management must increase its currently encouraging financial performance. Overall, Harvey Norman Australia’s financial statement analysis shows that the company generated favorable 2011 financial performance, in relation to its 2010 financial benchmarks. REFERENCES: Bragg, S. (2012). Business Ratios and Formulas. London: J. Wiley & Sons Press. Brigham, E. (2009). Fundamentals of Financial Management. London: Cengage Learning Press. Fridson, M. (2011). Financial Statement Analysis: A Practitioner's Guide. London: J. Wiley & Sons Press. Gibson, C. (2010). Financial Reporting and Analysis. London: Cengage Learning Press. Gitman, L. (2008). The Future of Business: The Essentials. London: Cengage Learning Press. Harvey Norman Australia, retrieved August 27, 2012, from http://www.harveynormanholdings.com.au/ Morrell, P. (2007). Airline Finance. London: Ashgate Press. Ojugo, C. (2009). Practical Food and Beverage Cost Control. London: Cengage Learning Press. Palepu, K. (2007). Business Analysis and Valuation. London: Cengage Learning Press. Pinson, L. (2008). Anatomy of a Business Plan. London: ACA Press. Porter, G. (2010). Financial Accounting: The Impact on Decision Makers. London: Cengage Learning Press. Rich, J. (2011). Cornerstones of Financial Accounting. London: Cengage Learning Press. Roth, M. (2010). Top Stocks 2011: A Shareholder's Guide to Leading Australian Companies. London: J.Wiley & Sons Press. Siddiqui, S. (2006). Managerial Economics and Financial Analysis. London: New Age Press. Smart, S. (2008). Corporate Finance. London: Cengage Learning Press. Taylor, J. (2006). Health Care Financial Management for Nurse Managers. London: Jones & Bartlett Press. Walton, P. (2006). Global Financial Accounting and Reporting. London: Cengage Learning Press. Wisner, J. (2008). Principles of Supply Chain Management. London: Cengage Learning Press. Read More
Cite this document
  • APA
  • MLA
  • CHICAGO
(“Financial Statements for Harvey Norman Australia Essay”, n.d.)
Financial Statements for Harvey Norman Australia Essay. Retrieved from https://studentshare.org/finance-accounting/1456276-2011-financial-statements-for-harvey-norman-australia
(Financial Statements for Harvey Norman Australia Essay)
Financial Statements for Harvey Norman Australia Essay. https://studentshare.org/finance-accounting/1456276-2011-financial-statements-for-harvey-norman-australia.
“Financial Statements for Harvey Norman Australia Essay”, n.d. https://studentshare.org/finance-accounting/1456276-2011-financial-statements-for-harvey-norman-australia.
  • Cited: 0 times

CHECK THESE SAMPLES OF Financial Statements for Harvey Norman Australia

Reflective Learning Nursing Personal Statement

Reflective Learning Introduction Theory and practice are two distinct features in nursing where knowledge comes first through learning of theories, and then, theories are implemented once the nurse encounters the patient.... There are notable differences between theory and practice although theory is important for a practicing nurse as many information would now be needed in order to perform properly....
4 Pages (1000 words) Personal Statement

Mental Health Nursing

It is important to have a nurse like you who would take the challenges to work hard for the reforms needed for the mental health care not only for australia but for your own country.... You must understand then that many people in australia especially those with mental disorders and their families, are getting frustrated, however, I am happy to tell you that many are still very willing to support the programs.... I would like to quote the exact words of the Mental Health Care of australia to make my point more vivid: "Their goodwill, patience and support for the protracted nature of genuine health care reform have been dissipated....
4 Pages (1000 words) Personal Statement

Financial and Managerial Accounting

My main concern at this point of time is achieving financial independence at the earliest.... financial security and independence are like a three legged stool resting on savings, insurance and investments.... After going through the facts regarding the salary hike post CMA as well as the versatile curriculum, CMA program seemed like an obvious choice. My main concern at this point of time is achieving financial independence at the earliest....
2 Pages (500 words) Personal Statement

Personal Statement for law admission

Wishing to take advantage of the freedom of expression and action available to me as a legal resident of australia, I decided to dedicate myself to the goal of entering the legal profession.... Excited and committed to my life in australia with my wife, I am still the son of Bal Bahadur and Laxmi Thapa and dedicated to individual justice and making a difference both here and in my homeland.... hellip; Despite continual financial difficulties, my parents agreed and always supported me on my evolving quest....
4 Pages (1000 words) Personal Statement

A Career in Pharmacy

As I grew up, I observed with anguish that my sister was blessed with everything and I lacked many things.... She was like Arnold Schwarzenegger and I was Danny Devito as… I wished to convert that crisis into an opportunity.... Was it not possible for me to outsmart her?... Let the world know that I would!...
3 Pages (750 words) Personal Statement

Writing a Perfect Personal Statement

I had counterchecked the theories, formulas and the financial model before investing and all was promising.... I am in my fifth year in the University of Lowa undertaking three majors in math, computer science, and actuarial science.... I find these courses interesting since they are very similar....
4 Pages (1000 words) Personal Statement

Linking Management with Finance

The rules of business have changed over time and, therefore, entrepreneurs need to adapt to the… For example, a majority of firms operate in one market while at the same time running a financial subsidiary in another.... Resultantly, there is a need to link management tools with financial instruments so as to operate in the diverse and ever-changing Linking Management with Finance Globalisation has changed the nature of the world.... For example, a majority of firms operate in one market while at the same time running a financial subsidiary in another....
2 Pages (500 words) Personal Statement

Being an International Student in Australia - Challenges and Opportunities

… The paper “Being an International Student in australia - Challenges and Opportunities” is an actual variant of a personal statement on education.... The paper “Being an International Student in australia - Challenges and Opportunities” is an actual variant of a personal statement on education.... In 2011, I took a leap of faith and began my academic journey in australia.... I consider the decision to study in australia under scholarship as one of the most difficult decisions that I have ever taken....
6 Pages (1500 words) Personal Statement
sponsored ads
We use cookies to create the best experience for you. Keep on browsing if you are OK with that, or find out how to manage cookies.
Contact Us