StudentShare
Contact Us
Sign In / Sign Up for FREE
Search
Go to advanced search...
Free

Statistical Analysis of the Missing Values - Assignment Example

Cite this document
Summary
This research will begin with the statement that unless one employs a systematic way of managing missing data, the missing values bias statistical analysis because they are treated as zero. Two ways of isolating the missing data items are by visual inspection and employing a series of sorts…
Download full paper File format: .doc, available for editing
GRAB THE BEST PAPER96.6% of users find it useful
Statistical Analysis of the Missing Values
Read Text Preview

Extract of sample "Statistical Analysis of the Missing Values"

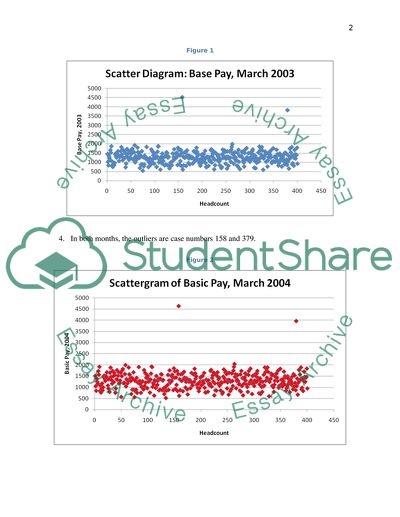
Course Assignment 3 A. Outliers 1. Unless one employs a systematic way of managing missing data, the missing values bias statistical analysis because they are treated as zero. In the most basic example, calculating for the mean without making special provisions for missing values (such as using a spreadsheet function that discounts missing values or sorting the data column and running a calculation only on the non-zero cells) will yield an average that is lower than it should be. A second example that applies is a correlation where the missing values would similarly enter the equation as zeroes and therefore distort the analysis. 2. Two ways of isolating the missing data items is by visual inspection with the help of the End-DOWN navigation key and employing a series of sorts. The resulting lists are as follows: VARIABLES MISSING CASES Yrsserv # 66 Edlevel #s 9, 18, 88, 106, 117, 129, 160, 164, 189, 190, 226, 250, 263, 271, 277, 283, 297, 310, 318, 320, 324, 342, 344, 348, 371, 373, 397, Basic03 14, 26, 28, 35, 50, 80, 84, 120, 130, 134, 139, 175, 229, 231, 257, 280, 281, 296, 315, 336, 352 Bonus03 Exactly the same as for Basic03: 14, 26, 28, 35, 50, 80, 84, 120, 130, 134, 139, 175, 229, 231, 257, 280, 281, 296, 315, 336, 352 Output03 Two more than Basic 03 and Bonus03: 14, 26, 28, 35, 50, 80, 84, 120, 130, 134, 139, 158, 175, 229, 231, 257, 280, 281, 296, 315, 336, 352, 379 Output04 158, 379 3. The scatter diagrams of the pay data, variables Basic03 and Basic04, are shown below. Figure 1 4. In both months, the outliers are case numbers 158 and 379. Figure 2 5. These two cases are defined as outliers because visual inspection reveals that they are several multiples of the standard deviation removed from the base pay range that accounts for 99.5% of all cases. 6. It is highly probable that cases 158 and 379 are managers only because their base pay are more than twice the highest base pay levels of everybody else. Otherwise, there is no telling from their age or educational qualifications. B. Mean Pay for Men and Women 1. The null hypothesis is stated as follows: “There is no difference in mean pay between men and women” Or, in symbolic form: Basic04M = Basic04F. 2. The alternative hypothesis: “Mean pay for men is higher than for women” Or, in symbolic form: Basic04M > Basic04F. 3. Stated this way, it is a two-tailed formulation. 4. Applying the Excel function of an F Test on Two Samples for Variance (after, of course, transforming the gender labels from text to numeric data with an IF function), we obtain the result: Table 1 F-Test Two-Sample for Variances   Gender2 Basic04 Mean 1.38 1289.325 Variance 0.23619 145573.7 Observations 400 400 df 399 399 F 1.62E-06 P(F Read More
Cite this document
  • APA
  • MLA
  • CHICAGO
(“Statistical Analysis of the Missing Values Assignment”, n.d.)
Statistical Analysis of the Missing Values Assignment. Retrieved from https://studentshare.org/statistics/1750094-statistics-assignment
(Statistical Analysis of the Missing Values Assignment)
Statistical Analysis of the Missing Values Assignment. https://studentshare.org/statistics/1750094-statistics-assignment.
“Statistical Analysis of the Missing Values Assignment”, n.d. https://studentshare.org/statistics/1750094-statistics-assignment.
  • Cited: 0 times

CHECK THESE SAMPLES OF Statistical Analysis of the Missing Values

Importance of Statistics in Research Process

The various examples of inferential statistics techniques include t-test, analysis of Variance, Correlation analysis, regression analysis, factor and cluster analysis and discriminant function analysis, etc.... While distribution is an indication of the frequency of specific values of a range of data variables, measures of central tendency such as mean and median are aimed at finding the center of the entire data set (Levin and Rubin, 2007)....
5 Pages (1250 words) Essay

Caregiver stress

Household Income For the household income, the dataset was not complete and data labels were not set for all ordinal values.... Of all the data points, only 170 had disappoints for which the ordinal values were described in the data set.... Sample description The total sample size is 348 (entire data is missing for 1 of the observations).... Out of the sample of 349, 5 cases are excluded in the analysis.... A brief description of the sample is given below in the form of statistical descriptive: Patient Age: The range of patient age is 49 years - from 54 years to 103 years....
8 Pages (2000 words) Research Paper

Statistics on Defensive efficiancy for NBA Basketball

From a physical analysis of the data, it seems to be ideal for further analytical review.... Only after enough evaluation that we can term the data suit for further statistical analysis.... This is an economic data analysis project that has incorporated different items in statistics.... Data confirmatory analysis is another term used to refer to hypothesis testing; this is contrary to data explanatory analysis....
5 Pages (1250 words) Research Paper

Exploring Inferential Statistics and Their Discontents

d) Population standard deviation or sample standard deviation – missing hypothesisized mean = 1.... statistical test: a two-proportion t-interval b.... Exploring Inferential Statistics and Their Discontents Name Institution Part I Question 1 Jackson (2012) Chapter 8, Pgs....
8 Pages (2000 words) Assignment

2010 British Elections Analysis

Kotler-Berkowitz (2001) points out how data from the 1991 and 1992 waves of the British Household Panel Study, when statistically analyzed (using multinomial logistic regression analysis) state that religions influence the voting decisions of sizable number of British citizens.... This relates to the voting behaviour of the people and understanding the political behaviour of the nation in the pre election survey....
9 Pages (2250 words) Essay

Dietary Intake, Gender and Activity Factors Influenced on BMI

This study involves a variety of tests, which is aimed at deciding the outcome of three hypotheses including females have a greater percentage body fat compared with males; energy and fat intake is strongly related to body fat, and sedentary subjects are more likely to be overweight compared with active subjects… The author found enough evidence to prove that  Females have a greater percentage body fat compared with males....
11 Pages (2750 words) Essay

SPSS for analyzing data with one IV and more than one DV & one-way between subjects MANOVA

s the MANOVA an appropriate statistical technique for this research?... You will perform a one-way between subjects MANOVA on the data and report your output.... You will need to complete number 6 and write a Results section for this… 3.... You will also need to submit the SPSS Output files showing the analyses you performed in SPSS to compute the answers for related questions....
1 Pages (250 words) Essay

Homeownership vs Renting Comparisons of Males, Females, Couples, and Singles

dditionally, while there is a large literature on the analysis of housing tenure choices, few studies have incorporated into their empirical analysis, whether the household is headed by a man or a woman.... "Homeownership vs.... Renting Comparisons of Males, Females, Couples and Singles and Other Trends in Real Estate" paper argues that while most single persons rent the places they live, apparently, they seek homeownership and this is evidence by the high percentage of single women and men who own homes… As a matter of fact, much associate homeownership with success....
6 Pages (1500 words) Statistics Project
sponsored ads
We use cookies to create the best experience for you. Keep on browsing if you are OK with that, or find out how to manage cookies.
Contact Us