StudentShare
Contact Us
Sign In / Sign Up for FREE
Search
Go to advanced search...
Free

Importance of Statistics in Research Process - Essay Example

Cite this document
Summary
The paper "Importance of Statistics in Research Process" tells us about the process of systematic collection of information. Data plays an important part in carrying out the research and achieving research objectives. Statistics is a useful tool to manipulate and analyze data…
Download full paper File format: .doc, available for editing
GRAB THE BEST PAPER94.4% of users find it useful
Importance of Statistics in Research Process
Read Text Preview

Extract of sample "Importance of Statistics in Research Process"

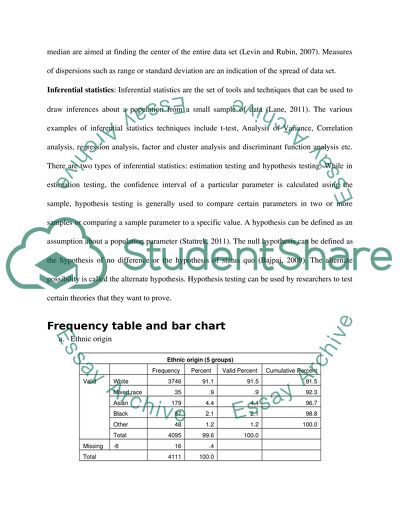
?Importance of statistics in research process In the simplest of terms, research can be defined as the process of systematic collection of information for the purpose of answering questions, examining ideas or testing theories (Healey & Prus, 2009). Data plays an important part in carrying out the research and achieving research objectives. Statistics are a useful tool to manipulate and analyze data. In the simplest of terms, statistics can be defined as the science of collecting, organizing and interpreting data (Dodge, 2003). Statistics play a very important role in research process. It provides the researcher with useful techniques such as the t-tests and AONVA to evaluate their research hypothesis and theories. Different types of statistics can be used to serve different purposes of the research. While descriptive statistics can be used to describe the data, statistical model can be used to forecast data. Researches that are aimed at finding relationship between variables can make use of statistical techniques such as correlation and regression. Difference between Descriptive and Inferential statistics, purpose of each and applications Descriptive statistics: Descriptive statistics can be defined as the set of tools and techniques that can be used to describe the quantitative features of a collection of data (Mann, 1995). The main purpose of using descriptive statistics is to summarize a data set. Statistics such as measures of central tendency, measures of variation, graphs, and bar charts etc are examples of descriptive statistics. The three most important types of descriptive statistics are: measures of central tendency, dispersion and distribution. While distribution is an indication of the frequency of specific values of a range of data variables, measures of central tendency such as mean and median are aimed at finding the center of the entire data set (Levin and Rubin, 2007). Measures of dispersions such as range or standard deviation are an indication of the spread of data set. Inferential statistics: Inferential statistics are the set of tools and techniques that can be used to draw inferences about a population from a small sample of data (Lane, 2011). The various examples of inferential statistics techniques include t-test, Analysis of Variance, Correlation analysis, regression analysis, factor and cluster analysis and discriminant function analysis etc. There are two types of inferential statistics: estimation testing and hypothesis testing. While in estimation testing, the confidence interval of a particular parameter is calculated using the sample, hypothesis testing is generally used to compare certain parameters in two or more samples or comparing a sample parameter to a specific value. A hypothesis can be defined as an assumption about a population parameter (Stattrek, 2011). The null hypothesis can be defined as the hypothesis of no difference or the hypothesis of status quo (Bajpai, 2009). The alternate possibility is called the alternate hypothesis. Hypothesis testing can be used by researchers to test certain theories that they want to prove. Frequency table and bar chart a. Ethnic origin Ethnic origin (5 groups) Frequency Percent Valid Percent Cumulative Percent Valid White 3746 91.1 91.5 91.5 Mixed race 35 .9 .9 92.3 Asian 179 4.4 4.4 96.7 Black 87 2.1 2.1 98.8 Other 48 1.2 1.2 100.0 Total 4095 99.6 100.0 Missing -8 16 .4 Total 4111 100.0 Table 1: Frequency table for ethnic origin As can be seen from the frequency table, the most common ethnic group is White. The next highest frequency of ethnic group is Asian with 4.4% of the data items. Another way of representing the data is using a bar chart. The graph below shows the bar chart for the data set: Figure 1: Bar chart for ethnic origin b. Education level The frequency table for the variable education level is shown below: Education Level - 2000 Frequency Percent Valid Percent Cumulative Percent Valid Higher Degree 147 3.6 4.6 4.6 First Degree 450 10.9 14.0 18.6 Teaching qualification 47 1.1 1.5 20.0 Other higher qualification 327 8.0 10.2 30.2 Nursing qualification 49 1.2 1.5 31.7 GCE A level in two or more subjects 396 9.6 12.3 44.1 GCE A level in one subject 230 5.6 7.2 51.2 GCSE/Olevel, standard grades, 5+ 309 7.5 9.6 60.8 GCSE/Olevel 1-4 233 5.7 7.3 68.1 CSE below grade 1, GCSE below grade C' 105 2.6 3.3 71.4 Apprenticeship 50 1.2 1.6 72.9 Other qualification 161 3.9 5.0 77.9 no qualification 709 17.2 22.1 100.0 Total 3213 78.2 100.0 Missing NEV WENT TO SCH 19 .5 Aged 70+/NO INT 879 21.4 Total 898 21.8 Total 4111 100.0 Table 2: Frequency table for education level Following is the bar chart of the variable: Figure 2: Bar chart for the education level of the respondents As can be seen from the graph and the table, most of the respondents had no qualification. Measures of central tendency a. Age of family unit head: The variable: age of family unit head is a scale variable. Therefore, the appropriate measure to be used is arithmetic mean. The table below shows the measures of central tendency for the variable: Statistics Age of Family Unit head N Valid 4111 Missing 0 Mean 51.0144 Median 50.0000 Mode 52.00 Table 3: Statistics of variable: age of family unit heat The average age of family unit head is 51 years. The graph below shows the box plot for the variable: Figure 3: Box plot for age of family unit head b. Years at this address: Years at this address is a scale variable. The table below shows the measures of central tendency for this variable: Statistics Years at this address N Valid 4108 Missing 3 Mean 13.03 Median 9.00 Mode 0 Table 4: Measures of central tendency for years at this address The appropriate measure to be used is mean. This is because it is an indication of the center of the variable. The diagram below shows the box plot for the same: Figure 4: Box plot for years at this address c. Number of children in family unit: The table below shows the descriptive statistics for number of children in family unit: Descriptive Statistics N Range Minimum Maximum Mean Std. Deviation Variance Statistic Statistic Statistic Statistic Statistic Std. Error Statistic Statistic Number of own dependent children in Family Unit 1488 6.00 .00 6.00 1.4241 .02855 1.10127 1.213 Valid N (listwise) 1488 Table 5: Descriptive statistics for number of children in family unit i. The average age of family head of the data is 51 years. The mean is skewed by extreme values. The average number of years at this address is 13 years. Mode which indicates the most frequent value in the data set is 0 which indicates that most of the respondents have lived for 0 years. ii. The most useful measure of central tendency for number of children in family is the average. This is because the variable is a scale variable with discrete values. Contingency tables a. Crosstabulation of “smoke cigarettes nowadays” and “sex: Smoke cigarettes nowadays * Sex Crosstabulation Sex Total Male Female Smoke cigarettes nowadays Yes Count 445 490 935 Expected Count 478.1 456.9 935.0 % within Sex 35.8% 41.3% 38.5% No Count 797 697 1494 Expected Count 763.9 730.1 1494.0 % within Sex 64.2% 58.7% 61.5% Total Count 1242 1187 2429 Expected Count 1242.0 1187.0 2429.0 % within Sex 100.0% 100.0% 100.0% Table 6: Crosstabulation of smoke cigarettes nowadays with sex b. Cross tabulation of recoded time with sex: The variable work status is recoded into time with 1 representing full time, 2 representing part time and others as system missing. Recoding is done by using the transform function of SPSS. The table below shows the cross tabulation of the recoded variable with the variable sex: Time * Sex Crosstabulation Sex Total Male Female Time 1 Count 1121 622 1743 Expected Count 917.6 825.4 1743.0 % within Sex 90.0% 55.5% 73.7% 2 Count 124 498 622 Expected Count 327.4 294.6 622.0 % within Sex 10.0% 44.5% 26.3% Total Count 1245 1120 2365 Expected Count 1245.0 1120.0 2365.0 % within Sex 100.0% 100.0% 100.0% Table 7: Cross tabulation of ‘time’ with ‘sex’ Analysis of crosstabulation The crosstabulation of whether respondents smoke cigarette viz-a-viz sex indicates that more percentage of women smoke as compared to men. While only 35.8% of the male respondents smoke, as much as 41.3% female respondents smoke. Crosstabulation of time with sex indicates that more percentage of males work full time as compared to part time. The percentage of women who work full time and percentage of women who work part time is almost equal with 55.5% working full time and 45.5% working part time. References Bajpai, N. 2009. Business Statistics. New Delhi: Dorling Kinderseley (India) Pvt. Ltd. Dodge, Y. 2003. The Oxford Dictionary of Statistical Terms, OUP. Healey, J.F., and Prus, S.G. 2009. Statistics: A Tool for Social Research. Canada: Nelson Education Ltd. Lane, D.M. 2011. Hyperstat Online: Inferential Statistics. [online]. Available at: http://davidmlane.com/hyperstat/A29136.html. Last accessed on 9th Apr 2011. Levin, R.I., and Rubin, D.S. 2007. Statistics for Management, 7th ed. India: Pearson Education Inc. Mann, P.S. 1995. Introductory Statistics, 2nd Edition. New York: John Wiley. Stattrek. 2011. Statistics Tutorial: Hypothesis Tests. [online]. Available at: http://stattrek.com/Lesson5/HypothesisTesting.aspx. Last accessed on 09th Apr 2011. Read More
Cite this document
  • APA
  • MLA
  • CHICAGO
(“Social research methods Essay Example | Topics and Well Written Essays - 1500 words - 2”, n.d.)
Retrieved from https://studentshare.org/environmental-studies/1415043-social-research-methods
(Social Research Methods Essay Example | Topics and Well Written Essays - 1500 Words - 2)
https://studentshare.org/environmental-studies/1415043-social-research-methods.
“Social Research Methods Essay Example | Topics and Well Written Essays - 1500 Words - 2”, n.d. https://studentshare.org/environmental-studies/1415043-social-research-methods.
  • Cited: 0 times

CHECK THESE SAMPLES OF Importance of Statistics in Research Process

Wool Trade

Conceptual ParadigmThe conceptual paradigm of this study operates in the illustration below: Research MethodsThe methods to be employed in this research are descriptive-qualitative method, historical analysis, and case studies.... For future researchers, this study can serve as a secondary material in their furtherance of a research on the similar subject.... As a qualitative research, the study is concerned with process rater than outcomes or products....
5 Pages (1250 words) Research Proposal

Changes in Money Management

In “research methods in Politics” it says, “The ability to research, and therefore provide evidence to corroborate a particular view of the world, is clearly vital to the discipline of political science” (Brunham, 2004: 1).... he methodology used for the paper was fairly extensive, citing both the author's research and numerous different studies, interviews, books, and research papers that substantiated the author's premise....
6 Pages (1500 words) Research Proposal

No Interruption Zone on Medication Safety in Intensive Care Units

Handbook of Applied Social research methods.... research methods Qualitative and Quantitative....  No Interruption Zone on Medication Safety in Intensive Care Units According to Biaskman and Rog (2008) literature review entails the systematic identification, location and analysis of books and other documents containing information related to the research problem being studied.... This gives the background of the problem, generating the knowledge gap of the research study....
2 Pages (500 words) Research Paper

Caloric Intake

Social research methods.... research methods and statistics: A critical thinking approach.... Statistical methods for health care research (Vol.... 0 meaning the Nursing research due: Nursing research Part A The dependent variable in this scenario is the caloric intake since it changes depending on whether there is a lifestyle management intervention which is the independent variable.... The correlation does not mean a cause-and-effect link between variables and so cannot be used for certain research questions which seek to determine that kind of relationship (Munro, 2005)....
2 Pages (500 words) Research Paper

Research Methods

The prime intent of composite score scale is to develop ethical approaches for dealing with multiple number of variables found research methods Decision of Using Composite or Summated Scale Score The notion of summated scale score is regarded as a group of collected questionsthat are internally related with each other and focus on measuring the constructs.... om/view/the-sage-dictionary-of-social-research-methods/n203.... The prime intent of composite score scale is to develop ethical approaches for dealing with multiple number of variables found in psychological research (Bland, 2008)....
2 Pages (500 words) Research Proposal

Social Networking and the Self

Social research methods that are qualitative provide the best possible structure through which to begin to understand the experience of participating in Facebook and how it affects the sense of self and the feeling of well-being that comes from successful social interaction.... Through the framework of experience that can be identified with Facebook experience, a discovery of how the self is elevated and satisfaction is attained can be understood through research that is based on qualitative methods....
8 Pages (2000 words) Research Proposal

The Idea of Developing Tourism Through a National Park

This philosophy calls for the use of social and subjective methods of research because the researcher interacts with the environment to obtain the information needed in the research (Lavrakas, 2008).... This research proposal "The Idea of Developing Tourism Through a National Park" is qualitative research in which data about the perceptions of local communities was collected and used to develop a theory or a model.... nbsp;This research was conducted through primary research....
6 Pages (1500 words) Research Proposal

The Impact of the Internet on Political Activism

methods and aims of political activity also changed by virtue of the existence of this medium of spreading information, and from then onwards, it was the avenue for most of the messages whose nature was political activity.... This paper "The Impact of the Internet on Political Activism" is a study of the effects of the internet on political activism....
11 Pages (2750 words) Research Proposal
sponsored ads
We use cookies to create the best experience for you. Keep on browsing if you are OK with that, or find out how to manage cookies.
Contact Us