StudentShare
Contact Us
Sign In / Sign Up for FREE
Search
Go to advanced search...
Free

Introduction to statistics - Essay Example

Cite this document
Summary
The data below shows the percentage of goods moved by Railways and Waterways within a country for the years 2000 and 2009.
No; the data does not…
Download full paper File format: .doc, available for editing
GRAB THE BEST PAPER92.4% of users find it useful
Introduction to statistics
Read Text Preview

Extract of sample "Introduction to statistics"

INTRODUCTION TO STATISTICS By of the of the School Q1: It has been suggested that the use of Railways and Waterways for the internal transportation of goods in Europe is in decline. The data below shows the percentage of goods moved by Railways and Waterways within a country for the years 2000 and 2009.Table 1: DataCountryRail and Waterways20002009Belgium 22.627.1Denmark 7.99.2Germany 34.733.0Ireland 3.80.6Spain 7.23.4France 24.019.0Italy 11.09.0Netherlands36.636.6Portugal 7.55.7United Kingdom1013.3(a) Do the data support the suggestion?

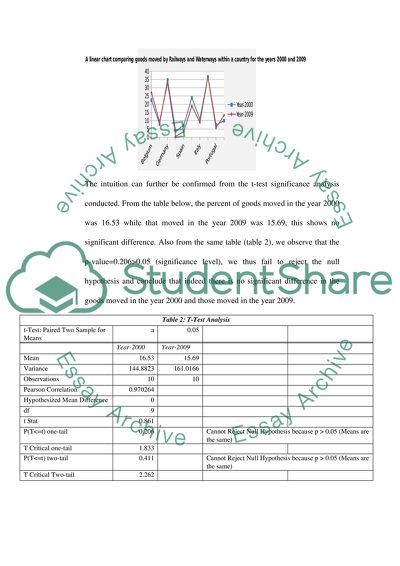
SOLUTIONNo; the data does not provide any evidence of decline in the use of Railways and Waterways for the internal transportation of goods in Europe. The above results can be confirmed from the linear graph shown below. We used a line graph because they are used to display data or information that changes continuously over time. Line graphs also allow us to see overall trends such as an increase or decrease in data over time. Clearly, looking at the graph we don’t observe any disparity in the data givenThe intuition can further be confirmed from the t-test significance analysis conducted.

From the table below, the percent of goods moved in the year 2000 was 16.53 while that moved in the year 2009 was 15.69, this shows no significant difference. Also from the same table (table 2), we observe that the p-value=0.206>0.05 (significance level), we thus fail to reject the null hypothesis and conclude that indeed there is no significant difference in the goods moved in the year 2000 and those moved in the year 2009.Table 2: T-Test Analysist-Test: Paired Two Sample for Meansa0.05 Year-2000Year-2009Mean16.5315.69Variance144.8823161.0166Observations1010Pearson Correlation0.

970264Hypothesized Mean Difference0df9t Stat0.861P(T 0.05 (Means are the same)T Critical one-tail1.833P(T 0.05 (Means are the same)T Critical Two-tail2.262 (b) If the data DOES support the suggestion find the mean difference and its 95% confidence limits.SOLUTION N/A (c) If the data DOES NOT support the suggestion produce a model to show the relationship between the data for 2009 and 2000 with 95% confidence limits and explain BRIEFLY what the model shows.SOLUTION In this part we regressed the 2009 data on the 2000 data since the data was found to follow a normal distribution we opted to use a parametric test (Bivariate regression analysis), we used bivariate because we only had two variables to test (simple linear regression) and the model produced is;Where represents the year 2000From table 3 below, we observe that the R-Squared (R2) is 0.

941 which implies that 94.1% of the variation in 2009 data is affected (or explained) by the 2000 data (explanatory variable)Table 3:Regression StatisticsMultiple R0.970R Square0.941Goodness of Fit >= 0.80Adjusted R Square0.934Standard Error3.258Observations10From table 4 below, we observe that the coefficient for the 2000 data is 1.023 which implies that for a unit change in 2000 data, the 2009 data changes by a factor of 1.023Table 4: ANOVA dfSSMSFP-valueRegression11364.21364.25128.550.000Residual884.90210.6128Total91449.

1  95%  Confidence Level CoefficientsStandard Errort StatP-valueLower 95%Upper 95%Intercept-1.221.8125-0.6720.521-5.39762.9617Year-20001.020.090211.33790.0000.81481.2309(d) Using the model, find the 95% confidence limits for the proportion expected to be moved in 2009 for a country where 20% of goods were moved in this way in 2000.SOLUTIONIf 20% of goods were moved in 2000, using our model we can compute the proportion goods moved in 2009. The model is;Thus in 2009, the proportion of goods moved was 19.242.We now find the 95% confidence limits as follows;However, for our case we use excel to compute this;The confidence as obtained from the excel is 7.460292. hence the corresponding 95% confidence limits are;i.e. the upper limit is while the lower limit is

Read More
Cite this document
  • APA
  • MLA
  • CHICAGO
(“Introduction to statistics Essay Example | Topics and Well Written Essays - 500 words”, n.d.)
Introduction to statistics Essay Example | Topics and Well Written Essays - 500 words. Retrieved from https://studentshare.org/statistics/1639082-introduction-to-statistics
(Introduction to Statistics Essay Example | Topics and Well Written Essays - 500 Words)
Introduction to Statistics Essay Example | Topics and Well Written Essays - 500 Words. https://studentshare.org/statistics/1639082-introduction-to-statistics.
“Introduction to Statistics Essay Example | Topics and Well Written Essays - 500 Words”, n.d. https://studentshare.org/statistics/1639082-introduction-to-statistics.
  • Cited: 0 times

CHECK THESE SAMPLES OF Introduction to statistics

Types of Businesses at Ashford, Bramwell, and Coledene

This study was commissioned by Stapleton Borough council in order to review businesses within the three (3) towns of namely; Ashford, Bramwell and Coledene and a number of smaller villages.... Mainly, the council wanted to know the following; ... ... ata for the study was collected using… Questionnaires are mainly used in data collection due to their ability to capture more information than any other research tool....
6 Pages (1500 words) Essay

Quantitative Methods and Analysis

Introduction to statistics.... In that case, there are usually three results in a correlation survey.... These are positive correlation, negative correlation and no correlation at all.... hellip; Under normal situations correlation research precedes experimentation and can also be conducted in situations where real experiments cannot be conducted due to practical or ethical inserts His/her inserts inserts Grade   Correlation research is the type of social research that seeks to find the relationships that exist between different variables....
1 Pages (250 words) Essay

Research Methods CASE5

Introduction to statistics and research methodology is a mandatory course to all the students in the school.... Introduction to statistics and research methodology is a mandatory course to all the students in the school.... introduction to Descriptive Statistics, Retrieved December 2012 from the University Of Illinois at Urbana-Champaign, Web http://www.... (n= 55) of a two credit graduate statistics class.... (n= 55) of a two credit graduate statistics class....
2 Pages (500 words) Research Paper

Statistics in Business

Introduction to statistics: Concepts and Applications.... statistics as an activity or discipline is concerned with the collection, organization, manipulation, interpretation and presentation of data (Anderson, Sweeney & Williams, 1994).... here are basically two types of statistics; inferential and descriptive (Anderson, Sweeney & Williams, 1994).... While inferential statistics involves the description of the population based on the results drawn statistics in Business Introduction statistics as an activity or discipline is concerned with the collection, organization, manipulation, interpretation and presentation of data (Anderson, Sweeney & Williams, 1994)....
2 Pages (500 words) Essay

Hw

) 
A medical school claims that more than 28% of its students plan to go STAT 200 - Introduction to statistics Quiz 6 Prof.... 1) 
An entomologist writes an article in a scientific journal which claims that fewer than 16 in ten thousand male fireflies are unable to produce light due to a genetic mutation....
1 Pages (250 words) Speech or Presentation

Introduction to Statistics Exam

The assignment "Introduction to statistics Exam" focuses on the analysis of the student's exam paper on the Introduction to statistics.... For 80% confidence with 4 degrees of freedom, the critical value of t is 1.... 33.... An 80% confidence interval for the population mean use (μ) per week is = 19....
6 Pages (1500 words) Assignment

Introduction to Statistics Questions and Calculations

The assignment "Introduction to statistics Questions and Calculations" focuses on the critical analysis of the questions and calculations on the Introduction to statistics.... nbsp;Table showing the distribution of grades for both subjects, the number of hours of study, and the exam results....
6 Pages (1500 words) Assignment

Introduction to Statistics in the United Kingdom

In the paper “Introduction to statistics in the United Kingdom,” the author defines statistics as one of the most fundamental as well as the basic knowledge that students in the higher education have to get well equipped with.... It enlightens its readers through the various concepts such as descriptive statistics, and in this case, it gives the understanding of how different numerical figures get distributed.... It enlightens its readers through the various concepts such as descriptive statistics, and in this case, it gives the understanding of how different numerical figures get distributed....
6 Pages (1500 words) Book Report/Review
sponsored ads
We use cookies to create the best experience for you. Keep on browsing if you are OK with that, or find out how to manage cookies.
Contact Us