StudentShare
Contact Us
Sign In / Sign Up for FREE
Search
Go to advanced search...
Free

Introduction to Statistics Questions and Calculations - Assignment Example

Cite this document
Summary
The assignment "Introduction to Statistics Questions and Calculations" focuses on the critical analysis of the questions and calculations on the introduction to statistics. Table showing the distribution of grades for both subjects, the number of hours of study, and the exam results…
Download full paper File format: .doc, available for editing
GRAB THE BEST PAPER92.5% of users find it useful
Introduction to Statistics Questions and Calculations
Read Text Preview

Extract of sample "Introduction to Statistics Questions and Calculations"

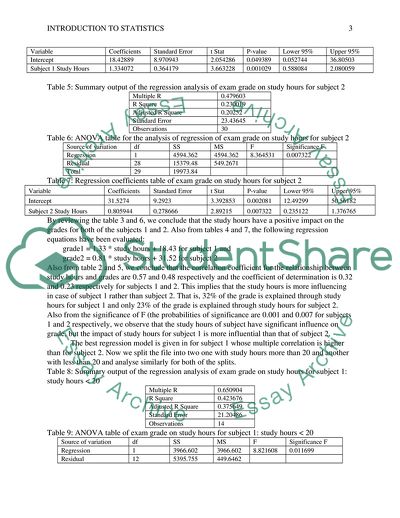
Introduction to Statistics An assignment submitted by Spring Introduction to Statistics Relationship between the Number of Hours of Study and Exam Results Table 1: Table showing the distribution of grades for both subjects  Descriptive Statistics Subject1 Subject2 Mean 46.53 55.38 Standard Deviation 30.43 26.24 Standard Error 5.56 4.79 Median 37.25 57.75 Mode 8 61 Sample Variance 926.26 688.75 Kurtosis -1.61 -0.98 Skewness 0.21 0.10 Range 87 90 Minimum 8 10 Maximum 95 100 Sum 1396 1661.5 Count 30 30 From the above table (Table 1), the mean of marks in subject 1 is 46.53 with SD 30.43 and the mean of marks in subject 2 is 55.38 with SD 26.24. The skewness for both of the marks is close to 0, so they are almost perfectly skewed. The kurtosis for both of them is –ve which shows both of them are platykurtic. Also the kurtosis of -1.61 is much higher than the normal range. So the data is having some deviation from normal distribution. Since both data (subject 1 and subject 2) are having 30 values, the sample is considered to be large and the distribution concerned with this is normal distribution. The 95% confidence interval for exam marks is given by (xbar+1.96 * SE(xbar)) where SE(xbar) is given in the above table with values 5.56 and 4.79 for subject 1 and subject 2 respectively. For subject 1, the 95% confidence interval for mean marks is (46.53 - 1.96 * 5.56, 46.53 + 1.96 * 5.56) that is (46.53 - 10.89, 46.53 + 10.89) that is (36.64, 57.42). Similarly for subject 2, the 95% confidence interval for mean marks is (55.38 - 1.96*4.79, 55.38 + 1.96*4.79) that is (55.38 – 9.39, 55.38 + 9.39) that is (45.99, 64.77) To construct a regression model for each of the subjects and its results, we separately analyse for each subject, treating the study hours as indpendent variable and exam grades as dependent variable (Berk, 2008). The results are given in the following tables: Table 2: Summary output of the regression analysis of exam grade on study hours for subject 1 Multiple R 0.569197 R Square 0.323986 Adjusted R Square 0.299842 Standard Error 25.46618 Observations 30 Table 3: ANOVA table for the analysis of regression of exam grade on study hours for subject 1 Source of variation  Df SS MS F Significance F Regression 1 8702.729 8702.729 13.41924 0.001029 Residual 28 18158.74 648.5264 Total 29 26861.47 Table 4: Regression coefficients table of exam grade on study hours for subject 1 Variable Coefficients Standard Error t Stat P-value Lower 95% Upper 95% Intercept 18.42889 8.970943 2.054286 0.049389 0.052744 36.80503 Subject 1 Study Hours 1.334072 0.364179 3.663228 0.001029 0.588084 2.080059 Table 5: Summary output of the regression analysis of exam grade on study hours for subject 2 Multiple R 0.479603 R Square 0.230019 Adjusted R Square 0.20252 Standard Error 23.43645 Observations 30 Table 6: ANOVA table for the analysis of regression of exam grade on study hours for subject 2 Source of variation df SS MS F Significance F Regression 1 4594.362 4594.362 8.364531 0.007322 Residual 28 15379.48 549.2671 Total 29 19973.84 Table 7: Regression coefficients table of exam grade on study hours for subject 2 Variable Coefficients Standard Error t Stat P-value Lower 95% Upper 95% Intercept 31.5274 9.2923 3.392853 0.002081 12.49299 50.56182 Subject 2 Study Hours 0.805944 0.278666 2.89215 0.007322 0.235122 1.376765 By reviewing the table 3 and 6, we conclude that the study hours have a positive impact on the grades for both of the subjects 1 and 2. Also from tables 4 and 7, the following regression equations have been evaluated: grade1 = 1.33 * study hours + 18.43 for subject 1 and grade2 = 0.81 * study hours + 31.52 for subject 2 Also from table 2 and 5, we conclude that the correlation coefficient for the relationship between study hours and grades are 0.57 and 0.48 respectively and the coefficient of determination is 0.32 and 0.23 respectively for subjects 1 and 2. This implies that the study hours is more influencing in case of subject 1 rather than subject 2. That is, 32% of the grade is explained through study hours for subject 1 and only 23% of the grade is explained through study hours for subject 2. Also from the significance of F (the probabilities of significance are 0.001 and 0.007 for subjects 1 and 2 respectively, we observe that the study hours of subject have significant influence on grade, but the impact of study hours for subject 1 is more influential than that of subject 2. The best regression model is given in for subject 1 whose multiple correlation is higher than for subject 2. Now we split the file into two one with study hours more than 20 and another with less than 20 and analyse similarly for both of the splits. Table 8: Summary output of the regression analysis of exam grade on study hours for subject 1: study hours < 20 Multiple R 0.650904 R Square 0.423676 Adjusted R Square 0.375649 Standard Error 21.20486 Observations 14 Table 9: ANOVA table of exam grade on study hours for subject 1: study hours < 20 Source of variation df SS MS F Significance F Regression 1 3966.602 3966.602 8.821608 0.011699 Residual 12 5395.755 449.6462 Total 13 9362.357 Table 10: Regression coefficients of exam grade on study hours for subject 1: study hours 20 Multiple R 0.179894 R Square 0.032362 Adjusted R Square -0.03676 Standard Error 28.06554 Observations 16 Table 12: ANOVA table for the analysis of regression of exam grade on study hours for subject 1: study hours > 20 Source of variation df SS MS F Significance F Regression 1 368.8027 368.8027 0.468217 0.504979 Residual 14 11027.45 787.6748 Total 15 11396.25 Table 13: Table showing the regression coefficients table for the regression analysis ofexam grade on study hours for subject 1: study hours >20 Variable Coefficients Standard Error t Stat P-value Lower 95% Upper 95% Intercept 41.70286 27.46844 1.51821 0.151217 -17.2111 100.6168 Subject 1 Study Hours 0.587382 0.858415 0.684264 0.504979 -1.25373 2.428499 From table 9 and 12, the probability of significance of the regression for study hours 20 (0.505). The study hours does not influence the grade in case of study hours>20 since the probability of significance being0.505 (>0.05) whereas the study hours has an influence over grade in case of study hours Read More
Cite this document
  • APA
  • MLA
  • CHICAGO
(Introduction to Statistics Questions and Calculations Assignment Example | Topics and Well Written Essays - 1500 words, n.d.)
Introduction to Statistics Questions and Calculations Assignment Example | Topics and Well Written Essays - 1500 words. https://studentshare.org/statistics/1867482-introduction-to-statistics-questions-and-calculations
(Introduction to Statistics Questions and Calculations Assignment Example | Topics and Well Written Essays - 1500 Words)
Introduction to Statistics Questions and Calculations Assignment Example | Topics and Well Written Essays - 1500 Words. https://studentshare.org/statistics/1867482-introduction-to-statistics-questions-and-calculations.
“Introduction to Statistics Questions and Calculations Assignment Example | Topics and Well Written Essays - 1500 Words”. https://studentshare.org/statistics/1867482-introduction-to-statistics-questions-and-calculations.
  • Cited: 0 times

CHECK THESE SAMPLES OF Introduction to Statistics Questions and Calculations

Competence of Paramedic Students in the Calculation of Drug Dosages

According to UKCAT, it is presumed that doctors, who are commonly required to make calculations in their clinical work, are well equipped to do so, based on the fact that they are highly selected, intelligent and have undertaken scientific training.... A comprehensive draft of the questions that will be used for the interviews.... Prior training to the team to carryout interviews, on the way to frame the questions that will be used during the interviewing process and what information to gather....
3 Pages (750 words) Research Paper

Working with Your Tentative Quantitative Research Question

One of the crucials in understanding the internal validity is the ability to recognize that, when it is associating with studies it deals with how perfect the research was conducted The variables determined include the research design, definitions of the operations used, variable measurability, and the confidentiality of the independent and the dependent variables....
9 Pages (2250 words) Assignment

The Impact of Changes on Safety and Cost of SABIC

Here , the questions and the answers are defined by the researcher and the participant just chooses a specific option that suits his opinion .... The quantitative method of data collection seems to follow the positivist paradigm that assumes that the participants are aware of the research concept and thus they intend to answer a defined set of questions in a predetermined scale ....
61 Pages (15250 words) Dissertation

The Emerging Issues about Insurance Law in Europe

Legal bodies argue that insurance companies should not base their calculations in reference to the statistics.... Legal bodies argue that insurance companies should not base their calculations in reference to the statistics.... It is true and evident that the world's statistics show that, male drivers, specifically young drivers experience more accidents per capita than female drivers.... It is true and evident that the world's statistics show that, male drivers, specifically young drivers experience more accidents per capita than female drivers....
9 Pages (2250 words) Essay

The role of research and statistics in the field of psychology

The role of statistics in research:According to Healey (2011: 1) "Statistics are a set of mathematical techniques used by social scientists to organize and manipulate data for the purpose of answering questions and testing theories".... introduction to psychology.... Statistical tests entail calculations which help in estimating the extent of random variability in measuring a given situation.... According to Nicholas (2009: 10) the term scientific method refers to "the principles that guide the researcher from developing research questions to collecting empirical evidence, to answering research questions"....
2 Pages (500 words) Research Paper

Introduction to Statistics Exam

The assignment "introduction to statistics Exam" focuses on the analysis of the student's exam paper on the introduction to statistics.... For 80% confidence with 4 degrees of freedom, the critical value of t is 1.... 33.... An 80% confidence interval for the population mean use (μ) per week is = 19....
6 Pages (1500 words) Assignment

The GroupBased Labeling Scheme

The paper 'The GroupBased Labeling Scheme' presents the results of the experiments which are described and analyzed.... Chapter 6 described the experiments used in evaluating the GroupBased labeling scheme.... Four experiments were designed to evaluate the scheme's functionality.... hellip; The author states that the first experiment evaluated the time needed for the initial labeling process along with the labels' size....
21 Pages (5250 words) Research Paper

Statistical Method of Analysis of the Transport in London

nbsp; … The research questions and the objectives have been put together because the answer to the questions is the objective of the study (Andrew, John, Hal, David, Aki, and Donald, 2013).... This paper "Statistical Method of Analysis of the Transport in London" focuses on the analysis of the data that was collected using questionnaire....
8 Pages (2000 words) Assignment
sponsored ads
We use cookies to create the best experience for you. Keep on browsing if you are OK with that, or find out how to manage cookies.
Contact Us