StudentShare
Contact Us
Sign In / Sign Up for FREE
Search
Go to advanced search...
Free

Statistical Method of Analysis of the Transport in London - Assignment Example

Cite this document
Summary
This paper "Statistical Method of Analysis of the Transport in London" focuses on the analysis of the data that was collected using questionnaire. This paper, therefore, analyses the transport in London. The paper has been divided into various portions so as to enhance the clarity.  …
Download full paper File format: .doc, available for editing
GRAB THE BEST PAPER92.1% of users find it useful
Statistical Method of Analysis of the Transport in London
Read Text Preview

Extract of sample "Statistical Method of Analysis of the Transport in London"

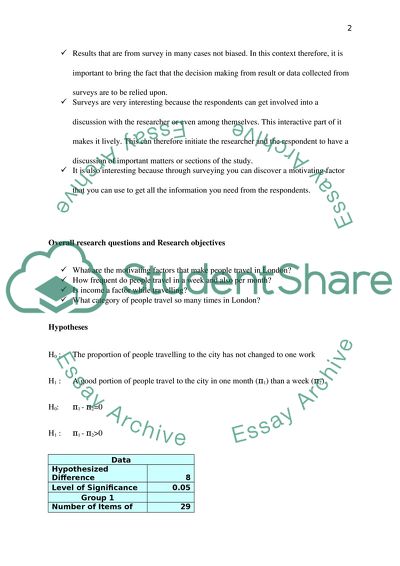
Statistical Method of Analysis of the Transport in London Table of Contents 1. Introduction …………………………………………………………3 2. Data and Research Methods ………………………………………..6 3. Findings ………………………………………………………….…..8 4. Conclusion and Recommendations……………………….…….…..9 5. List of references …………………………………………..…….….10 6. Appendix …………………………………………………………..11-12 1 Introduction It is important to highlight that this report delves on the analysis of the data that was collected using questionnaire. This paper therefore analyses the transport in London. The paper has been divided into various portions so as to enhance the clarity, neatness and also better understanding of the paper. The research questions and the objectives have been put together because the answer to the questions is the objective of the study (Andrew, John, Hal, David, Aki, and Donald, 2013). The use of your survey in data collection Surveying is statistical method that is used in data collection as well as measuring data. It is a primary method of collecting data (Verma, 2012). Justification on why it is interesting to do survey Surveys are very important in the comparison of various results of sets of data. The comparison is generated from the feedback that is gotten from the various respondents in the given study. Results that are from survey in many cases not biased. In this context therefore, it is important to bring the fact that the decision making from result or data collected from surveys are to be relied upon. Surveys are very interesting because the respondents can get involved into a discussion with the researcher or even among themselves. This interactive part of it makes it lively. This can therefore initiate the researcher and the respondent to have a discussion of important matters or sections of the study. It is also interesting because through surveying you can discover a motivating factor that you can use to get all the information you need from the respondents. Overall research questions and Research objectives What are the motivating factors that make people travel in London? How frequent do people travel in a week and also per month? Is income a factor while travelling? What category of people travel so many times in London? Hypotheses H0 : The proportion of people travelling to the city has not changed to one work H1 : A good portion of people travel to the city in one month (π1) than a week (π2). H0: π1 - π2=0 H1 : π1 - π2>0 Data Hypothesized Difference 8 Level of Significance 0.05 Group 1   Number of Items of Interest 29 Sample Size 66 Group 2   Number of Items of Interest 37 Sample Size 66 Intermediate Calculations Group 1 Proportion 0.439393939 Group 2 Proportion 0.560606061 Difference in Two Proportions -0.12121212 Average Proportion 0.5000 Z Test Statistic -93.3056     Two-Tail Test   Lower Critical Value -1.9600 Upper Critical Value 1.9600 p-Value 0.0000 Reject the null hypothesis   The Z- Test value (-93.3056) is lower than the Upper limit value (1.9600) and also the p value (0.0000). This therefore shows that most of the people have not been travelling to the London city. Data Null Hypothesis = 1800 Level of Significance 0.05 Sample Size 65 Sample Mean £ 1,820.62 Sample Standard Deviation 866.1063678 Intermediate Calculations Standard Error of the Mean 107.4273 Degrees of Freedom 64 t Test Statistic 0.1919 Lower-Tail Test   Lower Critical Value -1.6690 p-Value 0.5758 Do not reject the null hypothesis   Hypothesis test on travelling in London Data Null Hypothesis  = 0.36 Level of Significance 0.05 Number of Items of Interest 23 Sample Size 66 Intermediate Calculations Sample Proportion 0.348484848 Standard Error 0.0591 Z Test Statistic -0.1949 Upper-Tail Test   Upper Critical Value 1.6449 p-Value 0.5773 Do not reject the null hypothesis   The Z-test is lower than the Upper limit and also lower than the p-value. 7. Data and Research Methods This study will use different types of methodology to get the results. The following methodology will be used during this study (Chris, 2001). Research approach Deductive Approach This approach enables the researcher to analyse the facts in details and the test hypotheses from the more general level to more the specific level. This approach is known as the top-down approach. It therefore means that the researcher start to think of a topic that the researcher is interested in and then the researcher narrows the topic down into more particular hypotheses that the researcher can test. This research will therefore apply largely the use of deductive approach in carrying out research (David,  Xiaobo, and Zhiyong, 2012). Inductive Approach Inductive approach to reasoning enables is the other side of deductive approach. Here, the researcher analyses from the specific observation to wider perspective and generalizations. This approach is the so called bottom-up approach. This means that inductive approach majorly uses evidences that have arisen during the research to explain the results and the hypotheses (Wes, 2012). The metrics of your survey – sampling method, sample size Survey metrics are the systems of measurement and tests that are executed by various organizations and statisticians in the quality analysis of data to get better result that is as accurate as possible. Surveying is a primary method of data collection and it encompasses sampling, questionnaires and interviews. In this method therefore, there is direct interaction between the respondent and the resource person. In the research therefore, questionnaires was the major method that was applied in the collection of data. Random sampling was done and this was to ensure that each member is given a chance in the participation of the study. However, the random sampling was stratified in the sense that the people who were chosen were of three categories: students, employees and the employers. The sample size was composed of 66 people and in this number. Several factors were considered such as gender balance, age as well as occupation (Michael, 2009). Research instruments This study applied just one major research instrument in the collection of data. It is therefore fundamental to note that the research used questionnaires, as the only method of collecting data. The use of various number of research instruments is always encouraged so as to ensure that the data collected is accurate and holistic but that was never the case for this kind of research study. Expert opinion was also sought from the relevant personnel so as to ascertain the suitability of the of the research instruments. The research instrument is therefore explained as follows (Michael and David, 2003). Questionnaire This study applied the use of questionnaire to collect primary data that met the objectives of the research. The construction of the questionnaire took in to account various factors that were in accordance with the objectives of the study as outlined in section two. It must be noted that any questionnaire that contain questions, which are clearly constructed questions, is always considered a very fundamental research tool. The questionnaire used in this research was properly and carefully constructed. The questions were put in a very direct and coherent manner to ensure that each respondent understands them (Ken and Nicholas, 2014). The research questions were used in the construction of the questionnaire. This allowed the correct data to be collected in as far the objectives of the study were concerned. The questions used in the questionnaire were of two different types. For instance, the questionnaire contained open-ended questions and closed ended questions. The open-ended questions enabled the researcher to collect information pertaining to the opinions of the respondent (Ken and Nicholas, 2010). Limitations During the study there were a lot of challenges that were faced and they have been precisely described as shown below: During the study, some of the participants were not being honest in giving information thereby making the accuracy of the data collected to be in doubt. Some of the people were hostile and were not into the giving of information that concerned their income value for fears of their security. The construction of the questionnaires was quite tedious and expensive as it had to be printed and given to all the members of the sample population. Reaching some areas was quite hectic and so the statistics was not conducted in all the regions. 8. Findings/ results From the study, it was noted that in a week, £10412.70 is spent in travelling by the employers, employees and the students while in a month the amount accumulates to £118340.00. This is as shown in the chart. It can also be noted that highest income from the data is £ 5000 while the lowest income is £ 90. The most ironical part is that the student who earns that lowest amount spends £100 in month for travelling and also spends 15 hours in town. The highest monthly expenditure on transport in London is £1000 and this is from the employer who earns the highest amount and spends 20 hour in town. The income range can also be seen as £ 4910 with the transport expenditure range being £900. It can also be noted from the findings that there is a student not earning because of the age probably which 17 years is while he spends £80 in a week on transport and spends 8 hours in town every week (John, 2010). 9. Conclusion and Recommendations In conclusion, it can be noted that the people who travel a lot in London are employers probably because of the business meetings and then the employees follow because they are obliged to reach their places of work. The students also travel but their travel in a week is limited because they do not earn a lot of money to sustain transport expenses. In gender consideration, it is noted that female students travel a lot. 10. List of references Andrew G., John B., Hal S., David B., and Aki V., Donald B., (2013), Bayesian Data Analysis, Third Edition, London, CRC Press, page 61. Chris V., National Agency for Finite Element Methods & Standards (Great Britain), (2001), Management and the engineering analysis environment, page 118. David, D.,  Xiaobo L., and Zhiyong L., (2012), Data Management and Internet Computing for Image/Pattern Analysis, US, Springer, page 128. John, K., (2010), Doing Bayesian Data Analysis: A Tutorial Introduction with R, Academic Press, page 412. Ken K., and Nicholas J.(2010), Using R for Data Management, Statistical Analysis, and Graphics, London, CRS Press, page 12. Ken K., and Nicholas J.(2014), SAS and R: Data Management, Statistical Analysis, and Graphics, Second Edition, London, CRC Press, page 251. Michael, H., (2009), Head First Data Analysis: A Learner's Guide to Big Numbers, Statistics, and Good Decisions, "O'Reilly Media, Inc.", page 113. Michael, B. and David J., (2003), Intelligent Data Analysis: An Introduction, United States, Springer Science & Business Media, page 172. Verma. P., (2012), Data Analysis in Management with SPSS Software, United States, Springer Science & Business Media, page 324. Wes, M., (2012), Python for Data Analysis, "O'Reilly Media, Inc.", page 382. Appendix The income levels of the sample population The weekly and monthly expenditure on transport The sample size mean values and the sample size for each occupation Read More
Tags
Cite this document
  • APA
  • MLA
  • CHICAGO
(Statistical Method of Analysis of the Transport in London Assignment, n.d.)
Statistical Method of Analysis of the Transport in London Assignment. Retrieved from https://studentshare.org/statistics/1853955-data-management-analysis
(Statistical Method of Analysis of the Transport in London Assignment)
Statistical Method of Analysis of the Transport in London Assignment. https://studentshare.org/statistics/1853955-data-management-analysis.
“Statistical Method of Analysis of the Transport in London Assignment”, n.d. https://studentshare.org/statistics/1853955-data-management-analysis.
  • Cited: 0 times

CHECK THESE SAMPLES OF Statistical Method of Analysis of the Transport in London

Choice of Research Method

Statistics form the basis of analysis where meaning is attached to results that are in form of numbers (Blankie, 1993).... his is a method that offers a chance for statistical analysis as data is provided as measurements or counts.... This method is credited for being quite objective as the research follows laid down procedures as well as analysis.... This paper ''Choice of Research method'' tells us that Before conducting any research, a researcher is supposed to consider several issues that dictate the path to follow....
6 Pages (1500 words) Essay

National Ward Level Classification

The method of gaining the results of the questionnaire was digitalized.... The chosen census variables were selected, the purpose of the multivariate statistical analysis techniques used and how labels (names) were decided for the final set of clusters at the different levels in the hierarchy.... Cluster analysis and details of methodology of classification The segmentation of people on the basis of where they reside etc is making clusters of people into groups whose information is easy to analyze....
7 Pages (1750 words) Essay

The Relevance of Inflation, Unemployment and Interest Rates in Predicting the UK Gross Domestic Product

This paper "The Relevance of Inflation, Unemployment and Interest Rates in Predicting the UK Gross Domestic Product" develops an econometric model predicting the dependent variable the annual real GDP of the UK using the independent variables; the real interest rate and the rate of unemployment.... hellip;  The data used to build and refine the econometric model was extracted from the Economic Trend Annual Supplement (ETAS) presented by the British Office for National Statistics (ONS)....
9 Pages (2250 words) Statistics Project

Advantages and Disadvantages of Quantitative and Qualitative Research Techniques

larger sample is better than a smaller one, but not in direct proportion; for example, for the analysis to be twice as good, a sample needs to be four times as large, and to be three times as good, nine times as large.... Experiment is a typical quantitative research method that aims to provide a better understanding of the relationship between a causal hypothesis and a specific phenomenon which represents either theoretical or practical interest for the researcher....
10 Pages (2500 words) Essay

Inferential Statistics

Moreover, there is a need to systematize these methods according to their predetermined nature, the utilization of open-ended vis-à-vis close-ended questions, and the use of either non-numerical or numerical analysis of data.... here is enough evidence to support the assertion that the average length of the bike hire is consistent with Transport for london expectation that bikes should be hired for no longer than 60 minutes.... A researcher selects a research method according to whether the objective is to identify a certain type of information that is gathered before the onset of the study, or whether participants will be the source of that information....
2 Pages (500 words) Term Paper

BUSINESS ANALYTICS METHOD AND SOFTWARE

This report aims to explore the utility of statistical software such as R and gain insights into the statistical methods such as multivariate analysis of variance (MANOVA) with as well as without regard to each other.... The use of data mining is widespread across several domains such… The statistical tasks related to data mining include cluster analysis, time series analysis, multivariate statistics, spatial data analysis, and machine and statistical learning (Zhao, 2012)....
20 Pages (5000 words) Coursework

Regression Analysis Models for Marketing Decision Making

on-linear regression is a quantitative statistical method of finding a nonlinear model of the relationship between the dependent variable and a set of several independent variables.... analysis of quantitative data which is mainly measurable is done through several statistical models.... "Regression analysis Models for Marketing Decision Making" paper identifies various regression analysis models being applied by businesses in trying to get information from quantitative data and the information is used in making a business decision, especially in the marketing department....
9 Pages (2250 words) Research Paper

Using Statistics and Government Publications in Education

In general, just like any other research paper, the journal article looked interestingly complicated as it called for critical analysis.... The research method used in this study helped me at least understand that there exist structured and none-structured interviews which I never knew before.... The author of the paper "Using Statistics and Government Publications in Education" has come to appreciate that in using statistics one needs to be aware of certain issues when including statistical data in his/her writing as this information is very informative to academic writing....
4 Pages (1000 words) Essay
sponsored ads
We use cookies to create the best experience for you. Keep on browsing if you are OK with that, or find out how to manage cookies.
Contact Us