StudentShare
Contact Us
Sign In / Sign Up for FREE
Search
Go to advanced search...
Free

Introduction to Statistics Exam - Assignment Example

Cite this document
Summary
The assignment "Introduction to Statistics Exam" focuses on the analysis of the student's exam paper on the introduction to statistics. For 80% confidence with 4 degrees of freedom, the critical value of t is 1.533. An 80% confidence interval for the population mean use (μ) per week is = 19.09 to 26.91…
Download full paper File format: .doc, available for editing
GRAB THE BEST PAPER96.2% of users find it useful
Introduction to Statistics Exam
Read Text Preview

Extract of sample "Introduction to Statistics Exam"

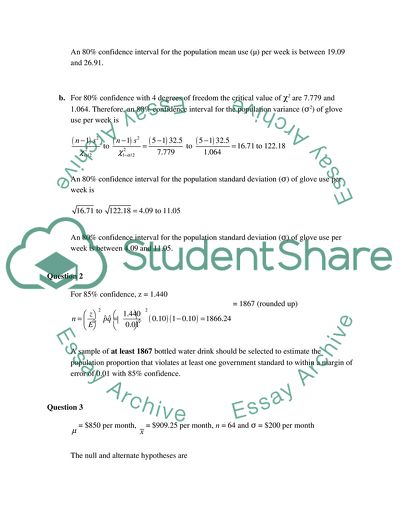
MATH 215 An Introduction to Statistics Final Examination Version B Question a. x x2 20 400 30 900 25 625 15 225 25 625 = 115 = 2775 Sample mean,Sample standard deviation, df = n – 1 = 5 – 1 = 4 For 80% confidence with 4 degrees of freedom the critical value of t is 1.533. Therefore, an 80% confidence interval for the population mean use (μ) per week is = 19.09 to 26.91 An 80% confidence interval for the population mean use (μ) per week is between 19.09 and 26.91. b. For 80% confidence with 4 degrees of freedom the critical value of χ2 are 7.779 and 1.064. Therefore, an 80% confidence interval for the population variance (σ2) of glove use per week is An 80% confidence interval for the population standard deviation (σ) of glove use per week is An 80% confidence interval for the population standard deviation (σ) of glove use per week is between 4.09 and 11.05. Question 2 For 85% confidence, z = 1.440 = 1867 (rounded up) A sample of at least 1867 bottled water drink should be selected to estimate the population proportion that violates at least one government standard to within a margin of error of 0.01 with 85% confidence. Question 3 = $850 per month, = $909.25 per month, n = 64 and σ = $200 per month The null and alternate hypotheses are (The mean apartment rental now does not exceed $850 per month.) (The mean apartment rental now exceeds $850 per month.) The selected level of significance, α is 0.025. The normal distribution will be used for the test, as population standard deviation is known. The test statistic is The p-value is p-value (right-tailed) = 1 – 0.9911 = 0.0089 Decision: Reject the null hypothesis H0, as p-value = 0.0089 < α = 0.025. Conclusion: There is sufficient evidence that the mean apartment rental now exceeds $850 per month. Question 4 Men: n1 = 400 and x1 = 260 Women: n2 = 500 and x2 = 350 The null and alternate hypotheses are (There is no significant difference in the proportions of men and women.) (There is a significant difference in the proportions of men and women.) The selected level of significance, α is 0.01. The two sample proportions are Then, and The value of , , , and are Because each of , , , and values is greater than 5, both sample sizes are large. Consequently, we can use the normal distribution to test the difference between . The equal to (=) sign in the alternative hypothesis indicates that the test is two-tailed test. From the normal distribution table, for a 0.01 significance level, the critical values of z for two-tailed test are -2.576 and 2.576. Therefore, decision rule will be Reject H0 if z > 2.576 or z < -2.576 Otherwise, do not reject H0. The pooled sample proportion is and The estimate of the standard deviation of is The value of the test statistic z for is Decision: Fail to reject the null hypothesis H0, as z = -1.60 falls in-between -2.576 and 2.576 that is in the non-rejection region. Conclusion: There is insufficient evidence that there is a significant difference in the proportions of men and women who rate slot machines as their favourite game. Thus, At the 1% significant level, it cannot be concluded there is a statistically significant difference in the proportions of men and women who rate slot machines as their favourite game. Question 5 Before After d = After - before d2 98 90 -8 64 83 79 -4 16 74 70 -4 16 92 89 -3 9 74 71 -3 9 62 54 -8 64 = -30 = 178 Sample mean for paired differences: Sample standard deviation for paired difference: The null and alternate hypotheses are (The jogging program did not reduce resting pulse rate) (The jogging program reduced resting pulse rate.) The selected level of significance, α is 0.01. The sample size is small (n < 30) and is unknown, therefore, using t distribution for the test. The degrees of freedom are df = n – 1 = 6 – 1 = 5 At level of significance of 1% with 5 degrees of freedom, the critical value of t for a left-tailed test is -3.365. Therefore, decision rule will be Reject H0 if t < -3.365. Otherwise, do not reject H0. The test statistic is Decision: Reject the null hypothesis H0, as t = -5.175 < 1.415. Conclusion: At the 1% significant level, there is sufficient evidence that the two-month jogging program reduced resting pulse rate of women aged 40 to 50. Question 6 The null and alternate hypotheses are The distribution of colours of plain chocolate candies in a box is not the same as hypothesized. The selected level of significance, α is 0.025. There are four categories, therefore using the Chi-square distribution for the test. The degrees of freedom is df = k – 1 = 4 – 1 = 3 At level of significance of 2.5% with 3 degrees of freedom, the critical value of the χ2 is 9.348. Therefore, decision rule will be Reject H0 if χ2 > 9.348. Otherwise, do not reject H0. The test statistic is (See calculation in the table) Colour Observed Frequency O Proportion p Expected Frequency E = np O – E (O – E)2 (O – E)2/E Brown 180 0.40 200 -20 400 2.000 Yellow 170 0.30 150 20 400 2.667 Red 80 0.15 75 5 25 0.333 Blue 70 0.15 75 -5 25 0.333   n = 500 Sum = 5.333 Decision: Fail to reject the null hypothesis H0, as the value of the test statistic χ2 = 5.333 is less than the critical value of χ2 = 9.348. Conclusion: No, the observed data does not contradict the company’s claim. Question 7 The null and alternate hypotheses are (All three population means are equal.) Not all three population means are equal. The selected level of significance, α is 0.05. The selected test is Analysis of Variance (ANOVA). The degrees of freedom are Degrees of freedom for the numerator, df1 = k – 1 = 3 – 1 = 2 Degrees of freedom for the denominator, df2 = n – k = 12 – 3 = 9 At level of significance of 5% with 2 and 9 degrees of freedom, the critical value of the F is 4.26. Therefore, decision rule will be Reject H0 if F > 4.26. Otherwise, do not reject H0. SSB = 20.6667 and SSW = 13 (Given) SST = SSB + SSW = 20.6667 + 13 = 33.6667 The variance between samples (MSB) and the variance within samples (MSW) are MSB = SSB/(k – 1) = 20.6667/2 = 10.3333 MSW = SSW/(n – k) = 13/9 = 1.4444 Below ANOVA table summarizes the above calculations. ANOVA Source of Variation df SS MS F Fcrit Between Groups 2 20.6667 10.3333 7.154 4.26 Within Groups 9 13 1.4444 Total 11 33.6667       The value of the test statistic F is Decision: Reject the null hypothesis H0, as the value of the test statistic F = 7.154 is greater than the critical value of F = 4.26. Conclusion: There is insufficient evidence that there is no difference in the mean weekly hours that executives in the three industries spend at their desktop computers. In other words, there is a difference in the mean weekly hours that executives in the three industries spend at their desktop computers. Question 8 a. The type of relationship that would be expected between temperature and water consumption is positive that is as daily temperature increases in the city, the consumption of water also increases and vice-versa. b. Scatter diagram c. Least squares regression line with water consumption (y) as the dependent variable, and temperature (x) as the independent variable: Thus, least squares regression line is given by: d. Scatter diagram with regression line For x = 10, For x = 30, e. The null and alternate hypotheses are H0: B = 0 (The slope is zero) H1: B > 0 (The slope is positive) The selected level of significance, α is 0.025. Since, n = 7 < 30 and is unknown, therefore, using the t distribution to make the test about B. Area in the right tail = α = 0.025 df = n – 2 = 7 – 2 = 5 At level of significance of 0.025 with 5 degrees of freedom, the right-tail critical value of t is 2.571. Therefore, decision rule will be Reject H0 if t > 2.571. Otherwise, do not reject H0. The test statistic is Decision: Reject the null hypothesis H0, as the value of the test statistic t = 7.2545 is greater than the critical value of t = 2.571. Thus, it can be concluded that the slope of the regression line is positive. f. For x = , Area in each tail = α/2 = 0.5 – (0.90/2) = .05 df = n – 2 = 7 – 2 = 5 t = 2.015 Hence, the 90% prediction interval for for x =is A 90% prediction interval for the water consumption on a particular day when the temperature is is between and . Read More
Cite this document
  • APA
  • MLA
  • CHICAGO
(Introduction to Statistics Exam Assignment Example | Topics and Well Written Essays - 1500 words - 1, n.d.)
Introduction to Statistics Exam Assignment Example | Topics and Well Written Essays - 1500 words - 1. https://studentshare.org/statistics/1785448-exam
(Introduction to Statistics Exam Assignment Example | Topics and Well Written Essays - 1500 Words - 1)
Introduction to Statistics Exam Assignment Example | Topics and Well Written Essays - 1500 Words - 1. https://studentshare.org/statistics/1785448-exam.
“Introduction to Statistics Exam Assignment Example | Topics and Well Written Essays - 1500 Words - 1”. https://studentshare.org/statistics/1785448-exam.
  • Cited: 0 times

CHECK THESE SAMPLES OF Introduction to Statistics Exam

Research methodology

In exams, a score of 95th percentile for Annie would mean that at least 95% of the others who took the exam have scores lower or equal to Annie's.... The relevance of each of the following aspects of quantitative analysis in research Measures of location and dispersion Measures of location provide information on the percentage of observations in the collection whose values are less or equal to it....
4 Pages (1000 words) Essay

Statistical Analysis 10

hellip; It examines the effects of low self-control, rational choice variable, and control measures on intentions to cheat in a college exam.... It examines the effects of low self-control, rational choice variable, and control measures on intentions to cheat in a college exam.... Statistical Analysis Name Institution introduction This paper represents an analysis of the research paper entitled “Low Self-Control, Rational Choice and Student Test Cheating” and written by Stephen G....
2 Pages (500 words) Essay

Authentication of Individuals in E-exams

Arges et al proposed a hybrid approach in which an electronic token or e-card was used along with the fingerprint verification to increase the authentication performance of the e-exam security system [11].... In the paper “Authentication of Individuals in E-exams” the author analyzes a secure environment of E-learning environments to their students and teachers, especially while conducting e-exams, as well as the authentication process of these systems....
4 Pages (1000 words) Essay

Final Exam

?The dataset also includes (1) a measure of participant confidence in knowledge and (2) a certification exam score.... An organization wants to know if participants with varying levels of expertise (professionals, paraprofessionals, and non-professionals) improve their knowledge after completing a training program....
9 Pages (2250 words) Speech or Presentation

Risk Management and Investment

The first section analyses the past performance of the investment fund based on the cut off date.... The second section discusses the risks that face the investment portfolio, which may deter the investor from meeting the aims of investment.... hellip; The critical analysis of the data resides on the precise data to ensure the practicability and reliability of the paper....
15 Pages (3750 words) Essay

Revision Timetables as an Effective Way of Making Learners Calm During Examination Process

One of the weaknesses of exam revision timetables is that parents do not offer words of encouragement.... exam revision timetables have enabled me to pass the exam according to set targets.... exam-busting tips.... The exam skills handbook.... The Examaster exam revision plan.... The student's guide to exam success.... statistics indicates that most parents do not encourage and motivate their children, and it creates the panic among them....
2 Pages (500 words) Essay

The Differences that Exist between Face-to-Face Students and Those of the Open Book Exams System

"The Differences that Exist between Face-to-Face Students and Those of the Open Book Exams System" paper identifies whether there is a difference between students in a face-to-face class taking an open book quiz and a closed book exam with the same time limit and a number of questions.... Many studies try to establish the impact that this type of examination has on the students as compared to those who sit the same exam on a face-to-face or closed book system....
9 Pages (2250 words) Research Paper

Introduction to Statistics Questions and Calculations

The assignment "introduction to statistics Questions and Calculations" focuses on the critical analysis of the questions and calculations on the introduction to statistics.... nbsp;Table showing the distribution of grades for both subjects, the number of hours of study, and the exam results.... he 95% confidence interval for exam marks is given by (xbar+1.... o construct a regression model for each of the subjects and its results, we separately analyze for each subject, treating the study hours as independent variable and exam grades as a dependent variable (Berk, 2008)....
6 Pages (1500 words) Assignment
sponsored ads
We use cookies to create the best experience for you. Keep on browsing if you are OK with that, or find out how to manage cookies.
Contact Us