StudentShare
Contact Us
Sign In / Sign Up for FREE
Search
Go to advanced search...
Free

SPSS - Statistics Project Example

Cite this document
Summary
In addition, this study investigates whether sex of student "moderates" the effect of study environment on academic performance (that is, do males and females differ in how much benefit they get from…
Download full paper File format: .doc, available for editing
GRAB THE BEST PAPER98.5% of users find it useful
SPSS
Read Text Preview

Extract of sample "SPSS"

PSY 870: Module 4 Problem Set 2 × 3 Between s Factorial ANOVA: Study Environments by Gender This study investigates whether study environment affects academic performance. In addition, this study investigates whether sex of student "moderates" the effect of study environment on academic performance (that is, do males and females differ in how much benefit they get from studying in certain environments). During the first half of the spring semester, 120 male students and 120 female students in grade 10 at a public high school in a large metropolitan area in the southwestern region of the United States were randomly assigned to one of three study environment: study in front of the TV, at the library, or in the food court.

The students could ONLY study in the environment to which they were assigned during the research period. At the end of the 7-week research period, mid-term GPA was computed for each student. A change score was computed for each student: each students spring midterm GPA was subtracted from his or her GPA for the preceding fall semester. The difference was each students GPA Improvement score. The GPA improvement score was used to measure academic performance.Directions:Using the SPSS 2 × 3 ANOVA data file for Module 4 (located in Topic Materials), answer the following questions.

NOTE: Helpful hints are provided here for you to use while answering these questions. There is no separate answer sheet/guide to use while doing this assignment.1. What are the two independent variables in this study? What is the dependent variable? Independent variable:Study environment Sex Dependent variable: Academic performance2. Why is a two-way between-subjects factorial ANOVA the correct statistic to use for this research design?Then two‐way between subjects ANOVA is used to analyze the results of a between subjects factorial design with two independent variables (factors).

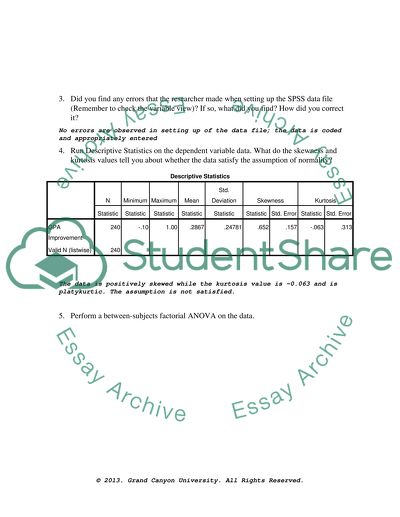
The two‐way ANOVA tests three hypotheses: the main effects for each of the two factors and the interaction effect3. Did you find any errors that the researcher made when setting up the SPSS data file (Remember to check the variable view)? If so, what did you find? How did you correct it?No errors are observed in setting up of the data file; the data is coded and appropriately entered4. Run Descriptive Statistics on the dependent variable data. What do the skewness and kurtosis values tell you about whether the data satisfy the assumption of normality?

Descriptive StatisticsNMinimumMaximumMeanStd. DeviationSkewnessKurtosisStatisticStatisticStatisticStatisticStatisticStatisticStd. ErrorStatisticStd. ErrorGPA Improvement240-.101.00.2867.24781.652.157-.063.313Valid N (listwise)240The data is positively skewed while the kurtosis value is -0.063 and is platykurtic. The assumption is not satisfied.5. Perform a between-subjects factorial ANOVA on the data. Multivariate TestsbEffectValueFHypothesis dfError dfSig.EnvironmentPillais Trace.785867.008a1.000238.000.

000Wilks Lambda.215867.008a1.000238.000.000Hotellings Trace3.643867.008a1.000238.000.000Roys Largest Root3.643867.008a1.000238.000.000Environment * sexPillais Trace.000.099a1.000238.000.753Wilks Lambda1.000.099a1.000238.000.753Hotellings Trace.000.099a1.000238.000.753Roys Largest Root.000.099a1.000238.000.753a. Exact statisticb. Design: Intercept + sex Within Subjects Design: Environment6. a. What do the results of the Levenes Test tell you about your data? What does this mean in terms of interpreting the outcomes of the ANOVA?

Multiple ComparisonsGPA ImprovementLSD(I) Environment(J) EnvironmentMean Difference (I-J)Std. ErrorSig.95% Confidence IntervalLower BoundUpper BoundFront of TVLibrary-.2200*.02758.000-.2743-.1657Food Court.1175*.02758.000.0632.1718LibraryFront of TV.2200*.02758.000.1657.2743Food Court.3375*.02758.000.2832.3918Food CourtFront of TV-.1175*.02758.000-.1718-.0632Library-.3375*.02758.000-.3918-.2832Based on observed means. The error term is Mean Square (Error) = .030.*. The mean difference is significant at the 0.05 level.The results are statistically significantb.

What do the results of the Tests of Between-Subjects Effects tell you? Was there a significant main effect of Environment on GPA improvement? Was there a significant main effect of Sex on GPA improvement? Was there a significant interaction effect of Environment X Sex on GPA improvement? Report the results for each of these questions providing the actual F-value and p value using the following format: F(df1, df2) = 0.785____, p = .__000_ or if the p is shown as .000, write it as p < .001; an example of this formatting is F(1, 400) = 15.4, p = .02).

Tests of Between-Subjects EffectsDependent Variable:GPA ImprovementSourceType III Sum of SquaresdfMean SquareFSig.Corrected Model7.557a51.51149.675.000Intercept19.723119.723648.189.000envir4.69622.34877.173.000sex.0811.0812.651.105envir * sex2.78021.39045.688.000Error7.120234.030Total34.400240Corrected Total14.677239a. R Squared = .515 (Adjusted R Squared = .505)For environment, F (2, 239) = 77.173, p < 0.05), significantly related to academic performance For sex (2, 239) = 2.651, p = 0.105, not significant related to academic performancec.

Use eta squared to provide effect size/proportion of variance accounted associated with each F-value. If the F-value for a main effect and/or for an interaction effect is statistically significant, what is the eta squared (2) value associated with that outcome? HINT: Report eta squared, 2; ignore partial eta squared that SPSS can provide. You have to calculate eta squared yourself. It is not given to you by SPSS, but you can use what SPSS provides to calculate it. Eta squared is calculated by using the values in the column headed "Type III Sum of Squares" from the table with the results for Tests of Between-Subjects Effects.

" To compute eta squared, which would be notated as 2, take that sources Type III Sum of Squares and divide it by the value for Corrected Total in the same column. For example, if the Type III Sum of Squares for Environment had been 4.5 rather than 4.696, you would divide 4.5 by 14.677 to get the effect size for Environment. If the Type III Sum of Squares for Sex had been 2.0, you also would divide that by 14.677, etc. Interpret these eta squared results for effect size using the following guidelines from Cohen (1988):.

01 ~ small.06 ~ medium.14 ~ largeFor environment, 4.696/14.677 which gives 0.319956394 and hence considered largeFor sex, its 0.081/14.677 = 0.005518839 and hence considered smalld. If the result for the main effect of Environment was statistically significant, what did you find out when you performed post hoc tests (Tukey HSD) to look at possible statistically significant differences in the pairs of means for Environment groups? GPA ImprovementEnvironmentNSubset123Tukey Ba,,bFood Court80.1350Front of TV80.

2525Library80.4725Means for groups in homogeneous subsets are displayed. Based on observed means. The error term is Mean Square(Error) = .030.a. Uses Harmonic Mean Sample Size = 80.000.b. Alpha = 0.05.The results are confirmed as being statistically significant. It is more better to study in the library than in front of TV or food court.e. When you have a factorial ANOVA and the interaction effect is significant, does the researcher give much attention to any significant main effects when interpreting the results of the study?

Yes, these are important in further explaining the findings of the research.7. Citing the results of your statistical analyses, what is the conclusion you can draw (and support) regarding research question that was posed in this research (see problem statement)? Write a results section for this study that expresses and supports this conclusion.HINT: Use the sample write-up of the results for the Two-Way Between-Subjects ANOVA example that is in the textbook to see what you should report and how to say it.

Just substitute the correct language and values for the analyses you have done for this problem.There is a relationship between academic environment and academic performance but not sex

Read More
Cite this document
  • APA
  • MLA
  • CHICAGO
(“SPSS Statistics Project Example | Topics and Well Written Essays - 250 words”, n.d.)
SPSS Statistics Project Example | Topics and Well Written Essays - 250 words. Retrieved from https://studentshare.org/statistics/1635955-spss
(SPSS Statistics Project Example | Topics and Well Written Essays - 250 Words)
SPSS Statistics Project Example | Topics and Well Written Essays - 250 Words. https://studentshare.org/statistics/1635955-spss.
“SPSS Statistics Project Example | Topics and Well Written Essays - 250 Words”, n.d. https://studentshare.org/statistics/1635955-spss.
  • Cited: 0 times

CHECK THESE SAMPLES OF SPSS

What Is the Statistical Package for the Social Sciences

The use of this software has helped the discipline of research and development to undertake effective studies using SPSS statistical analysis.... In particular, the software is used within the field of… There are various functions of SPSS statistics software.... These include creation of data derived from research tools, categorization of data into different segments etc. SPSS was produced by SPSS Inc.... which was later subjected to IBM Understanding Statistical Package for the Social Sciences (SPSS) of Understanding Statistical Package for the Social Sciences (SPSS)SPSS statistics is the most widely operated data analysis software in the world....
1 Pages (250 words) Essay

Explanation of SPSS tables

Table 12 discusses the awareness of the residents about Essay, Tourism Explanation of SPSS Tables Statistics Charles Bridge N Valid 69 Missing 0 Charles Bridge Frequency Valid Percent ValidYes4971.... The tables below best suit the objective.... The information identifies 5 centers in the Dark Tourism Site as: The second objective of the research was to identify the historical… Table 10 reveals that the Dark Tourism Centre has been used for various historical events such as The third objective was to identify the distribution of these centers in the town....
1 Pages (250 words) Essay

Relationship between Marital Status and Hyatt

The ratio of male to female respondents was thus 7:3.... The figure below shows the representation of study participants by gender. In terms of age distribution, the… rity of the respondents interviewed (41.... %) were aged between 35-55 years old, while 29.... % of those interviewed were aged above 55 years old while 28....
12 Pages (3000 words) Assignment

SPSS Assignment only

(2 points) There is no strong relationship either between math achievement in 12th grade or reading achievement in 12th grade the coefficient SPSS #4 Assignment- STA-250.... The positive relationship is depicted by the coefficient value of 0.... 36 between the two variables. Does the average daily attendance rate have stronger… Are either of these two relationships significant?...
2 Pages (500 words) Lab Report

Statistical analysis - use SPSS

Discovering statistics using SPSS (4th ed.... For our case, 0.... 87 is seen to be not less or equal to 0.... 5.... herefore, we are forced to reject the null hypothesis.... We can conclude that there is no statistically significant difference in fruit available and fruit… If p ≤ α, then the null hypothesis should be rejected (Field, 2013)....
2 Pages (500 words) Essay

SPSS Output Summary

The data was subjected for analysis on SPSS statistical package. A survey was conducted on a tech company and a… A judgment method was to collect the data. Team type variable has a normal distribution as indicated in Table 1, Skewness = 000 Effectiveness in project completion Introduction A Tech company conducted a study to evaluate effectiveness in the company.... The data was subjected for analysis on SPSS statistical package.... IBM SPSS Advanced Statistics 20....
2 Pages (500 words) Essay

SPSS Software

This paper concerns the description of the peculiar features of SPSS Software.... As it is stated in the text, the SPSS software will be used to calculate Cronbach alphas to test the internal consistency of the data collected.... … According to the author of the text, the SPSS software will also be used to perform the correlation analysis (both Pearson's r statistics and Spearman's rho statistics) so as to establish the relationship between the variables in the study....
1 Pages (250 words) Research Proposal

SPSS assignment:

19 (a value close to zero), this shows that the data is likely SPSS Assignment In the table below we present the descriptive (summary) statistics for the variable weight collected from 7th grade boys in 2014 at "A" Junior High in Some Town USA.... In the table below we present the descriptive (summary) statistics for the variable weight collected from 7th grade boys in 2014 at "A" Junior High in Some Town USA....
2 Pages (500 words) Essay
sponsored ads
We use cookies to create the best experience for you. Keep on browsing if you are OK with that, or find out how to manage cookies.
Contact Us