StudentShare
Contact Us
Sign In / Sign Up for FREE
Search
Go to advanced search...
Free

Statistics - Research Paper Example

Cite this document
Summary
The study here is conducted to see whether the time a child spends in watching TV back home has any visible relationship with the time the child has spent napping at his preschool. A total of 14 children were observed and a correlation was run to see whether or not they…
Download full paper File format: .doc, available for editing
GRAB THE BEST PAPER97.4% of users find it useful
Statistics
Read Text Preview

Extract of sample "Statistics"

Statistical Report The study here is conducted to see whether the time a child spends in watching TV back home has any visible relationship with the time the child has spent napping at his preschool. A total of 14 children were observed and a correlation was run to see whether or not they possessed any relation.Hypothesis Testing:Ho = Time spent in watching TV is correlated with Nap Time.Ha (unidirectional) = Time spent in watching TV is positively correlated with Nap Time.Ha (non - directional) = There is no correlation between TV viewing and Nap Time.

Variables:TV viewing after preschool= Y = is the dependent variableNap Time at preschool = X = is the independent variableDifference between correlation study and experimental studyIn correlation studies a researcher looks for associations among naturally occurring variables, whereas in experimental studies the researcher introduces a change and then monitors its effects. Here under this correlation study has been done to verify if there is any possible relationship of a child spending time to watch TV back home with the time the child has spent napping at his preschool.

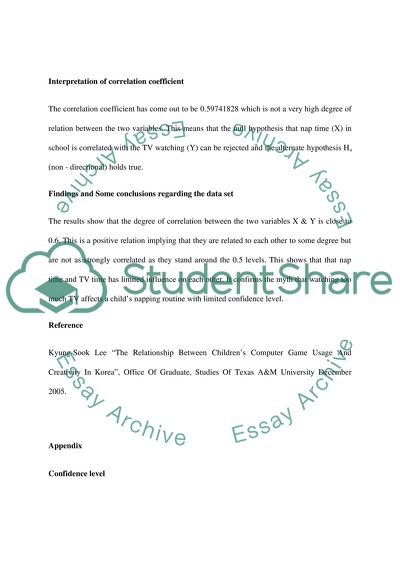
Pearson’s rThe Pearson coefficient of correlation value was calculated to be 0.59741828.Interpretation of correlation coefficientThe correlation coefficient has come out to be 0.59741828 which is not a very high degree of relation between the two variables. This means that the null hypothesis that nap time (X) in school is correlated with the TV watching (Y) can be rejected and the alternate hypothesis Ha (non - directional) holds true. Findings and Some conclusions regarding the data setThe results show that the degree of correlation between the two variables X & Y is close to 0.6. This is a positive relation implying that they are related to each other to some degree but are not as strongly correlated as they stand around the 0.5 levels. This shows that that nap time and TV time has limited influence on each other.

It confirms the myth that watching too much TV affects a child’s napping routine with limited confidence level.ReferenceKyung-Sook Lee “The Relationship Between Children’s Computer Game Usage And Creativity In Korea”, Office Of Graduate, Studies Of Texas A&M University December 2005.AppendixConfidence level0.95 and 0.99 Confidence Intervals of rhoQ Lower LimitUpper Limit0.950.0980.8560.99-0.0870.898Scatter PlotScater plot of Nap Time Vs TV Time. The range of nap time does not changes with increase in TV timeDATAChildTV time(Hrs)Nap Time(Hrs)1037206031284133513762427251826093421034811452124781356114563

Read More
Cite this document
  • APA
  • MLA
  • CHICAGO
(“Statistics Research Paper Example | Topics and Well Written Essays - 500 words - 2”, n.d.)
Statistics Research Paper Example | Topics and Well Written Essays - 500 words - 2. Retrieved from https://studentshare.org/psychology/1577517-statistics
(Statistics Research Paper Example | Topics and Well Written Essays - 500 Words - 2)
Statistics Research Paper Example | Topics and Well Written Essays - 500 Words - 2. https://studentshare.org/psychology/1577517-statistics.
“Statistics Research Paper Example | Topics and Well Written Essays - 500 Words - 2”, n.d. https://studentshare.org/psychology/1577517-statistics.
  • Cited: 0 times

CHECK THESE SAMPLES OF Statistics

Voluntary Statistics: Jigsaw Puzzles

Two age groups of children 6-year-olds and 8-year-olds took part (independent variable) and their solution time for jigsaw puzzles was measured (dependent 2008/09 Voluntary statistics Assignment The aim of the study is to find out whether solution time (for jigsaw puzzles) would vary with age....
1 Pages (250 words) Essay

Business Statistics

This report studies the state by state average fuel prices of unleaded regular, premium gasoline and diesel in the United States using statistical… More focus has been given to the Colorado state. ... ... he histogram (Fig.... 1) of the state by state average fuel prices for regular unleaded gasoline1 shows that among the 51 states, a large number of states had the average fuel price around $1....
2 Pages (500 words) Essay

Basic Statistics

The assignment "Basic statistics" states that based upon the data we calculate the percent of relative frequency and prepare a chart.... Basic statistics Product B-17 Data & Statistical Calculations Prepare a Frequency Distribution Chart.... Does it approximate the normal curve, well it is negatively skewed than a normal curve, hence the frequency occurs towards the right of the graph?...
1 Pages (250 words) Assignment

Business Statistics

The author of this paper entitled "Business statistics" touches upon the issue of business statistics.... Business statistics – Correlation and Regression I.... According to the text, correlation and regression have applications in various fields and business management is no exception....
2 Pages (500 words) Term Paper

Descriptive Statistics

Statistical analysis of data provides objective and comparable means of understanding the trends seen in the sample and consequently in the population (Frankfort-Nachmias & Nachmias, 2008)....
1 Pages (250 words) Assignment

Descriptive statistics

ccording to Clark and Creswell (2010) one cannot analyze their data with statistics unless the data have been recorded in a numeric form.... he research will examine both the single item scores and the summed scores (Clark & Creswell, 2010) as part of its detailed analysis to address the research question, the descriptive statistics obtained will be summarized in tables.... As per Clark and Creswell (2010) the models will be accompanied by the ANOVA and T-test tables in order to provide detailed statistics relevant in testing the differences between the observed grouped in regards to the academic performance....
3 Pages (750 words) Assignment

Inferential Statistics

he independent variable was Inferential statistics In this essay, Hammet et al.... article entitled “Physician Review of Workers Compensation Case Files: Can It Affect Decision Outcomes?... ?? will be the main article for analysis.... The authors aimed at establishing whether worker's compensation can in any way affect decision… The hypothesis of the study was that the review of workers file and compensation had a significant impact on the decision outcomes of their cases....
2 Pages (500 words) Essay

Business statistics

First Lecturer: Business statistics “Numbers and measurements are the language of business.... Descriptive statistics method of calculating data is for instance, function of Excel Analysis ToolPak function which produce salary data that is descriptive in statistics.... The example of calculations in statistics is the Employee Salary Data set.... statistics methods and analysis....
1 Pages (250 words) Essay
sponsored ads
We use cookies to create the best experience for you. Keep on browsing if you are OK with that, or find out how to manage cookies.
Contact Us