StudentShare
Contact Us
Sign In / Sign Up for FREE
Search
Go to advanced search...
Free

Cynon River Hydrograph Potential - Case Study Example

Cite this document
Summary
The study "Cynon River Hydrograph Potential" analyzes the environmental potential of a Cynon River in Wales for building pumping constructions. One of the best and oldest descriptions of the Cynon River seen in the printed matter during the background research for this project was given by Lewis (1855)…
Download full paper File format: .doc, available for editing
GRAB THE BEST PAPER94.7% of users find it useful
Cynon River Hydrograph Potential
Read Text Preview

Extract of sample "Cynon River Hydrograph Potential"

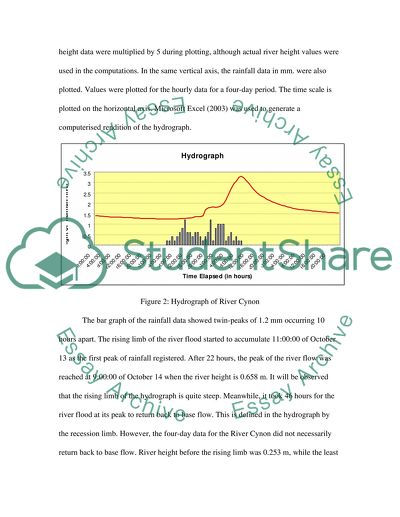
1.0 The River Cynon Figure One of the many bridges that cross the river Cynon (Sewell, 2007) The River Cynon is one of the main tributaries of River Taf in South Wales. One of the best and oldest descriptions of the river seen in printed matter during the background research performed for this project was given by Lewis (1855). In his account, Lewis (1855) narrated that the river may be found in the north eastern part of Glamorganshire in South Wales. River Cynon originates from the parish of Penderin. The website GeoHack (not dated) pinpointed the coordinates of River Cynon in decimal format at 51.6333333, -3.483333. 2.0 Hydrograph Analysis The first requirement in the project is a plot of the hydrograph of the River Cynon. The hydrograph is shown next page as Figure 2. To facilitate plotting, instead of using the river discharge figures in the vertical axis, the height of the river in meters from the given data was used. For a well-defined hydrograph of the river discharge, river height data were multiplied by 5 during plotting, although actual river height values were used in the computations. In the same vertical axis, the rainfall data in mm. were also plotted. Values were plotted for the hourly data for a four-day period. The time scale is plotted on the horizontal axis. Microsoft Excel (2003) was used to generate a computerised rendition of the hydrograph. Figure 2: Hydrograph of River Cynon The bar graph of the rainfall data showed twin-peaks of 1.2 mm occurring 10 hours apart. The rising limb of the river flood started to accumulate 11:00:00 of October 13 as the first peak of rainfall registered. After 22 hours, the peak of the river flow was reached at 9:00:00 of October 14 when the river height is 0.658 m. It will be observed that the rising limb of the hydrograph is quite steep. Meanwhile, it took 46 hours for the river flood at its peak to return back to base flow. This is defined in the hydrograph by the recession limb. However, the four-day data for the River Cynon did not necessarily return back to base flow. River height before the rising limb was 0.253 m, while the least reading given during the recession limb was 0.306 m. Figure 3 shows the rising limb, peak flow, recession limb and other elements of a typical hydrograph. Figure 3: The hydrograph and its typical elements A significant portion of the Cynon River catchment area is of moderate permeability (65%), which indicates slow infiltration rate and the steep rising limb (British Geological Society, 2005; Gordon, Finlayson, McMahon and Gippel, 2004). The average discharge for the rising limb (Qa) of the river flood is computed as the product of the given river velocity (v), the average river height from the first rainfall peak at 1.2 mm to the peak flow of the river flood at 0.658 m (ha = 0.392) and the given width of the river (Ba = 15 m). Qa= v*ha* Ba = 4 m/s (0.392 m) (15 m) Qa= 23.52 m3/s At peak flow of the river flood, the discharge Qp is equal to the product of v, 0.658 m and Ba, and Qp = 39.48 m3/s. The average discharge for the recession limb (Qb) of the river flood is equal to the product of v, the average river height during the recession limb (0.401 m) and Ba. Qb = 24.06 m3/s. With such substantial discharge patterns, it is possible to store flood waters for future use. An estimate of the volume of water which may be derived during river floods such as the one documented in the river data given is carried out in the succeeding calculation. First, the coefficient of run-off is determined. Actual River Cynon characteristics from authoritative sources indicate that its 160 km2 or 160 x 106 m2 catchment area may be classified into various uses and therefore, various ground characteristics. Table 1 shows of a summary of the land use classification of the River Cynon catchment area. Table 1: Land use characteristics and corresponding run-off coefficients (Environment Agency Wales, 2005; Lee & Lin, 2007). Category of land use % of catchment area Run-off coefficientsa Arable & horticulture 2.80% 0.55b Built-up areas 12.50% 0.65c Grassland 48.00% 0.30d Mountain, heath, bog 14.40% 0.65e Woodland 22.10% 0.15 Average run-off coefficient 0.37 a coefficients used were taken on rolling slope from 2 – 10% in the run-off coefficients table in Lee & Lin (2007), since the slope of the catchment area was given as 1:20 or 0.05 (CEH, 2005); b basis is cultivated land for clay; c assumed to be dense residential areas. dtaken from meadows and pasture lands or grassed areas; e taken from earth areas. The amount of run-off which may be expected from the River Cynon rainfall data for the four-day period was computed as the product of the total height of rainfall (15.8 mm or 0.0158 m), the catchment area (160 km2 or 160 x 106 m2) and the average run-off coefficient from Table 1 (0.37). Theoretically, the run-off volume is 935,360 m3. The substantial volume of run-off may be attributed to a considerably big catchment area which receives larger run-off. The rate of accumulation of the flood waters is the quotient of the run-off volume (935,360 m3) and the basin lag time (22 hours) and is equal to 42,516.36 m3/hour. Meanwhile, the rate of recovery or return to base flow is the quotient of the run-off volume (935,360 m3) and the duration of the receding limb (46 hours), which is equal to 20,333.91 m3/hour. The big difference between the rate of accumulation of flood water and the rate of recovery back to baseflow may be explained by the fact that 65% of the catchment area is of moderate permeability and does not lend itself to significant amount of infiltration. 3.0 Design of required pump power and open channel 3.1 Design consideration, assumptions and limitations: 3.1.1. Among the given values in the project assignment brief are: river width of 15 m; river cross section is rectangular; and river flow velocity of 4 m/s. 3.1.2. River water is assumed to be conveyed from the river to the pump by a 200 mm diameter pipe and from the pump to the open channel by 170 mm pipe. 3.1.3. River stage (or height) design shall be limited to given highest observation during the four-day period of 0.658 m. The elevation of the river will be based on the elevation of an actual gauging station at Abercynon, which is at elevation 81.2 m (Centre for Ecology and Hydrology, 2005). 3.1.4. The open channel will be located at elevation 350 m, based on the upper limit of the elevation range (250 – 350 m) which registered the highest percentage of the catchment area of 31.2% or about 50 km2. 3.1.5. Head loss from the river to point A in Figure 4 is assumed as four times the velocity head of the pipe conveying water from the river to the pump. 3.1.6. Head loss from point B in Figure 4 to the proposed open channel is assumed as 15 times that of the velocity head of the pipe conveying water from the pump to the open channel. 3.1.7. A centrifugal pump, being the most frequently used among the pump types because of its “design simplicity, high efficiency, wide range of capacity, head, smooth flow rate and ease of operation and maintenance”, is being proposed for use (Girdhar & Moniz, 2004, p. 10; Daugherty, 2007). 3.1.8. It was assumed that the open channel will be of unpolished concrete surface for which the approximated roughness coefficient, n = 0. 014 (Liu, 2003, p. 40). 3.1.9. The velocity of the pipe carrying water from the river to the pump was assumed to be equal to that of the given velocity of the flood water from River Cynon, which is 4 m/s. Figure 4 next page shows a diagram of the river source, the pump and the open channel which will feed water to the storage reservoir. Figure 4: Schematic diagram showing the river source, pump and open channel 3.2 Computations and discussions 3.2.1. Water velocity in the pipes Head losses are to be computed based on the pipe velocity heads, hence, it is important to establish water velocity in the two pipes. The pipe from the river to the pump is assumed to have a velocity of Vr = 4 m/s. From the discharge formula that Q is equal to the product of the cross sectional area of the pipe and the velocity of water, the discharge from the river (Qr) is 0.126 m3/s. From the discharge equation Q= AV, the velocity of water in the pipe conveying water from the pump to the open channel (Vc) is the quotient of the discharge (0.126 m3/s) and the cross sectional area of the 170 mm pipe. Hence, Vc = 5.54 m/s. 3.2.2 Head loss from river to open channel (HL) HL = 4(4)2/2(9.81) + 15(5.54)2/2(9.81) = 26.70 m. 3.2.3 Head or energy added from point A to point B in Figure 4 (HA) The total head loss from the river to the open channel (HL= 26.70 m) is used to compute the head or energy added from point A to point B using Bernoulli’s equation from point 1 to point 2. The expressions V12/2g and V22/2g are the respective velocity heads at points 1 and 2. The expressions p1/ and p2/ are pressure heads at points 1 and , respectively, while z1 and z2 are elevation heads at points 1 and , respectively. In the equation below, z2 is the difference of open channel elevation at 350 m and the river elevation at 81.2 m equal to 268.8 m. V12/2g + p1/ + z1 + HA = V22/2g + p2/ + z2 + HL 0 + 0 + 81.2 + HA = 0 + 0 + 268.8 + 26.70 HA = 214.30 m 3.2.4 Required power output from pump in horsepower units (P) The power output required from the pump in Figure 4 is given by the empirical formula P = QE/746, where the discharge Q is in m3/s, the unit weight of water  = 9810 N/m3 and E is the energy added with the use of the pump, which is computed in section 3.2.3 as 214.30 m. Hence, the required power output from the centrifugal pump is given in horsepower. P = 0.126 (9810)(214.30)/746 P = 354.12  360 horsepower 3.2.5 Channel design using Manning’s equation. In the Manning equation, V = 1/n (R)2/3 (S)1/2 , the velocity, V is actually Vc, from section 3.2.1. Hence V = Vc = 5.54 m/s. The roughness coefficient, n, was assumed to be 0.014 for unpolished concrete surface. The slope, S, is 1:20 or 0.05 (CEH, 2005). From the known values of V, n and S, the hydraulic radius of the open channel, R, may be computed. V = 1/n (R)2/3 (S)1/2 R = [Vn/S1/2]3/2 = [(5.54) (0.014)/(0.05)1/2]3/2 = 0.204 3.2.6 Height (h) of rectangular open channel for most efficient design: R = h/2; h = R(2) = 0.204(2) = 0.408 m 3.2.7. Base width of open channel (B) for most efficient design: B = 2h = 2(0.408) = 0.816 m. 4.0 Conclusions The following conclusion were drawn based on the design considerations and the hydrograph analysis: 4.1 The hydrograph of the rainfall and river flooding data revealed a steeper rising limb than receding limb where accumulation rate of flood waters or river stage exceeded the recovery rate or return back to normal river height by 52.174%. This may be explained by the steepness of the rising limb and the moderate shallowness of the recession limb of the river flood hydrograph. Infiltration is slower as a results of the moderate permeability of majority of the catchment area. Land use affects the amount of run-off which the river receives. Other factors which affect the general characteristics of a flood hydrograph were not all observed during the analysis because the parameter which would aid in the analysis were not given. Particularly, such influences as tide, temperature were not anymore scrutinized. 4.2 The open channel design is limited to the River Cynon data provided with the assignment brief, which only included a four day observation on an hourly basis. Hence, only the maximum river height of 0.658 m was used in the analysis. With such constraint at hand, the possibility of conveying flood waters to an open channel using a pump was confirmed. Based on the design considerations, assumptions and limitations of the study, a centrifugal pump of at least 360 horsepower may be used. 4.4 For most efficient design, a rectangular open channel with a base width of 0.816 m and a height of greater than 0.408 m. is being proposed. 4.5. It is believed the proposed design will hold out for rain storms of comparable intensity. However, if long term interventions for river flooding are required, probabilistic concepts in flood design, particularly Gumbel method or the log Pearson type III distribution may be utilised to analyse the annual floods using available flooding history of the River Cynon. From here, a better perspective of the flooding characteristics may be evaluated. 5.0 References British Geological Society. 2005. Geology (Hydrogeology & Drift) [online]. [Accessed 19th April 2009]. Available from the World Wide Web: http://www.nwl.ac.uk/ih/nrfa/spatialinfo/Geology/geology057004.html Centre for Ecology and Hydrology (CEH). 2005. 57004 – Cynon at Abercynon [online]. [Accessed 17th April 2009]. Available from the World Wide Web: http://www.nwl.ac.uk/ih/nrfa/station_summaries/057/004.html Daugherty, R. L. 2007. Centrifugal pumps. Warwickshire, UK: Read Country Books. Environment Agency Wales. 2005. Concise register of gauging stations [online]. [Accessed 20th April 2009]. Available from the World Wide Web: http://www.nwl.ac.uk/ih/nrfa/station_summaries/op/EA-Wales1.html GeoHack. not dated. Map sources [online]. [Accessed 17th April 2009]. Available from the World Wide Web: http://stable.toolserver.org/geohack/geohack.php?pagename=River_Cynon¶ms=51_38_N_3_29_W_region:GB_type:river_source:GNS-enwiki Girdhar, P. & Moniz, O. 2004. Practical centrifugal pumps: Design, operation and maintenance. Oxford, UK: Newnes Publications. Gordon, N. D., Finlayson, B. L., McMahon, T. A., & Gippel, C. J. 2004. Stream hydrology: An introduction for ecologists. 2nd ed. West Sussex, UK: Wiley. Lee, C. C. & Lin, S. D. eds. 2007. Handbook of environmental engineering calculations. New York: McGraw-Hill Professional. Lewis, S. 1855. The book of English rivers: An account of the rivers of England and Wales, particularising their respective courses, their most striking scenery, and the chief places of interest on their banks. London: Longman, Brown, Green, and Longmans. Liu, H. 2003. Pipeline engineering. Boca Raton, FL: Lewis Publishers. Sewell, D. 2007. One of the many bridges that cross the River Cynon [online]. [Accessed 19th April 2009]. Available from the World Wide Web: http://www.flickr.com/photos/63767340@N00/2100613147 Read More
Cite this document
  • APA
  • MLA
  • CHICAGO
(Cynon River Hydrograph Potential Case Study Example | Topics and Well Written Essays - 2000 words - 4, n.d.)
Cynon River Hydrograph Potential Case Study Example | Topics and Well Written Essays - 2000 words - 4. https://studentshare.org/design-technology/1553817-storm-drainage-design-project
(Cynon River Hydrograph Potential Case Study Example | Topics and Well Written Essays - 2000 Words - 4)
Cynon River Hydrograph Potential Case Study Example | Topics and Well Written Essays - 2000 Words - 4. https://studentshare.org/design-technology/1553817-storm-drainage-design-project.
“Cynon River Hydrograph Potential Case Study Example | Topics and Well Written Essays - 2000 Words - 4”. https://studentshare.org/design-technology/1553817-storm-drainage-design-project.
  • Cited: 0 times

CHECK THESE SAMPLES OF Cynon River Hydrograph Potential

Storm Drainage Design

The graphs above are the results of the cynon river study data.... A hydrograph is a graph, either a bar graph or a line graph.... hellip; There are factors that control the shapes of a hydrograph.... The graph satisfy the components of a hydrograph.... This is the part of a hydrograph when water rises too the point of peak discharge.... The part of a hydrograph that is the highest point is called the peak discharge....
8 Pages (2000 words) Essay

Storm Drainage Design Project

he data gathered from the cynon river study the results above were plotted.... The paper "Storm Drainage Design Project" tells us about hydrograph.... A graph for the discharge of water in rivers is called a hydrograph.... hellip; Some factors control the shapes of a hydrograph.... (1975) included in his statement that the different shapes are shown in a hydrograph and the main components are labeled accordingly....
6 Pages (1500 words) Assignment

Storm Drainage Design Project

Flood hydrographs are very helpful to study the flood potential of a river.... The base lag refers to the time repose of the river with respect to a rainfall which signifies the drainage potential of the catchments.... When the discharge of the river versus the time is plotted a storm hydrograph is obtained (Geobytesgcse, n.... hellip; Various components of a hydrograph consist of a rising limb which represents the initial portion of a hydrograph, the peak discharge which related to the maximum discharge estimated and the receding limb , which relates to the decreasing part of the discharge with time....
6 Pages (1500 words) Essay

Storm Drainage Design Project

he data of the cynon river study was plotted having the results above.... A short lag time will indicate that water had already reached the river channel at a fast rate.... A larger size of runoff would mean that there is a longer lag time as water has a longer distance to reach the river trunk.... Tidal condition is the high spring tides that block the normal exit for the water, extending the length of time the river from the river basin takes to return to its original flow....
6 Pages (1500 words) Assignment

Storm Drainage Design Project Analysis

A hydrograph is a graph that concerns about the activities of bodies of water of more specifically, rivers and channels.... Peaks in a hydrographs are usually the results of precipitation events while troughs represent It is graph of the flow in a stream over a period of time The peaks in the hydrograph are results of precipitation events while troughs represent dry seasons.... There are several factors that control the shape of a hydrograph....
5 Pages (1250 words) Essay

Storm Drainage Project

The report "Storm Drainage Project" presents a detailed analysis of hydrographs that would be of much help to estimate the flood potential of the region of cynon river in Wales.... nbsp;A storm hydrograph is the graphical representation of the response of the river discharge concerning heavy rainfall.... If the major portion of runoff water reaches the river as overland flow, heavy rainfall would result in the quick response in the river, and the hydrograph shape would be at a peak....
7 Pages (1750 words) Report

Storm Drainage Design Project

It is necessary that the stream-hydrograph that is obtained from drainage areas be separated into ground-water flow.... The flood hydrograph is a plot of river discharge, usually a line graph over time.... A hydrograph tells the difference between the peak rainfall from the peak discharge.... There are factors that affect flood hydrograph.... A short lag time indicates that water had reached the river channel quickly....
7 Pages (1750 words) Case Study

A Hydrograph of River Cynon and Design of an Open Channel

This paper "A hydrograph of River Cynon and Design of an Open Channel" focuses on the fact that River Cynon is geographically located in South Wales and stretches from Hirwaun to Abercynon as a major tributary of the River Taff.... ased on the rainfall and river data for River Cynon given in the assignment brief, a hydrograph was developed using Microsoft Excel (2003).... This hydrograph depicts the hourly observations of rainfall and river stage height for a four-day period from October 12 to October 15, 1998....
9 Pages (2250 words) Report
sponsored ads
We use cookies to create the best experience for you. Keep on browsing if you are OK with that, or find out how to manage cookies.
Contact Us