StudentShare
Contact Us
Sign In / Sign Up for FREE
Search
Go to advanced search...
Free

A Hydrograph of River Cynon and Design of an Open Channel - Report Example

Cite this document
Summary
This paper "A Hydrograph of River Cynon and Design of an Open Channel" focuses on the fact that River Cynon is geographically located in South Wales and stretches from Hirwaun to Abercynon as a major tributary of the River Taff. The river has a catchment area of 160 square kilometres. …
Download full paper File format: .doc, available for editing
GRAB THE BEST PAPER95% of users find it useful
A Hydrograph of River Cynon and Design of an Open Channel
Read Text Preview

Extract of sample "A Hydrograph of River Cynon and Design of an Open Channel"

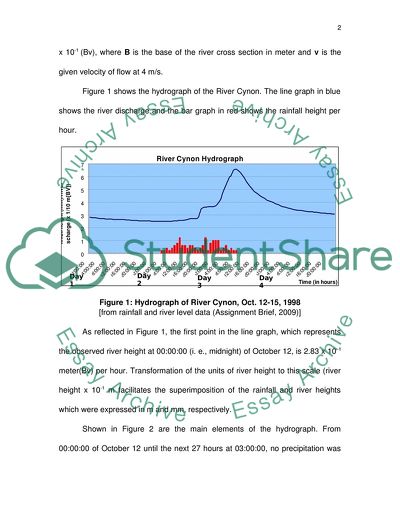
Storm Drainage Design Project: A Hydrograph Analysis of River Cynon and Design of an Open Channel 0 Introduction River Cynon is geographically located in South Wales and stretches from Hirwaun to Abercynon as a major tributary of the River Taf. The river has a catchment area of 160 square kilometers. Rainfall and river stage is monitored at Station 57004 at Abercynon operated by the Environment Agency in Wales. The station is a Flat V weir, which serves as a velocity-area station for high flows. Gauging history revealed that this station is over-topped by extreme floods and receives effluent discharges from industrial areas within the catchment. The station is located at elevation 81.2 m (Centre for Ecology and Hydrology [CEH], 2005). The maximum elevation of the catchment area is 515.6 m., while the minimum elevation is 80.8 m (CEH Wallingford. 2005). 2.0 Hydrograph Analysis of the River Cynon Based on the rainfall and river data for River Cynon given in the assignment brief, a hydrograph was developed using Microsoft Excel (2003). This hydrograph depicts the hourly observations of rainfall and river stage height for a four-day period from October 12 to October 15, 1998. Rainfall height is shown as a vertical bar graph plotted on an hourly time series in millimeter. River discharge is superimposed on the same time series as a line graph in terms of 1 x 10⁻¹ (Bv), where B is the base of the river cross section in meter and v is the given velocity of flow at 4 m/s. Figure 1 shows the hydrograph of the River Cynon. The line graph in blue shows the river discharge and the bar graph in red shows the rainfall height per hour. Figure 1: Hydrograph of River Cynon, Oct. 12-15, 1998 [from rainfall and river level data (Assignment Brief, 2009)] As reflected in Figure 1, the first point in the line graph, which represents the observed river height at 00:00:00 (i. e., midnight) of October 12, is 2.83 x 10⁻¹ meter(Bv) per hour. Transformation of the units of river height to this scale (river height x 10-1 m facilitates the superimposition of the rainfall and river heights which were expressed in m and mm, respectively. Shown in Figure 2 are the main elements of the hydrograph. From 00:00:00 of October 12 until the next 27 hours at 03:00:00, no precipitation was recorded. During the same period, the hourly observation of the river stage generated an average height of 0.263 m or a theoretical discharge of 0.263 m(Bv). This theoretical discharge may also be expressed as 15.75 m3 per second. Figure 2: Elements of the River Cynon Hydrograph The average river discharge before the precipitation started is the baseflow of the River for this analysis. After about 8 hours of precipitation, with an average height of 0.5 mm of rainfall per hour, peak rainfall of 1.2 mm was recorded at 11:00:00 of October 13. After 10 hours, and an average precipitation of 0.56 mm per hour, a second rainfall peak, also at 1.2 m was recorded on 21:00:00 of October 13. From the first peak of rainfall (1.2 mm at 00:00:00 on October 12) to the peak river height (0.658 m[BV] m3/hr at 09:00:00 on October 14) during the four-day observation, 22 hours elapsed. This is the basin lag time. The rising limb starts during the first peak of the rainfall and culminates with peak river height. As shown in Figure 2, the rising limb is steep. This phenomenon indicates a slower infiltration rate and larger overland flow. Slow infiltration rates may, in turn be attributed to the hydrogeology of the catchment area. Much of this catchment has moderate permeability (65.5 percent inter-granular and 5.8 percent fissured) and, therefore, slow infiltration (British Geological Society, 2005). The catchment area is comparatively large at 160 square kilometers. At peak river height of 0.658 m, river water accumulation would have reached its maximum discharge, theoretically computed as follows: Discharge : Q = river cross sectional area (A) x velocity of flow (v) Q = (15 m x 0.658 m) x 4 m/s Q = 41.113 m3/s From the peak river height to the end of the observation, 60 hours were counted. This duration represented the time elapsed for the river flood to return from peak flow back to base flow. This is represented by the recession limb of the hydrograph, which is moderately shallow. By comparison, it took only 22 hours to accumulate the river flood waters , but 60 hours to return to base flow. Surface run-off or overland flow also tends to contribute to the flood discharge of the river. The theoretical amount of overland flow is computed by the formula for overland flow based on the rational method in terms of the peak rate of run-off: Qo = run-off coefficient (c) x I (rainfall intensity) x Ad (catchment area) Table 2 shows the detailed computation of the total surface run-off coefficient based on the land use classification of the catchment and the effects of slope, soil type and vegetative cover. Table 2: Total run-off coefficient in terms of slope, soil type and vegetation (British Geological Society, 2005; Hald, Hassing, Hogedal and Jacobsen, 2004) Run-off Coefficient due to Slope, Ct Land Use Percentage Run-off Coefficient due to Soil Type, Cs Run-off Coefficient due to Vegetation, Cv 0.08 Grassland Woodland Mountain, heath, bog Built-up areas Arable and horticulture 48.0 22.1 14.4 12.5 2.8 - - 0.16 - - 0.21 0.04 - 0.28 0.11 99.81 Run-off Coefficient = 0.08 + 0.16(0.144) + [0.21(0.48)+0.04(0.221)+0.28(0.125)+0.11(0.028) Run-off Coefficient = 0.251 1 Water (inland) was disregarded from the computations because this contributes to interflow and not to surface run-off According to Hald, Hassing, Hogedal and Jacobsen (2004), the volume of overland flow or surface run-off is affected by topography, soils and vegetation, such that the total run-off coefficient (C) is the sum of coefficients due to topography (Ct), soil (Cs) and vegetation (Cv). Since the slope of the area is 1:20 or 5%, this contributes 0.08 to the run-off coefficient as Ct (CEH, 2005). Meanwhile, the mountain, heath and bog area of the catchment which is basically clay and loam contributes 0.16 to C. The woodland (forest), farmland (arable and horticulture), grassland and built-up areas (i. e., no vegetation) of the catchment contributed 0.04, 0.11, 0.21 and 0.28, respectively (Hald et al., 2004, p. 188). Hence, the total run-off coefficient is 0.251. The overland flow or surface run-off is the product of the run-off coefficient (C, unitless), the rainfall intensity (i, m/s) and catchment area (Ad in m2). Surface run-off = 0.251 (1.463 x 10⁻⁷ m/s)( 160000000 m2) Surface run-off = 5.875 m3/s Considering rainfall and the drainage characteristics, a flood flow of about 47 m3/s (i. e., 41.113 + 5.875) may be expected from River Cynon due to moderate rainfall. Hence, using water from this river will serve dual purposes of additional public water supply and safeguard against flooding. As indicated in the project assignment brief, a pump may be used to pump out water from the river and to convey water to an open channel which will feed water to a storage reservoir. 3.0 Design of Open Channel and Pump Power Requirement 3.1 Design criteria and assumptions 3.1.1. A 250-mm diameter pipe and the 200-mm diameter pipe will be used to convey water from the river to the pump and from the pump to the open channel. Galvanised steel pipes will be used. Pipes of galvanised steel have a maximum roughness coefficient of 0.017 (Forrester, 2001). 3.1.2. The open channel will be constructed of unpolished concrete with an approximate roughness coefficient of 0.014. 3.1.3. It is assumed that the head loss from the river to the pump is four times the velocity head in the 250-mm diameter pipe, while the head loss from the pump to the open channel is 12 times the velocity head in the 200-mm diameter pipe 3.1.4. As indicated in the brief for the project assignment, the river is assumed to be 15 m wide with a velocity of m/s flowing in a rectangular cross section. 3.1.5. The pump will be laid out at an elevation of 81.2. This is an the elevation where an existing gauging station is located, and is, therefore, the actual elevation of the river (Centre for Ecology and Hydrology - Wallingford ,2005). 3.1.6. The open channel will be located at an elevation of 300 m. This elevation is the class mark (or mid-value) of the elevation range makes up 31% of the 160 km2 area, the largest percentage of the catchment area (CEH Wallingford, 2005). 3.1.7. A centrifugal pump will be used because is the most commonly used among the various types of pump and has many disadvantages over other types of pumps. Among the many desirable features of the centrifugal pump are: (a) simply designed which allows for a wide range of capacities and applications (2) easy to operate and maintain (3) and capability for longer operating life (Spellman and Drinan, 2001; Karassik, Messina, Cooper and Heald, 2001; Daugherty, 2007). 3.1.8. Slope used in the computations was based on a actual slope of the gauging station of the river at Abercynon. 3.2. Possible limitations of the design 3.2.1. The design did not include specifications for the length of the pipes because of insufficient data. 3.2.2. All the computations involving river flow velocity was based on the given 4 m/s in the project assignment brief. 3.2.3. River cross section shape and base width was also based on the given data from the project brief. 3.2.4. Modified rainfall and river height data were given as bases for the computations. 3.2.5. Data is too old (almost 11 years ago). Actual conditions may not anymore approximate current state of the hydrogeological parameters considered in the computations. 3.3. Diagram of the proposed design Figure 3: Proposed drainage for River Cynon 3.4. Computations and discussion Water velocity on the 250-mm diameter pipe is 4 m/s (V1). From the discharge formula (Q = VA), water flow from the river is 0.196 m3/s. Water velocity from the pump to the open channel (V2) is computed from the same formula, where Q = 0.196 m3/s, such that V2 is 6.25 m/s. 3.1. Head loss (HL) from A to B: HL = 4(4)2/2(9.81) + 12(6.25)2/2(9.81) HL = 27.15 m. 3.2. Energy added with the use of pump (HA) : From Bernoulli’s theorem, V12/2g + p1/ + z1 + HA = V22/2g + p2/ + z2 + HL 0 + 0 + 81.2 + HA = 0 + 0 + (300 – 81.2) + 27.15 0 + 0 + 81.2 + HA = 0 + 0 + 218.8 + 27.15 HA = 164.75 m 3.3 Required power output from pump (Po): The required power for the pump (Po) is given by the formula: Po = Q x W x HA / 746 From the above formula, Q is the flow from River Cynon computed to be 0.096 m3/s; W is the specific weight of water, a constant taken as 9810 N/m3; and HA is the added energy head from the pump, which is 164.75 m. Po = 0.196(9810)(164.75)/746 Po = 425.40  430 horsepower 3.4. Computations leading to the wetted perimeter of the open channel (P) The velocity of flow towards the open channel (V2) was pre-computed to be 5.44 m/s. The roughness coefficient (n) indicated in the design specifications for unpolished concrete is 0.014 and the slope (n) is 0.05. Manning’s formula for open channel velocity is: V = 1/n (R)2/3 (S)1/2 Substituting the known values for V (actually ), n, and S, the hydraulic radius (R) may be computed as follows: 6.25 = (1/0.014) (R)2/3 (0.05)1/2 R = 0.245 If design for most efficient section is to be adopted, the height of an open channel (h) with a rectangular cross section is twice of the hydraulic radius. From R = h/2, h = R(2) h = 0.245(2) h = 0.49 or 0.50 m. The base width of the open channel (B) is: B = 2(h) B = 2(0.5) = 1.00 m. The wetted perimeter for a rectangular section (P) is: P = 1.00 + 0.50 + 0.50 = 2.00 m. 4.0 Conclusions and Recommendations Following are the conclusions drawn for the drainage design project based on the hydrograph analysis and the design of the open channel: 4.1 For a comparable rainstorm, the ratio of the discharge accumulation time to recovery time back to base flow is 11:30 or 1:2.7. The storm hydrograph has a steep rising limb and a moderately shallow receding limb, which explains why it takes almost three times the time needed to reach peak flow for the flood waters to recede back to base flow. A drainage project for the river flood may, thus be undertaken to secure the adjacent areas against flooding and other damages caused by floods. 4.2 Overland flow and river stage is affected by many factors including the hydrogeologic characteristics of the catchment area such as topography, soil type and vegetative cover. Other factors are rainfall intensity and the hydraulic properties of the river itself. 4.3 To facilitate drainage, a centrifugal pump of at least 430 horsepower may be used to convey water to an open channel of unpolished concrete. The open channel must be rectangular and needs to be at least 1 meter at the based and more than 0.5 m in height. 4.4 For most efficient design, a rectangular open channel may be used with a base width of 1.70 m and a height greater than 0.85 m. 4.5. A more detailed run-off modeling needs to be utilised for actual conditions based a at least 10 years of flood data. Regression analysis may be used to construct location specific flood formulas and other catchment parameters. 4.6 A risk-based design may also be adopted based on the recurrence interval of a flood using probability concepts, supplemented by sensitivity analysis to ascertain the possibility of various forms of damages, including road damage, interruption of traffic and economic consequences. 5.0 References Assignment Brief. 2009. Storm Drainage Design Project British Geological Society. 2005. Geology (Hydrogeology & Drift) [online]. [Accessed 19th April 2009]. Available from the World Wide Web: http://www.nwl.ac.uk/ih/nrfa/spatialinfo/Geology/geology057004.html Centre for Ecology and Hydrology (CEH). 2005. 57004 – Cynon at Abercynon [online]. [Accessed 25th April 2009]. Available from the World Wide Web: http://www.nwl.ac.uk/ih/nrfa/station_summaries/057/004.html CEH Wallingford. 2005. Elevation [online]. [Accessed 25th April 2009]. Available from the World Wide Web: http://www.nwl.ac.uk/ih/nrfa/spatialinfo/Elevation/elevation057004.html Daugherty, R. L. 2007. Centrifugal pumps. Warwickshire, UK: Read Country Books. Environment Agency Wales. 2005. Concise register of gauging stations [online]. [Accessed 20th April 2009]. Available from the World Wide Web: http://www.nwl.ac.uk/ih/nrfa/station_summaries/op/EA-Wales1.html Forrester, K. 2001. Subsurface drainage for slope stabilization. Reston, VA: American Society of Civil Engineers [ASCE] Press. Hald, T., Hassing, J., Hogedal, M. and Jacobsen, A. 2004. Hydrology and drainage. In: R. Robinson and B. Thagesen, eds. Road Engineering for Development, London: Spon Press, pp. 178-204. Karassik, I. J., Messina, J. P., Cooper, P. and Heald, C. C. 2001. Pump handbook. 3rd ed. New York: McGraw-Hill Professional. Liu, H. 2003. Pipeline engineering. Boca Raton, FL: Lewis Publishers. Spellman, F. R. and Drinan, J. 2001. Water Hydraulics. Lancaster, PA: Technomic Publishing Company, Inc. Read More
Tags
Cite this document
  • APA
  • MLA
  • CHICAGO
(A Hydrograph of River Cynon and Design of an Open Channel Report - 7, n.d.)
A Hydrograph of River Cynon and Design of an Open Channel Report - 7. https://studentshare.org/geography/1723332-storm-drainage-design-project
(A Hydrograph of River Cynon and Design of an Open Channel Report - 7)
A Hydrograph of River Cynon and Design of an Open Channel Report - 7. https://studentshare.org/geography/1723332-storm-drainage-design-project.
“A Hydrograph of River Cynon and Design of an Open Channel Report - 7”. https://studentshare.org/geography/1723332-storm-drainage-design-project.
  • Cited: 0 times

CHECK THESE SAMPLES OF A Hydrograph of River Cynon and Design of an Open Channel

Storm Drainage Design

omputationsBy the application of the Manning's Formula, we will be able to get the value of breadth b of the open channel with the following dataChannel design Given Data Q = 1.... In the study of storm drainage design, we will be able to learn the functions of hydrographs in the design of open channels and reservoir.... a hydrograph is a graph, either a bar graph or a line graph.... hellip; There are factors that control the shapes of a hydrograph....
8 Pages (2000 words) Essay

Storm Drainage Design Project: Scientific Methods

This information is then used in the design of flood control facilities.... To understand more on the subject at hand, we first define what is a storm and a hydrograph.... Meanwhile a hydrograph is defined as "a representation of flow for a particular stream and is used to evaluate the watershed runoff volumes and the peak flow rates from a single storm or set of storms.... They are useful in planning for flood situations and times of drought as they show the discharge (amount of water reaching channel via surface run-off, through flow, and base flow) that originated as precipitation....
5 Pages (1250 words) Assignment

Storm Drainage Design Project

The flood hydrograph for river cynon is prepared by plotting he discharge through the river along the Y-axis and the time along x-axis.... The reports available have said that the subsurface conditions of the river cynon basin is low permeability soil that could result in low infiltration rates.... The slow rise is the level of river flow depth signified the majority of volume reaching the river as ground water flow.... hellip; Various components of a hydrograph consist of a rising limb which represents the initial portion of a hydrograph, the peak discharge which related to the maximum discharge estimated and the receding limb , which relates to the decreasing part of the discharge with time....
6 Pages (1500 words) Essay

Storm Drainage Design Project and Flooding

a hydrograph would show the difference between the peak rainfall from the peak discharge.... Then a lag time is greater, there is less chance of flooding whereas a short lag time will show that water had reached the river channel quickly.... The main objective of the assignment "Storm Drainage design Project and Flooding" is to develop a storm drain system.... Engineering design will be based on specified probability storm and the runoff generated by catchments In the hydrographs of Cynon River, there was an almost steady flow of water in the river for the first 40 hours....
5 Pages (1250 words) Assignment

Storm Drainage Design Project

A short lag time will indicate that water had already reached the river channel at a fast rate.... The channel flow becomes falls faster down a steep slope thus, producing a steeper rising limb and a shorter lag time.... The paper "Storm Drainage design Project" tells us about peak rainfall and peak discharge.... he data of the cynon river study was plotted having the results above.... A larger size of runoff would mean that there is a longer lag time as water has a longer distance to reach the river trunk....
6 Pages (1500 words) Assignment

Storm Drainage Design Project Analysis

005 R = hydraulic radius v = R2/3S1/ 2 S = slope n n = Manning's coefficient of roughness A = db A = cross-sectional area b = breadth Q = Av d = depth wetted perimeter = 2d + b v = R2/3S1/ 2 n Requirement = width of base b of the open channel Discharge Q of the river into the open channel Design of water pump to discharge water from the river to the open channel Computations: A = db = (0....
5 Pages (1250 words) Essay

Storm Drainage Design

The paper "Storm Drainage Design" presents that hydrology and hydraulic modeling systems are extensively used by infrastructure engineers and crisis management departments for estimation of availability of water, design of dams, diversions, and flood control through reservoirs or channels, etc.... It investigates the chances of taking water supply from the river by means of a pipeline or channel.... The paper also discusses different design considerations for such a pipeline or channel....
6 Pages (1500 words) Coursework

Storm Drainage Design Project

nbsp;river cynon in South Wales is located along with coordinates 51° 38' 00” N, 3° 29' 00” W.... Using the river cynon data provided together with the brief of this project, the following hydrograph in Figure 3 was prepared using Microsoft Excel (2003).... The study "Storm Drainage design Project" presents a thorough hydrological and technical analysis of the Cynon River in Wales aiming at building the storm drainage mechanism....
7 Pages (1750 words) Case Study
sponsored ads
We use cookies to create the best experience for you. Keep on browsing if you are OK with that, or find out how to manage cookies.
Contact Us