StudentShare
Contact Us
Sign In / Sign Up for FREE
Search
Go to advanced search...
Free

Storm Drainage Design Project - Case Study Example

Cite this document
Summary
The study "Storm Drainage Design Project" presents a thorough hydrological and technical analysis of the Cynon River in Wales aiming at building the storm drainage mechanism. River Cynon in South Wales is located along with coordinates 51° 38’ 00” N, 3° 29’ 00” W…
Download full paper File format: .doc, available for editing
GRAB THE BEST PAPER97.3% of users find it useful
Storm Drainage Design Project
Read Text Preview

Extract of sample "Storm Drainage Design Project"

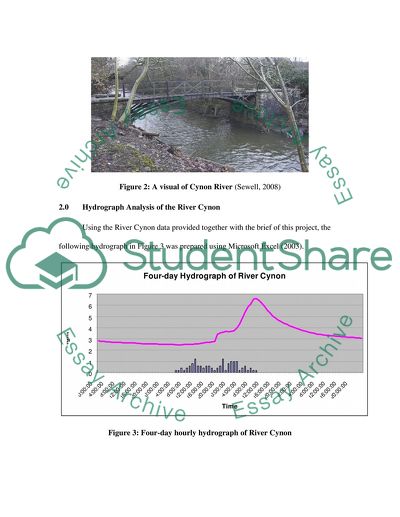
1.0 Introduction River Cynon in South Wales is located along coordinates 51 38’ 00” N, 3 29’ 00” W. It is part of the river network of England andWales shown in Figure 1 and identified using the red circle. Figure 2: Map of the river network of England and Wales A view of the Cynon River with an old cast iron bridge at the top is shown in Figure 2. Figure 2: A visual of Cynon River (Sewell, 2008) 2.0 Hydrograph Analysis of the River Cynon Using the River Cynon data provided together with the brief of this project, the following hydrograph in Figure 3 was prepared using Microsoft Excel (2003). Figure 3: Four-day hourly hydrograph of River Cynon The hydrograph shown in Figure 3 indicates the duration of observations in the horizontal axis. Observations considered were from midnight (00:00:00 hour) of October 12, 1998 until 11:00 pm (23:00:00 hours) of October 15, 1998. Due to space constraint, observation intervals were shown every four hours, but the data used hourly observations in the plotting of the hydrograph. The height of rainfall and the river discharge in terms of the river level were shown on the vertical axis using two different scales. Height of rainfall is plotted in terms of millimetres, while river level (river height) is plotted in terms of 1 x 10⁻¹ meter. For example, the river height observed at 00:00:00 of October 12 is 0.283 meters, but in plotting the hydrograph, 0.283 was multiplied 10 and plotted as 2.83, instead. This scheme was utilised for aesthetic purposes in the desired hydrograph. Data were, however, analyzed using the original value and unit of the river level per hour of observation. The rising limb, peak and recession limb of the resulting Cynon River flood from the given data is shown in Figure 4. Figure 4: Rising limb, peak and recession of the Cynon River flood (Oct. 12-15, 1998). As illustrated in Figure 4, river started to rise in the river at 11:00:00 hours on October 13 when rainfall reached its first peak at 1.20 mm. Interestingly, the second rain peak (also at 1.20 mm.) occurred after 10 hours at 21:00:00 of the same day (October 13). It may be observed from the hydrograph that as the second peak of the rainfall approached, river flow also reached a mini-peak. From hereon, the rising limb of the river flow was very clearly defined. From the first peak of rainfall, the basin lag time was calculated to be 22 hours. This means that it took 22 hours after the first peak of rainfall for the river flow to reach its peak. From the second peak of rainfall, the basin lag time was 12 hours. The average discharge for the rising limb (Q1) of the river flow is calculated as follows: Q1 = vm x h1 = 4.66 m2/s x 0.392 m Q1 = 1.83 m3/s where : vm = mean velocity of River Cynon which is equal to 4.66 m2/s (British Geological Society, 2007) h1 = average river height from the first peak of rainfall to the peak flow of the river, computed to be 0. 392 m. The peak of the flood waters was reached when the river height was 0.658 meters at 09:00:00 on October 14, 1998. This translates to a river discharge (Q) of 3.07 m3/s, computed as follows: Q = vm x hp = 4.66 m2/s x 0.658 m Q = 3.07 m3/s where : vm = mean velocity of River Cynon (British Geological Society, 2007) hp = river height at peak flow The duration for the peak flow to return back to base flow is 46 hours. Several factors which affect the characteristics of storm or rainfall hydrographs have been described from existing literature. Each of these factors were analysed with respect to the River Cynon hydrograph. The catchment area of 160 sq. km. (Environment Agency – Wales, 2005) is considerably large, which should explain the long lag time of 22 hours before the river flow reached its peak. A large catchment area also tends to receive more precipitation, and subsequently larger run-off. The theoretical amount of run-off which may be expected from the given River Cynon rainfall data was calculated to be 884,800 cubic meters. The basis of this run-off volume (RV) is as follows: RV = height of precipitation x catchment area x run-off coefficient RV = 15.8 mm x 160 km2 x 0.35 Height of rainfall in mm is converted to meter (0.0158 meter) and catchment area in sq. km. is converted to sq. m. (160,000,000 m2) RV = 884,800 m3 The Centre for Ecology and Hydrology ([CEH] 2005) described the River Cynon catchment as one with coal measures and millstone grit on its northern end and 30% boulder clay cover and alluvium in the Cynon valley. Residents engage in livestock farming in the heathland along the upland area characterized by peaty soil. The catchment is also seasonally wet and is 20% forested in its southern half. There is extensive urban and industrial development in the valley, which is described as steep-sloped. There is also open cast coal mining in the upper areas. Data for land use classification and the respective percentages of the catchment devoted to such uses, together with the elevation of the catchment area at 1:20, were derived from CEH (2005). Run-off coefficients, as well as the classification of the area as rolling based on a slope of 0.05 (or 1:20), were based on Lee and Lin (2007). The catchment area may be categorized into various uses: Land use classification Percentage of catchment Run-off coefficient Woodland 22.1 0.15 Arable & horticulture 2.8 0.55a Grassland 48.0 0.30b Mountain, heath, bog 14.4 0.65c Built-up areas 12.5 0.50d Average 0.35 a based on cultivated land (clay, loam); b based on grassed areas; c based on earth areas; d based on suburban residential areas. From the theoretical volume of run-off accumulated, the rate of accretion is 40,218.18 m3/hr, whereas recovery rate back to baseflow is slower at 19,234.78 m3/hr. Akan and Houghtalen (2003) maintained that topography, vegetative cover and soil type play respective roles in the discrepancy in the duration of run-off accretion and the baseflow recovery. In terms of soil type, 65% of the Cynon River catchment area is of moderate permeability, suggesting slower infiltration rate and which should partly explain the substantial volume of overland flow and a steep rising limb (British Geological Society, 2005; Gordon, Finlayson, McMahon and Gippel, 2004). 3.0 Pumping and Channel Design Considering that a rainstorm with a height of 0.53 mm for 30 hours generated a theoretical run-off of 884,800 m3, it is very possible that water from the river may be utilized for storage in a reservoir. Following are the design considerations and assumptions: 1. It was assumed that pumping is required to discharge water from the river into an open channel which feeds the storage reservoir. 2. As given in the project brief, the river is 15 meters wide, of rectangular cross section and having a flow velocity of 4 m/s. 3. The river height is designed from the highest observation from the Cynon River data at 0.658 m. This height will be reckoned from the elevation of the pipe from the river to the pump, which is 80.8 meter, the lowest elevation in the catchment (CEH Wallingford, 2005). The pipe will be at the same elevation. 4. The elevation of the open channel where the river water will be conducted through pumping is 270.4 m, based on the average elevation of the catchment area (CEH Wallingford, 2005). 5. From the river to the pump, a 100-mm diameter pipe will be used. From the pump to the open channel, an 80-mm diameter pipe will be used. 6. It was assumed that the loss of head from the river (A) to point 1 in Figure 5 is equal to the velocity head in the 100-mm pipe, while the loss of head from point 2 in Figure 5 to the open channel (B) is twice the velocity head in the 80-mm pipe. 7. A centrifugal pump will be used based on its merits as explained in Daugherty (2007). 8. It was assumed that pre-cast concrete was used for the 100-mm and 80- mm pipes. From Forrester (2001), the average roughness coefficient for pre-cast concrete pipe is 0.012 (p.29). 9. It was also assumed that unpolished concrete will used for the open channel. The approximate roughness coefficient (n) according to Liu (2003) is 0.014. Figure 5 shows a diagram of the proposed open channel and pump for conveyance of river water into a storage reservoir via an open channel. Figure 5: Diagram of proposed open channel and pump Following are the computations and pertinent discussion: Since it was given in the project brief that the velocity of river flow is 4 m/s, it follows that the velocity of water on the 100 mm pipe (V1) is 4 m/s. From the formula, Q = VA, the discharge from the river is 0.071 m3/s. The velocity of water from the pump to the open channel or the 100 mm pipe (V2) is computed from the same formula, with Q = 0.031 m3/s. V2 is 6.25 m/s. 3.1. Head loss from A to B (HLA-B): HLA-B = 3(4)2/2(9.81) + 2(6.25)2/2(9.81) = 42.27 m. 3.2. Head loss from the river (HLA): Using Bernoulli’s equation, V32/2g + p3/ + z3 + HLA = V42/2g + p4/ + z4 + HLA –B 0 + 0 + 80.8 + HLA = 0 + 0 + (270.4 – 80.8) + 42.27 HLA = 151.07 m 3.3 Required horsepower output from pump (HP): HP = QWE/746 where : W = specific weight of water in N/m3 E = HLA = 151.07 m HP = 0.031(9810)(151.07)/746 HP = 62.41  65 horsepower 3.4. Wetted perimeter of the open channel (P) given that the velocity of flow going to the open channel, V2 = 9 m3/s: Using Manning’s formula: From V = 1/n (R)2/3 (S)1/2 6.25 = (1/0.014) (R)2/3 (0.05)1/2 ; R = 0.245 ; and 3.4.1. Height of rectangular open channel (h) for most efficient design: R = h/2; h = R(2) = 0.245(2) = 0.49 m, say 0.5 m. 3.4.2. Base width of open channel (B) for most efficient design: B = 2h = 2(0.5) = 1.00 m. Therefore, the wetted perimeter is 1 + 0.5 + 0.5 = 2 m 4.0 Conclusions Based on the hydrograph analysis and channel design, the following conclusions were drawn: 4.1 The given rainfall data for Cynon River generated a steep rising limb and a moderately shallow receding limb, a basin lag time of 22 hours and a peak river flow at 0.658 m, corresponding to a run-off volume of 884,800 m3. 4.2 The rate of accretion of water into the river was 40,218.18 m3/hr, while the rate of recovery to baseflow was substantially lower at 19,234.78 m3/hr. 4.3. A number of factors including soil type, vegetative cover, topography and land use affect the amount of run-off that accumulates into the River Cynon during heavy rainfall. There are other factors, but these were not observed from the River Cynon data because of insufficiency of given data. 4.3 It is possible for water from the River Cynon to be diverted to an open channel using a centrifugal pump of at least 65 horsepower. 4.4 For most efficient design, a rectangular open channel may be used with a base width of 1.0 m and a height greater than 0.5 m. 4.5. Probability concepts in flood design may be utilised together with hydrograph analysis for more secure flood defence structures. 5.0 References Akan, A. O. and Houghtalen, R. J. 2003. Urban hydrology, hydraulics and stormwater quality: Engineering applications and computer modeling. Hoboken, NJ: JohnWiley & Sons. British Geological Society. 2005. Geology (Hydrogeology & Drift) [online]. [Accessed 17th April 2009]. Available from the World Wide Web: http://www.nwl.ac.uk/ih/nrfa/spatialinfo/Geology/geology057004.html British Geological Society. 2007. Sample hydrograph gauged daily flows [online]. [Accessed 17th April 2009]. Available from the World Wide Web: http://www.nwl.ac.uk/ih/nrfa/station_summaries/057/004.html Centre for Ecology and Hydrology (CEH). 2005. 57004 – Cynon at Abercynon [online]. [Accessed 17th April 2009]. Available from the World Wide Web: http://www.nwl.ac.uk/ih/nrfa/station_summaries/057/004.html CEH Wallingford. 2005. Elevation [online]. [Accessed 17th April 2009]. Available from the World Wide Web: http://www.nwl.ac.uk/ih/nrfa/spatialinfo/Elevation/elevation057004.html Daugherty, R. L. 2007. Centrifugal pumps. Warwickshire, UK: Read Country Books. Environment Agency – Wales. 2005. Concise register of gauging stations [online]. [Accessed 17th April 2009]. Available from the World Wide Web: http://www.nwl.ac.uk/ih/nrfa/station_summaries/op/EA-Wales1.html Forrester, K. 2001. Subsurface drainage for slope stabilization. Reston, VA: American Society of Civil Engineers [ASCE] Press. Gordon, N. D., Finlayson, B. L., McMahon, T. A., and Gippel, C. J. 2004. Stream hydrology: An introduction for ecologists. 2nd ed. West Sussex: John Wiley & Sons, Ltd. Lee, C. C. and Lin, S. D eds. 2007. Handbook of environmental engineering calculations. New York: McGraw-Hill Professional. Liu, H. 2003. Pipeline engineering. Boca Raton, FL: Lewis Publishers. Sewell, D. 2008. Cast iron bridge over River Cynon [online]. [Accessed 17th April 2009]. Available from the World Wide Web: http://www.panoramio.com/photo/8789380. Read More
Cite this document
  • APA
  • MLA
  • CHICAGO
(Storm Drainage Design Project Case Study Example | Topics and Well Written Essays - 1750 words - 5, n.d.)
Storm Drainage Design Project Case Study Example | Topics and Well Written Essays - 1750 words - 5. https://studentshare.org/design-technology/1553868-storm-drainage-design-project
(Storm Drainage Design Project Case Study Example | Topics and Well Written Essays - 1750 Words - 5)
Storm Drainage Design Project Case Study Example | Topics and Well Written Essays - 1750 Words - 5. https://studentshare.org/design-technology/1553868-storm-drainage-design-project.
“Storm Drainage Design Project Case Study Example | Topics and Well Written Essays - 1750 Words - 5”. https://studentshare.org/design-technology/1553868-storm-drainage-design-project.
  • Cited: 0 times

CHECK THESE SAMPLES OF Storm Drainage Design Project

Storm Drainage Design

The paper “storm drainage design” seeks to evaluate hydrographs, which are graphs which represent the relation of the height and discharge of water in rivers over a certain period of time.... n the computations of the design of the open channel and the river, or the water source for a reservoir.... First, we must set conditions for the design criteria.... omputations of the Channel design With the given data below, it is required that we get the value of breadth b of an open channel using the Manning's Formula....
8 Pages (2000 words) Research Proposal

Storm Drainage Design

Usually, in the study of storm drainage, the analysis of hydrographs are considered.... n the study of storm drainage, the analysis of hydrographs are important.... Hence water from the river can be useful if we know how to make a design that is truly fruitful to end users.... The vegetation type and the steepness of the surrounding lands, with the drainage density(Stott,2005)....
5 Pages (1250 words) Essay

Storm Drainage Design

In the study of storm drainage design, we will be able to learn the functions of hydrographs in the design of open channels and reservoir.... omputationsBy the application of the Manning's Formula, we will be able to get the value of breadth b of the open channel with the following dataChannel design Given Data Q = 1....
8 Pages (2000 words) Essay

Storm Drainage Design Project: Scientific Methods

The writer of this assignment seeks to comparatively analyze the potential solutions to designing a storm drainage system for flooding situations.... This information is then used in the design of flood control facilities.... raphs that show how a drainage basin responds to a period of rainfall.... To understand more on the subject at hand, we first define what is a storm and a hydrograph.... According to Wikipedia, a storm is any disturbed state of an astronomical body's atmosphere, especially affecting its surface, and strongly implying severe weather....
5 Pages (1250 words) Assignment

Storm Drainage Design Project

The base lag refers to the time repose of the river with respect to a rainfall which signifies the drainage potential of the catchments.... The properly constructed hydrograph would be able to considerable amount of information of the behaviour of drainage basin with respect to a rainfall.... The hydrograph hence plotted is shown in figure 1 and provides the detailed information on the drainage characteristics of the basin.... When the discharge of the river versus the time is plotted a storm hydrograph is obtained (Geobytesgcse, n....
6 Pages (1500 words) Essay

Storm Drainage Design Project and Flooding

The main objective of the assignment "Storm Drainage Design Project and Flooding" is to develop a storm drain system.... The project involves the accumulation of basic data, the familiarity with the site and the basic understanding of the hydrologic and the hydraulic principles and the drainage policy.... Engineering design will be based on specified probability storm and the runoff generated by catchments In the hydrographs of Cynon River, there was an almost steady flow of water in the river for the first 40 hours....
5 Pages (1250 words) Assignment

Storm Drainage Design Project Analysis

In our study of storm drainage, the study of hydrographs and their analyses are to be taken into account.... hellip; Hydrographs are records for the study of storm drainage.... Channel design Given data are: Apply the Manning formula to design a suitable breadth b, with Q = 1....
5 Pages (1250 words) Essay

A Hydrograph of River Cynon and Design of an Open Channel

This paper "A Hydrograph of River Cynon and design of an Open Channel" focuses on the fact that River Cynon is geographically located in South Wales and stretches from Hirwaun to Abercynon as a major tributary of the River Taff.... The river has a catchment area of 160 square kilometres....
9 Pages (2250 words) Report
sponsored ads
We use cookies to create the best experience for you. Keep on browsing if you are OK with that, or find out how to manage cookies.
Contact Us