StudentShare
Contact Us
Sign In / Sign Up for FREE
Search
Go to advanced search...
Free

Storm Drainage Project - Report Example

Cite this document
Summary
The report "Storm Drainage Project" presents a detailed analysis of hydrographs that would be of much help to estimate the flood potential of the region of Cynon River in Wales. A storm hydrograph is the graphical representation of the response of the river discharge concerning heavy rainfall…
Download full paper File format: .doc, available for editing
GRAB THE BEST PAPER98.8% of users find it useful
Storm Drainage Project
Read Text Preview

Extract of sample "Storm Drainage Project"

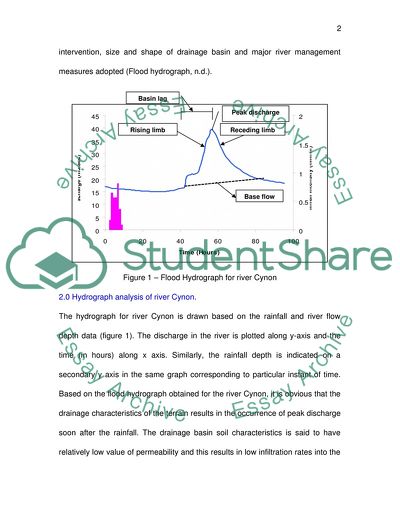
Storm Drainage Design Project 0 Introduction A storm hydrograph is the graphical representation of the response of the river discharge with respect to heavy rainfall. A detailed analysis of hydrographs would be of much help to estimate the flood potential of the region (Geobytesgcse, n.d.). The time repose of river to the rainfall is quantified as lag time which shows the time difference between the peak rainfall and the peak discharge in the river corresponding to that rainfall. Thus the rivers that have relatively short lag time respond very quickly to rainfall and hence can be considered as more prone to rainfall than those with larger lag time. The inflow into the river after the rainfall is through different ways. The major types are overland flow which represents the surface flows which includes other direct flows into the river. The ground water flow component is the sub-surface runoff component contributing to the river discharge from a particular region after the rainfall. If the major portion of runoff water reaches the river as overland flow , a heavy rainfall would result in quick response in the river and the hydrograph shape would be peak. Thus the risk of floods would be higher in this case. While if the major share is through ground water flow the rise in discharge is slower and the repose of the river is slower. Thus the rate at which the flood waters reaches the river body determines the shape of t he hydrograph. The major factors contributing to these situations are characteristics of drainage basin, type and amount of precipitation, land use pattern in a region, impact caused by human intervention, size and shape of drainage basin and major river management measures adopted (Flood hydrograph, n.d.). Figure 1 – Flood Hydrograph for river Cynon 2.0 Hydrograph analysis of river Cynon. The hydrograph for river Cynon is drawn based on the rainfall and river flow depth data (figure 1). The discharge in the river is plotted along y-axis and the time (in hours) along x axis. Similarly, the rainfall depth is indicated on a secondary y axis in the same graph corresponding to particular instant of time. Based on the flood hydrograph obtained for the river Cynon, it is obvious that the drainage characteristics of the terrain results in the occurrence of peak discharge soon after the rainfall. The drainage basin soil characteristics is said to have relatively low value of permeability and this results in low infiltration rates into the soil. The rising limb of the hydrograph has a very steep rise while the receding limb was not as steep. The receding limb required more time to reach the base flow condition which justified the continued low water flow at very low rates as a result of infiltrated water. It took almost 22 hours to reach the peak flow condition and the receding limb needed 46 hours to attain the base flow state. The discharge rate in the river during rising limb, peak level and receding limb of the hydrograph are shown below. Discharge computed for the rising limb = Velocity  Depth of flow in river (for the rising limb)  width of flow = 4 m/s  0.49 m 15 m = 29.4 m3/sec Peak Discharge computed = Velocity  Depth of flow in river (for peak discharge)  width of flow = 4 m/s  0.658 m 15 m = 39.48 m3/sec Discharge computed for the receding limb = Velocity  Depth of flow in river (for the receding limb)  width of flow = 4 m/s  0.353 m 15 m = 21.18 m3/sec Thus the potential for flood is very high as there would be a sudden rise the discharge level of the river Cynon. Further, the level of water too recedes fast and hence a small detention facility to accommodate this rise in the river water would help to prevent the damage caused by the flood water. The basic concept adopted for controlling floods is through the methods of retention, detention and sedimentation. The excess runoff is stored in the reservoirs until the basin could accept this volume after the adequate quantities of water have receded. The total area of catchment for river Cynon is reported as 160 km2 which is subjected to different type of land uses. The total runoff (Q) from this area is computed using rational formula. The total height of the rainfall is estimated as 15.8 mm from the rainfall data available and the average value of the runoff coefficient is taken as 0.37 (Centre for ecology and hydrology, 2005). The runoff computed for an area of 160 km2 is 935,360 m3 . The rate of accumulation of this volume of water is determined for a basin lag time of 20 hours and is obtained as 46,768 m3/hour. While the rate of recovery is determined considering the duration of receding limb taken as 46 hours. The rate of recovery is obtained as 21,258.1 m3/hour. The huge difference between rate of accumulation and rate of recovery is due to the basin characteristics. 3.0 Selection of pump The pump is necessary to lift the storm water mechanically in the situations where it becomes physically impossible to drain the storm water by gravity systems alone, due to uneconomic nature of gravity systems due to length and depth of gravity systems, causes inundation of the neighborhood systems due to lack of capacity. Though the final design for pump is carried out as given below the final selection is made on the analysis of pump characteristics in discussion with the manufacturers of pump, contractors and energy utility companies etc who need to supply power to these installations (Hydraulic design manual, n.d.). The design of pump is undertaken based on the following information River width = 15 m ; Cross section of river : rectangular : Velocity ; 4 m/s. Diameter of intake pipe = 150 mm & Diameter of delivery pipe to open channel = 120 mm The maximum depth of flow = 0.658 m Open channel elevation is taken as 350 m. The head loss is computed for the intake portion as four times the velocity head and that from the point b to the open channel is taken as 15 times the velocity head. As discharge in the intake pipe from the river and delivery pipe to the open channel is constant , the discharge computed for the intake pipe is taken as the discharge for delivery pipe (Q = AV = 0.0750.0754 =0.071 m3/s) . Using this value of Q the velocity through the delivery pipe is determined as 6.25 m/s (0.071/ (0.060.06)). Using the velocities values the total head loss from the river to open channel is computed as 21.2 m. Thus the total head available from point P to point S is computed applying Bernoulli’s equation. The difference in elevation between the channel and river is 270 m (350 - 80 = 270 m) Vp2/2g + pp/ + zp + H = Vs2/2g + ps/ + zs + HL Or, 0 + 0 + 80 + H = 0 + 0 + 270 + 21.2 Or H = 211.2 m Figure 2 : Line diagram of river Cynon, pump and open channel. Required power output from pump in horsepower units (P) is given as P = QH/746, where the discharge Q is in m3/s,  is the unit weight of water taken as 9810 N/m3 and H is the head of water computed as 211.2 m. Thus , P = 0.071 9810 211.2/746 = 197.2 HP  200 H.P. It is proposed to install 200 H.P centrifugal pump as it’s more reliable , efficient and ease of maintenance under the prevailing conditions. 4.0 Open-Channel Design The design of the storm drain is usually undertaken using trail and error procedure. A proper design of the storm drainage system requires accumulation of basic hydrologic data, very close familiarity with the sites, a clear understanding on both the hydrologic and hydraulic parameters and drainage policy associated with the designs. The steps would with initial planning for a storm drain system which would be followed by its evaluation for technical, economical and physical acceptability. Based on the evaluations undertaken, necessary changes could be incorporated and the revised system could be analyzed and the process could be continued until acceptable design of the storm is arrived. The design of the channel cross section is undertaken by applying the Mannings formula. Given the the discharge of the river as Q m3/s, the suitable breadth b of the channel is determined as follows. The velocity of flow , v = ( R2/3S1/2 ) / N , where v is velocity (m/s); R is hydraulic radius (m); S is channel bed slope (m/m); and n is Manning’s roughness coefficient.. And the discharge Q shall be computed as = A  V . The data available for the calculation are as follows Discharge =1.2 m3/s , Mannings coefficient , n =0.014 , depth = 0.3 m, velocity =0.55 m/s and slope = 1/3000   The steps in computation are as follows 1. Compute the area of cross section (A) from known discharge (Q) and velocity (V). A = Q/V = 1.2 / 0.55 = 2.18 m2 R = (A/P) = (b d) / (2 d+b) d = 0.3 m and b = 7.76 m , R = (7.76 m Velocity, V = (R2/3S1/2) / n = (0.278)2/3(1/3000)1/2 / 0.014 or V = 0.42  0. 018 / 0.014 m/s = 0.54 m/s ; Q = VA = 0.54  2.28 = 1.23 m3/sec 5.0 Conclusions The conclusions drawn based on the hydrological analysis are as follows: (a) The hydrograph drawn for the river Cynon show a steeper rising limb than the receding limb leading to the accumulation of flood water in the river for a brief period of time. The sub surface condition of the catchment area and the nature of land use in the drainage basin contributed to the runoff pattern observed in the study. The lack of data have limited the investigation into the various factors that have yielded the observed characteristics. (b) The pump design and channel cross section was fixed based on the very limited extend of data supplied. The hydrological observation for only four days were available and based on this peak flow depth in the river was taken as 0.658. The pump chosen for pumping of the flood water was of centrifugal type of power having 200 HP. (c ) The cross section of the channel for carrying flood water was fixed as rectangular of following dimensions. Breath of the channel : 7.76 m Channel height : 0.3 m (d) The methodology followed in this design would be applied to similar type of storms occurring in the region. For suggesting long term and sustainable solutions for flood control in River Cynon, detailed analysis using data collected for significant period of time shall be undertaken using probabilistic techniques like Gumbel or log Pearson type III methods. References Centre for Ecology and Hydrology (CEH). 2005. 57004 – Cynon at Abercynon [online]. [Accessed 17th April 2009]. Available at [22 April 2009] Geobytesgcse (n.d.), Hydrographs and river discharge [Online] Available at [16 April 2009] Witpress.com (n.d.) Optimal unit hydrogrpah , [Online] Available at [17 April 2009] Flood hydrograph (n.d.) [Online] Available at [17 April 2009] Design Hydrographs (n.d.), [Online] Available at < http://www.egr.msu.edu/~northco2/BE481/SCShydrograph.htm> [18 April 2009] Hydraulic design manual (n.d.), [Online] Available at [18 April 2009] Annexure I – Flood volume computation for River Cynon Time (hours) Rainfall (mm) River Height (m) 10 hr average Volume (m3) 1 0 0.283 0.273 587520 2 0 0.28 3 0 0.277 4 0 0.275 5 0 0.272 6 0 0.271 7 0 0.269 8 0 0.268 9 0 0.267 10 0 0.266 11 0 0.266 0.261 561600 12 0 0.265 13 0 0.264 14 0 0.263 15 0 0.261 16 0 0.26 17 0 0.258 18 0 0.257 19 0 0.256 20 0 0.255 21 0 0.255 0.252 542160 22 0 0.255 23 0 0.253 24 0 0.252 25 0 0.251 26 0 0.251 27 0 0.251 28 0 0.25 29 0.2 0.249 30 0.2 0.249 31 0.4 0.249 0.256 552960 32 0.2 0.25 33 0.4 0.251 34 0.6 0.252 35 0.8 0.253 36 1.2 0.256 37 0.6 0.258 38 0.6 0.259 39 0.4 0.265 40 0.6 0.27 41 0.6 0.271 0.335 721440 42 0.4 0.273 43 0.2 0.279 44 0.4 0.34 45 0.6 0.356 46 1.2 0.361 47 0.2 0.366 48 0.8 0.363 49 1 0.366 50 1 0.373 51 1 0.398 0.563 1213920 52 0.2 0.432 53 0.4 0.49 54 0.6 0.538 55 0.2 0.588 56 0.4 0.612 57 0.2 0.653 58 0.2 0.658 59 0 0.642 60 0 0.617 61 0 0.588 0.486 1049760 62 0 0.557 63 0 0.528 64 0 0.504 65 0 0.483 66 0 0.467 67 0 0.453 68 0 0.439 69 0 0.429 70 0 0.416 71 0 0.407 0.372 801360 72 0 0.399 73 0 0.389 74 0 0.381 75 0 0.373 76 0 0.366 77 0 0.359 78 0 0.353 79 0 0.349 80 0 0.343 81 0 0.34 0.328 708480 82 0 0.337 83 0 0.334 84 0 0.333 85 0 0.329 86 0 0.326 87 0 0.324 88 0 0.322 89 0 0.32 90 0 0.318 91 0 0.316 0.311 602640 92 0 0.313 93 0 0.312 94 0 0.31 95 0 0.308 96 0 0.306       Total volume (m3) 7341840       Read More
Cite this document
  • APA
  • MLA
  • CHICAGO
(Storm Drainage Project Report Example | Topics and Well Written Essays - 1750 words - 3, n.d.)
Storm Drainage Project Report Example | Topics and Well Written Essays - 1750 words - 3. https://studentshare.org/design-technology/1553771-storm-drainage-design-project
(Storm Drainage Project Report Example | Topics and Well Written Essays - 1750 Words - 3)
Storm Drainage Project Report Example | Topics and Well Written Essays - 1750 Words - 3. https://studentshare.org/design-technology/1553771-storm-drainage-design-project.
“Storm Drainage Project Report Example | Topics and Well Written Essays - 1750 Words - 3”. https://studentshare.org/design-technology/1553771-storm-drainage-design-project.
  • Cited: 0 times

CHECK THESE SAMPLES OF Storm Drainage Project

Storm Drainage Design

Usually, in the study of storm drainage, the analysis of hydrographs are considered.... n the study of storm drainage, the analysis of hydrographs are important.... The vegetation type and the steepness of the surrounding lands, with the drainage density(Stott,2005)....
5 Pages (1250 words) Essay

Storm Drainage Design

In the study of storm drainage design, we will be able to learn the functions of hydrographs in the design of open channels and reservoir.... A hydrograph is a graph, either a bar graph or a line graph.... A line graph is normally used to plot the discharge of water over the time, while a bar graph is the rise of water in the river over the function of time....
8 Pages (2000 words) Essay

Storm Drainage Design Project

The paper "storm drainage Design Project" tells us about hydrograph.... fast overland flow is observed with a higher drainage density.... The storm flow is called the total of the overland flow and the through flow.... The basic factors that affect hydrographs will also be learned and why do we have to study hydrographs....
6 Pages (1500 words) Assignment

Storm Drainage Design Project: Scientific Methods

The writer of this assignment seeks to comparatively analyze the potential solutions to designing a storm drainage system for flooding situations.... raphs that show how a drainage basin responds to a period of rainfall.... To understand more on the subject at hand, we first define what is a storm and a hydrograph.... According to Wikipedia, a storm is any disturbed state of an astronomical body's atmosphere, especially affecting its surface, and strongly implying severe weather....
5 Pages (1250 words) Assignment

Storm Drainage Design Project

The paper "storm drainage Design Project" tells us about peak rainfall and peak discharge.... A rapid overland flow is observed with a higher drainage density.... nbsp;Lag time is the term for the difference betseen the peak rainfall from the peak discharge.... There is less chance of flooding if the lag time is great....
6 Pages (1500 words) Assignment

Storm Drainage Design Project

The paper "storm drainage Design Project" tells us about the concept of studying and controlling the behavior of rivers.... First, the characteristics of the basin refer to its physical attributes such as area, topography (in particular, drainage density directly proportionate to the number of tributaries), geometry, geology (of its underlying soil and bedrock), presence of vegetation, and its initial conditions.... A storm hydrograph in particular “....
7 Pages (1750 words) Assignment

Storm Drainage Design Project

The paper "storm drainage Design Project" highlights that the rate of accrual of floodwater into the river is much faster than the rate of discharge.... Hence, to guard against adverse repercussions due to flooding, the possibility of adopting drainage by pumping to an open channel.... m occurring after 7 hours of a storm, a second peak occurred after another 10 hours....
9 Pages (2250 words) Case Study

Storm Drainage Design Project

This paper "storm drainage Design Project" discusses the effects of different land management practices on water economy of drainage areas.... It is necessary that the stream-hydrograph that is obtained from drainage areas be separated into ground-water flow.... The improvement of the present methods and the development of new methods for the differentiating ground-water run-off and the surface run-off has been specifically pointed out as one of the deficiencies in hydrologic precipitation and other measurements that are essential to watershed studies are obtained from drainage areas that are supporting continuous streamflow and ranging in size....
7 Pages (1750 words) Case Study
sponsored ads
We use cookies to create the best experience for you. Keep on browsing if you are OK with that, or find out how to manage cookies.
Contact Us