StudentShare
Contact Us
Sign In / Sign Up for FREE
Search
Go to advanced search...
Free

Storm Drainage Design Project - Case Study Example

Cite this document
Summary
The paper "Storm Drainage Design Project" highlights that the rate of accrual of floodwater into the river is much faster than the rate of discharge. Hence, to guard against adverse repercussions due to flooding, the possibility of adopting drainage by pumping to an open channel…
Download full paper File format: .doc, available for editing
GRAB THE BEST PAPER93.9% of users find it useful
Storm Drainage Design Project
Read Text Preview

Extract of sample "Storm Drainage Design Project"

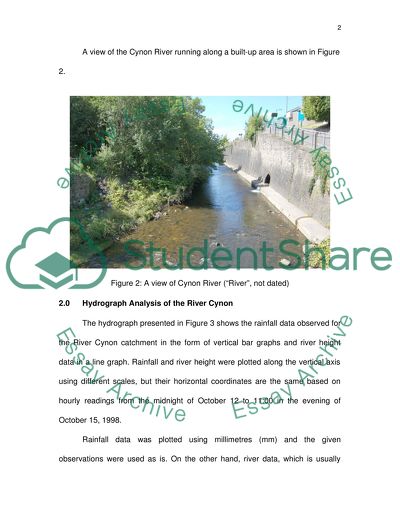
Storm Drainage Design Project: River Cynon 0 Introduction River Cynon in South Wales is part of the England and Wales river system. As shown in Figure 1, the River Cynon is joined by River Dare near Aberdare, River Aman near Cwamaman and River Pennar midway between Mountain Ash and Abercwmboi. River Cynon originates from Hirwaun in the north and terminates at Abercynon in the southern end. Figure 1: Cynon River A view of the Cynon River running along a built-up area is shown in Figure 2. Figure 2: A view of Cynon River (“River”, not dated) 2.0 Hydrograph Analysis of the River Cynon The hydrograph presented in Figure 3 shows the rainfall data observed for the River Cynon catchment in the form of vertical bar graphs and river height data in a line graph. Rainfall and river height were plotted along the vertical axis using different scales, but their horizontal coordinates are the same based on hourly readings from the midnight of October 12 to 11:00 in the evening of October 15, 1998. Rainfall data was plotted using millimetres (mm) and the given observations were used as is. On the other hand, river data, which is usually plotted as a discharge in a unit of volume against time (cubic meters per second or liters per second) is drawn as a function of the given river width (B) and the velocity (V) of flow of the river (since discharge is a product of area and water flow velocity in this case) per hour of observation. The highest point (peak) of the blue line graph is 0.658 meter-BV per hour. The scale used was 1 x 10⁻¹ m, such that 0.658 is represented as 6.58 x 10⁻¹ m. This should explain why the highest number in the vertical axis is 7. Figure 3: River Cynon hydrograph (Oct. 12-15, 1998). It may be gleaned from Figure 3 that although observations were plotted every hour, the time markers were presented every three hours due to space limitations.). However, the data were analyzed using the original values and units of the river level per hour of observation. The basic elements of a storm hydrograph is presented in Figure 4 with the rising limb, peak and recession limb of the Cynon River flood from the available observation data. Figure 4: Hydrograph with the basic elements identified Prior to the rainfall in 4:00 on October 13, the average reading of the river height from the start of given observations for 28 consecutive hourly readings is 0.262 mm. This will be the basis of the base flow. After seven hours of rainfall, the first peak was observed at 11:00 of October 13 with a height of 1.2 mm. This marks the initiation of the rising limb of the river flood where the height of the river also started to rise compared to base flow. The rainfall data had twin peaks, with the second peak occurring at 21:00 of October or 10 hours after the first rainfall peak was observed. At 9:00 of October 14, 12 hours after the second peak of the rainfall, the peak flow of the river was recorded at 0.658 m. The basin lag time measured from the initial peak of the rainfall level to the peak river flow is 22 hours. The total water accumulated in the rising limb (Qrise) of the river hydrograph is: Qrise = V x htotal x B = 4 m/s x 2.999 m x 15 m Qrise = 179.94 m3/s where : V = given velocity of River Cynon in the project assignment brief (4 m/s) htotal = summation of the difference in river height observation and the average base flow height established in the previous page as 0.262 m. B = given base width of River Cynon in the project assignment brief (15 m) The amount of time for the peak flow to return back to base flow or base flow time is 46 hours. Several factors which influence the characteristics of storm or rainfall hydrographs, and which in turn affect the amount of run-off have been described from the literature reviewed. Bell (2004) stated that the total run-off which may be expected from a catchment area is a result of direct precipitation on the stream channel, surface run-off, interflow and baseflow. The Cynon River catchment area is 160 sq. km (Environment Agency Wales, 2005). According to land use data for the catchment of River Cynon, only 0.2 % of the area is composed of inland water, or about 32 square km. Taking the cue from Bell (2004), since “direct precipitation onto water surfaces and into stream channels normally represents only a small fraction of the total volume of water flowing in streams … this components is usually ignored in run-off computations” (p. 576). Surface run-off is a major component of flood peak and discharges during a rainstorm. This is made up of interflow which may account to up to about 85% of the total run-off, depending on the permeability of the soil in the catchment (Bell, 2004). In the case of the River Cynon catchment, 65.5% of the soil is granular and of moderate permeability, 5.8% is fissured and of moderate permeability, 27% has mixed permeability and 1.7% has very low permeability (British Geological Society, 2005a). Run-off from interflow will definitely be much less than 85%, perhaps around 40%. Among the three remaining contributors to total run-off, baseflow has already been established to be 0.262 m; only the percentage of probable run-off from interflow can be estimated based on available data, but surface run-off may be readily computed from the land use characteristics and theoretical run-off coefficients from Lee and Lin (2007). Table 1: Computation of average run-off coefficient (British Geological Society, 2005b; Lee and Lin, 2007) Land use Percentage Run-off Coefficients2 Grassland Woodland Mountain, heath, bog Built-up areas Arable and horticulture Water (inland)1 48.0 22.1 14.4 12.5 2.8 (0.2) 0.30 0.15 0.65 0.50 0.55 - 99.81 0.349 Average run-off coefficient 1 Water (inland) was regarded from the computations because this contributes to interflow and not to surface run-off; 2 Coefficients used were for rolling area (slope range is 2 – 10%) since the actual slope in the river area is 1:20 (or 5%) The amount of surface run-off from the River Cynon catchment area and rainfall data observations given 884,800 cubic meters. The basis of this surface run-off volume (Rs) is as follows: Rs = area of catchment * total height of precipitation * average run-off coefficient Rs = (160 km2) (15.8 mm) (0.349); or Rs = (160 x 106 m2) (0.0158 m) (0.349) Rs= 882,272 m3 Basin lag time from the hydrograph in Figure 4 is 22 hours, while the recovery time back to baseflow is 46 hours, although at the end of the observations at 23:00 of Oct. 15, river height is 0.306 (still greater than 0.262, the average baseflow before the precipitation). The rate of accrual of the river flood is 40,103.27 m3/hr. Meanwhile, rate of recovery rate back to baseflow is much lesser at 19,179.83 m3/hr. The slope of the catchment, the permeability of the surface, the area of catchment, and the geological characteristics of the area all contributed to the big difference between the rate of accumulation and slow discharge of the flood water. The volume of water during peak flow and the slow recovery rate back to base flow, both support the proposition of draining the flood waters using a pump which will convey the water to an open channel. As envisioned the open channel will feed water for storage in another reservoir. 3.0 Design of Open Channel and Pump Power Requirement 3.1 Assumptions and design criteria 3.1.1. Head loss from the river to a point A in the pump is thrice that of the head due to velocity in the 150-mm diameter () pipe, while the head loss from the pump to the open channel is 20 times the head due to velocity in the 100-mm  pipe. 3.1.2. The 150-mm  pipe and the 100-mm  pipe will be galvanized steel with an average roughness coefficient (n) of 0.016 (Forrester, 2001). 3.1.3. For the open channel, the material is assumed to be unpolished concrete whose estimated roughness coefficient is 0.014 (Liu, 2003). 3.1.4. As indicated in the brief for the project assignment, the river is to be 15 m wide with a velocity of m/s flowing in a rectangular cross section. 3.1.5. The pipe which will transport flood water from River Cynon to the pump will be laid out at an elevation of 80.8 m, the lowest elevation in the catchment area of the river based on data from the Centre for Ecology and Hydrology - Wallingford (2005). This pipe is to have a diameter of 150 mm. 3.1.6. The pipe which will convey water from the pump to the open channel will have a diameter of 100 mm. 3.1.7. The open channel will be positioned in a suitable location in the catchment area at an elevation of 300 m. The basis of this elevation is the mid-value of the elevation range which constitutes the largest proportion of the catchment or 31% of the 160 sq km area (CEH- Wallingford, 2005). 3.1.8. A centrifugal pump will be used. This type of pump is the most commonly used among the various types of pump and possesses many desirable features (Karassik, Messina, Cooper and Heald, 2001). 3.1.8.1. Among the advantages of the centrifugal pump over other types are: (1) its simple design which allows for a wide range of capacities and applications; (2) ease of operation and maintenance; (3) longer operating life; (4) designed with a self-limited pressure capacity; (5) adaptability for high speed drive systems; (6) has fewer moving parts in each design which lends itself to easy maintenance small space requirements (Spellman and Drinan, 2001). 3.1.8.2. It has only few disadvantages: (1) needs additional equipment for priming; (2) performance is affected by air leaks on the suction side; (3) offers a narrow range of efficiency (Spellman and Drinan, 2001). 3.2. Limitations of the design 3.3.1. The design velocity from the river is given as 4 m/s, which may not really be the actual mean velocity of the river flooding. 3.3.2. The lengths of the pipes can not be determined since there is no given data of specific distances in the course of the river. Hence, friction losses in the pipes were not considered. Instead location of the open channel were specified in terms of elevation. 3.3. Diagram 3.4. Computations Following are the computations and pertinent discussion: Since it was given in the assignment brief that the velocity of river flow is 4 m/s, the velocity of water on the 150 mm pipe (V1) is 4 m/s. From the formula, Q = VA, the discharge volume from the river is 0.071 m3/s. The velocity of water from the pump to the open channel or the velocity of water in the 100 mm pipe (V2) is computed from the same formula, with Q = 0.071 m3/s. V2 is 9 m/s. 3.1. Head loss from A to B (HL): HL = 3(4)2/2(9.81) + 20(9)2/2(9.81) = 85.015 m. 3.2. Energy added with the use of pump (E) : Using Bernoulli’s equation, V12/2g + p1/ + z1 + E = V22/2g + p2/ + z2 + HL 0 + 0 + 80.8 + E = 0 + 0 + (300 – 80.8) + 85.015 E = 223.415 m 3.3 Required horsepower output from pump (P): In the following formula, Q is the discharge from the river (0.071 m3/s), W is the unit weight of water (9810 N/m3) and E is the added energy head by virtue of the pump between points A and B (223.415). P = Q*W*E/746 P = 0.071(9810)(223.415)/746 P = 208.59  210 horsepower 3.4. Wetted perimeter of the open channel (P) given that the velocity of flow going to the open channel, V2 = 9 m3/s, the roughness coefficient, n = 0.014 and the slope, S = 0.05: Using Manning’s formula: From V = 1/n (R)2/3 (S)1/2 9 = (1/0.014) (R)2/3 (0.05)1/2 ; R = 0.423 The height of rectangular open channel (h) for most efficient design is twice of the hydraulic radius. R = h/2, or h = R(2) = 0.423(2) = 0.846 or 0.85 m. The width of base of the open channel (B) for most efficient design is twice the height (h). B = 2h B = 2(0.85) = 1.70 m. Therefore, the wetted perimeter for a rectangular section P is: P = 1.70 + 0.85 + 0.85 = 3.4 m. 4.0 Conclusions In the light of the findings from the hydrograph analysis and the result of computations, the following conclusions were drawn: 4.1 The peak rainfall height is 1.2 m occurring after 7 hours of storm, a second peak occurred after another 10 hours. The peak flow of the river flood was reached after 22 hours of rainfall. Return to baseflow was observed after 46 hours. The lesser rate of recovery may be explained by a comparatively shallow receding limb compared to a steep rising limb. 4.2 The rate of accrual of flood water into the river is much faster than the rate of discharge. Hence, to guard against adverse repercussions due to flooding, the possibility of adopting drainage by pumping to an open channel which will divert river flood flow to a storage reservoir may be explored. However, rainfall and river height figures should be based from a much longer period of observation. 4.3 Based on project assignment data values, a pump with at least 210 horsepower may be used. 4.4 For most efficient design, a rectangular open channel may be used with a base width of 1.70 m and a height greater than 0.85 m. 4.5. If an actual drainage project similar to the assignment is to be undertaken, the design should consider hydrologic and hydraulic uncertainties which were the main limitations of this theoretical design project. Considering probability distributions as implied in Marsalek (2000) will be extremely useful for a more dependable storage capacity. 5.0 References Bell, F. G. 2004. Engineering Geology and Construction. London: Spon Press. British Geological Society, 2005a. 57004 – Cynon at Abercynon: Land use [online]. [Accessed 21st April 2009]. Available from the World Wide Web: http://www.nwl.ac.uk/ih/nrfa/spatialinfo/LandUse/landuse057004.html British Geological Society. 2005b. Geology [online]. [Accessed 21st April 2009]. Available from the World Wide Web: http://www.nwl.ac.uk/ih/nrfa/spatialinfo/Geology/geology057004.html Centre for Ecology and Hydrology (CEH). 2005. 57004 – Cynon at Abercynon [online]. [Accessed 17th April 2009]. Available from the World Wide Web: http://www.nwl.ac.uk/ih/nrfa/station_summaries/057/004.html CEH - Wallingford. 2005. Elevation [online]. [Accessed 20h April 2009]. Available from the World Wide Web: http://www.nwl.ac.uk/ih/nrfa/spatialinfo/Elevation/elevation057004.html Environment Agency Wales. 2005. Concise register of gauging stations [online]. [Accessed 20th April 2009]. Available from the World Wide Web: http://www.nwl.ac.uk/ih/nrfa/station_summaries/op/EA-Wales1.html Forrester, K. 2001. Subsurface Drainage for Slope Stabilization. Reston, VA: American Society of Civil Engineers [ASCE] Press. Karassik, I. J., Messina, J. P., Cooper, P. and Heald, C. C. 2001. Pump Handbook. 3rd ed. New York: McGraw-Hill Professional. Lee, C. C. & Lin, S. D. eds. 2007. Handbook of Environmental Engineering Calculations. New York: McGraw-Hill Professional. Liu, H. 2003. Pipeline Engineering. Boca Raton, FL: Lewis Publishers. Marsalek, J., Watt, W. E., Zeman, E., and Sieker, F. eds. 2000. Flood Issues in Contemporary Water Management. Dordrecht, The Netherlands: Kluwer Academic Publishers River Cynon. not dated. [online]. [Accessed 19th April 2009]. Available from the World Wide Web: : http://www.welshicons.org.uk/html/river_cynon.php. Spellman, F. R. & Drinan, J. (2001). Water Hydraulics. Lancaster, PA: Technomic Publishing Company, Inc. Read More
Cite this document
  • APA
  • MLA
  • CHICAGO
(Storm Drainage Design Project Case Study Example | Topics and Well Written Essays - 2000 words - 1, n.d.)
Storm Drainage Design Project Case Study Example | Topics and Well Written Essays - 2000 words - 1. https://studentshare.org/geography/1553865-storm-drainage-design-project
(Storm Drainage Design Project Case Study Example | Topics and Well Written Essays - 2000 Words - 1)
Storm Drainage Design Project Case Study Example | Topics and Well Written Essays - 2000 Words - 1. https://studentshare.org/geography/1553865-storm-drainage-design-project.
“Storm Drainage Design Project Case Study Example | Topics and Well Written Essays - 2000 Words - 1”. https://studentshare.org/geography/1553865-storm-drainage-design-project.
  • Cited: 0 times

CHECK THESE SAMPLES OF Storm Drainage Design Project

Storm Drainage Design

The paper “storm drainage design” seeks to evaluate hydrographs, which are graphs which represent the relation of the height and discharge of water in rivers over a certain period of time.... n the computations of the design of the open channel and the river, or the water source for a reservoir.... First, we must set conditions for the design criteria.... omputations of the Channel design With the given data below, it is required that we get the value of breadth b of an open channel using the Manning's Formula....
8 Pages (2000 words) Research Proposal

Storm Drainage Design

Usually, in the study of storm drainage, the analysis of hydrographs are considered.... n the study of storm drainage, the analysis of hydrographs are important.... Hence water from the river can be useful if we know how to make a design that is truly fruitful to end users.... The vegetation type and the steepness of the surrounding lands, with the drainage density(Stott,2005)....
5 Pages (1250 words) Essay

Storm Drainage Design

In the study of storm drainage design, we will be able to learn the functions of hydrographs in the design of open channels and reservoir.... omputationsBy the application of the Manning's Formula, we will be able to get the value of breadth b of the open channel with the following dataChannel design Given Data Q = 1....
8 Pages (2000 words) Essay

Storm Drainage Design Project: Scientific Methods

The writer of this assignment seeks to comparatively analyze the potential solutions to designing a storm drainage system for flooding situations.... This information is then used in the design of flood control facilities.... raphs that show how a drainage basin responds to a period of rainfall.... To understand more on the subject at hand, we first define what is a storm and a hydrograph.... According to Wikipedia, a storm is any disturbed state of an astronomical body's atmosphere, especially affecting its surface, and strongly implying severe weather....
5 Pages (1250 words) Assignment

Storm Drainage Design Project

The base lag refers to the time repose of the river with respect to a rainfall which signifies the drainage potential of the catchments.... The properly constructed hydrograph would be able to considerable amount of information of the behaviour of drainage basin with respect to a rainfall.... The hydrograph hence plotted is shown in figure 1 and provides the detailed information on the drainage characteristics of the basin.... When the discharge of the river versus the time is plotted a storm hydrograph is obtained (Geobytesgcse, n....
6 Pages (1500 words) Essay

Storm Drainage Design Project and Flooding

The main objective of the assignment "Storm Drainage Design Project and Flooding" is to develop a storm drain system.... The project involves the accumulation of basic data, the familiarity with the site and the basic understanding of the hydrologic and the hydraulic principles and the drainage policy.... Engineering design will be based on specified probability storm and the runoff generated by catchments In the hydrographs of Cynon River, there was an almost steady flow of water in the river for the first 40 hours....
5 Pages (1250 words) Assignment

Storm Drainage Design Project Analysis

In our study of storm drainage, the study of hydrographs and their analyses are to be taken into account.... hellip; Hydrographs are records for the study of storm drainage.... Channel design Given data are: Apply the Manning formula to design a suitable breadth b, with Q = 1....
5 Pages (1250 words) Essay

A Hydrograph of River Cynon and Design of an Open Channel

This paper "A Hydrograph of River Cynon and design of an Open Channel" focuses on the fact that River Cynon is geographically located in South Wales and stretches from Hirwaun to Abercynon as a major tributary of the River Taff.... The river has a catchment area of 160 square kilometres....
9 Pages (2250 words) Report
sponsored ads
We use cookies to create the best experience for you. Keep on browsing if you are OK with that, or find out how to manage cookies.
Contact Us