StudentShare
Contact Us
Sign In / Sign Up for FREE
Search
Go to advanced search...
Free

Influence of City Form and Structure on Individual Travel Patterns - Essay Example

Cite this document
Summary
The essay "Influence of City Form and Structure of the City on Individual Travel Patterns" focuses on the critical, and thorough analysis of how far does the form and structure of the city together with its transport network influence individual travel patterns…
Download full paper File format: .doc, available for editing
GRAB THE BEST PAPER91.4% of users find it useful
Influence of City Form and Structure on Individual Travel Patterns
Read Text Preview

Extract of sample "Influence of City Form and Structure on Individual Travel Patterns"

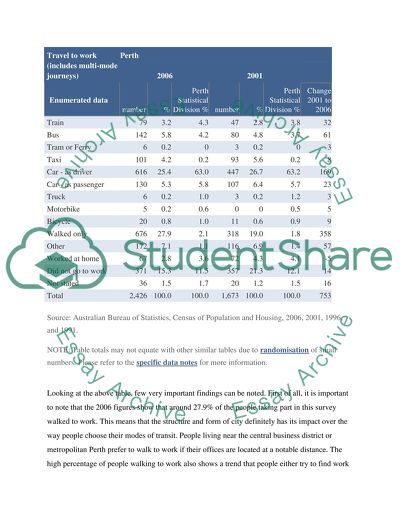
?“How far does the form and structure of the together with its transport network influence individual travel patterns? Discuss in the context ofdifferent types of areas within metropolitan Perth.” Introduction: Perth, Western Australia is one of the most densely populated regions of the continent. Perth is the capital of Western Australian province. Perth is located by the side of River Swan. The total population of Perth is more than 1,700,000. Like most of the densely populated cities in the developed world, Perth has a very well developed and well planned public transport system. Majority of the people in Perth use ferries, buses and trains as their chosen mode of transport. Transperth is the organization which supervises this public transport and the routes, while Transwa provides routes to the rural and sub urban area around Perth. Public transport Authority operates Transperth. The mode of transit only includes ferries, busses and trains, as mentioned earlier. This brand, Transperth, was launched in 1986. Although the control was initially under Metropolitan transport trust, and Western Australian government railways, it was later transferred to Department of transport, in 1993. Perth is divided into 9 fare zones. These zones are created keeping the distance of a place from the city centre in mind. All three transit services offered by Transperth cover Perth city up to Wundowie in the East of the city, to Fremantle in the west, up to Mandurah in the south and up to Two Rocks in the north of Perth City. The central business district of Perth has 15 bus stations and 70 railway stations. The time tables are color coded and thus the routes are easier to understand once a person understands the color codes. City centre is a Free Transit zone, where one does not need to pay a fare to travel. Overall, the transport infra structure in Pert is well developed. Keeping the growth of population in mind, the government has planned forward to accommodate the future requirements. Modes of transit most frequently used in Perth: It is a fact that the form and structure of the city together with its transport network influence individual travel patterns. Travel to work (includes multi-mode journeys) Perth 2006 2001 Enumerated data number % Perth Statistical Division % number % Perth Statistical Division % Change 2001 to 2006 Train 79 3.2 4.3 47 2.8 3.8 32 Bus 142 5.8 4.2 80 4.8 3.7 61 Tram or Ferry 6 0.2 0 3 0.2 0 3 Taxi 101 4.2 0.2 93 5.6 0.2 8 Car - as driver 616 25.4 63.0 447 26.7 63.2 169 Car - as passenger 130 5.3 5.8 107 6.4 5.7 23 Truck 6 0.2 1.0 3 0.2 1.2 3 Motorbike 5 0.2 0.6 0 0 0.5 5 Bicycle 20 0.8 1.0 11 0.6 0.9 9 Walked only 676 27.9 2.1 318 19.0 1.8 358 Other 172 7.1 1.1 116 6.9 1.4 57 Worked at home 67 2.8 3.6 72 4.3 4.1 -5 Did not go to work 371 15.3 11.5 357 21.3 12.1 14 Not stated 36 1.5 1.7 20 1.2 1.5 16 Total 2,426 100.0 100.0 1,673 100.0 100.0 753 Source: Australian Bureau of Statistics, Census of Population and Housing, 2006, 2001, 1996, and 1991. NOTE: Table totals may not equate with other similar tables due to randomisation of small numbers. Please refer to the specific data notes for more information. Looking at the above table, few very important findings can be noted. First of all, it is important to note that the 2006 figures show that around 27.9% of the people taking part in this survey walked to work. This means that the structure and form of city definitely has its impact over the way people choose their modes of transit. People living near the central business district or metropolitan Perth prefer to walk to work if their offices are located at a notable distance. The high percentage of people walking to work also shows a trend that people either try to find work at some place close to their residence, or they shift to reside at some place close to their work place. Another important aspect clearly visible from this table is that the trend of using own cars for going to work is on the rise. This is because of the fact that people are generally busier now, and also, that due to the increase in number of vehicles on the road and due to the increased distances everyone has to travel each day, driving one’s own car to work seems like a quicker solution. Looking at the figures of Tram, Bus and ferry usage as mode of transit in 2006 and 2001, it is obvious that all these modes of transit are popular amongst people. With the efforts made by the planners, more and more people are now using these modes of transit to go to work. As shown in the table, in the year 2001, 2.8% people taking part in the survey used trains as their primary mode of transit, while in 2006, the figures rose to 3.2%. Similarly, in 2001, 4.8% people used buses as their primary mode of transit while in 2006, the percentage rose to 5.8%. The percentage of people using ferry as major mode of transit is at 0.2% in both cases. The above discussion has shown that people in Perth have started relying heavily on the use of personal cars as the mode of transit, which is not always a very healthy choice. It is important that a well coordinated plan is brought in place to promote healthier modes of transport for people. Socio-demographic perspective: Structure of the city, demographics, population pressure and economic conditions, each one of these factors play a very important role in the selection of mode of transport for general public (Cervero and Kochelman, 1997). The transport mode chosen by majority of people is not out of choice. It is due to certain factors which make that particular mode the best choice for a person. The following tables will help in understanding this point. Individual income quartile definitions (Annual income ranges)   2006 2001 1996 1991 Lowest group Nil to $11,407 Nil to $9,313 Nil to $7,667 Nil to $6,347 Medium lowest $11,408 to $26,354 $9,314 to $19,756 $7,668 to $15,967 $6,348 to $13,575 Medium highest $26,355 to $49,014 $19,757 to $36,175 $15,968 to $29,579 $13,576 to $24,668 Highest group $49,015 and over $36,176 and over $29,580 and over $24,669 and over Individual income quartiles (persons aged 15 and over) City of Perth 2006 2001 Enumerated data number % Perth Statistical Division % number % Perth Statistical Division % Change 2001 to 2006 Lowest group 2,548 22.6 25.0 2,050 23.9 25.0 498 Medium lowest 1,904 16.9 25.0 1,869 21.8 25.0 35 Medium highest 2,175 19.3 25.0 1,451 16.9 25.0 724 Highest group 4,631 41.1 25.0 3,201 37.3 25.0 1,431 Total 11,257 100.0 100.0 8,570 100.0 100.0 2,687 Source: Australian Bureau of Statistics, Census of Population and Housing, 2006, 2001, 1996, and 1991. Looking at these tables, it can be seen that in general, people’s income has grown from 2001 to 2006. From 37.3% people in the highest income group in 2001, 41.1% people were in the highest income group in 2006. Medium highest class has also grown in size from 16.9% in 2001 to 19.3% in 2006. Lowest income group has decreased from 21.8% in 2001 to 16.9 and the lowest income group has also reduced from 23.9% in 2001 to 22.6% in 2006. With the increase in income of general people, trend has shifted from the use of buses, trams and ferries to personal cars. However, due to the increase in facilities the public transport system offers and due to the addition of routes in trains transport system, there is a rise in the use of these transit modes as well. To understand the pattern of transport use in Perth, it is important to look at the population figures in Perth. The following graphs and the table gives a clear insight. Estimated resident population, City of Perth (Preliminary updated estimates based on 2006 Census data) Annual change Year (ending June 30) number number Percent (%) 2010 17,955 866 5.1 2009 17,089 1,936 12.8 2008 15,153 1,518 11.1 2007 13,635 1,179 9.5 2006 12,456 1,191 10.6 2005 11,265 1,337 13.5 2004 9,928 955 10.6 2003 8,973 520 6.2 2002 8,453 765 10.0 2001 7,688 -- -- Source: Australian Bureau of Statistics, Cat. No. 3218.0 - Regional Population Growth, Australia, 2009 'Preliminary' refers to preliminary figures that may be subject to revision. All other figures are final. The above graphs and the table show that population in Perth is on a rise, and immigration is playing a very important role in the rise of population in Perth. It is not only the natural growth in population, but also immigration that is playing a major role in this growth, and thus resulting in added pressure on the existing public transport system. Factors affecting people’s travel pattern: There are many factors that affect the choice of mode of transport and travel pattern of people in Perth and in other metropolitan cities of the world. Some of these are as follows: A very important factor in making one’s transport mode decision is the cost involved, and economic stability of the person who has to travel. If someone belongs to lower income group and does not have personal car, the choice of driving his or her own car to work is removed from the list automatically. Income group and resources at one’s disposal thus play an important role in this selection (Cervero and Radisch, 1996). Distance is another important factor. If one’s work place is located at a distance of one hour drive from home, majority of people will prefer going through bus or train as driving for two hours daily in the rush hours might add to their daily work. However, some people might go against this logic and prefer driving for the same reason that they do not want to sit in a bus for two hours a day. Number of cars in a house hold also has an important place in this decision. If a family in Perth owns one car, and Husband and wife have to travel in different directions, and the kids are also to go to school, they all might end up using public transport rather than driving their own car. It might be costly, and also it might not be able to serve the purpose considering the fact that everyone in the family might need to entirely different direction. Thus the selection of mode of transit will be more dependent on the situation than personal choice (Curtis and Tiwari, 2008) Infrastructure perspective-Accessibility of different areas in Perth: Infrastructure of a city and that of the public transit system in place in any city plays a very important role for the people to choose their preferred mode of transit. In case of Perth, the infra structure of the travel system is very strong. All parts of the city are covered with well designed routes, which offer the residents of Perth a quick and less costly and also environment friendly travel from and to their work places. Infrastructure of the city and the arrangement of residential areas in the city also have an impact on the choice of mode of transport in Perth. Number of new dwellings approved, City of Perth Annual change* Year (ending June 30) Separate dwellings Other dwellings Total dwellings Separate dwellings Other dwellings Total dwellings 2010-11 0 129 129 -4 -385 -389 2009-10 4 514 518 2 208 210 2008-09 2 306 308 1 -1,681 -1,680 2007-08 1 1,987 1,988 -7 1,072 1,065 2006-07 8 915 923 -1 238 237 2005-06 9 677 686 -4 -117 -121 2004-05 13 794 807 9 433 442 2003-04 4 361 365 -24 -170 -194 2002-03 28 531 559 1 170 171 2001-02 27 361 388 3 -379 -376 2000-01 24 740 764 -15 47 32 1999-00 39 693 732 -42 145 103 1998-99 81 548 629 20 322 342 1997-98 61 226 287 49 41 90 1996-97 12 185 197 2 -179 -177 1995-96 10 364 374 -- -- -- Source: Australian Bureau of Statistics, Building Activity, Australia, (catalogue number: 8752.0 to 8752.7) Source: http://www.hot-map.com/images/tn/Stadtplan-Perth-5807.jpg Looking at the map of Perth, it becomes obvious that infrastructure this city offers due to natural features like river Swan or due to the road network is important in helping the people in making their mode of transit choice. Considering the information collected through the work shop and the field visits, there are two cases from Perth which will be discussed in detail here. Canning Bridge rail station and Bull Creek railway station will be considered in detail here. Canning Bridge Rail Station: Canning Bridge railway station is located in south Perth. It falls within the Kwinana freeway reserve. It is located in Fare Zone 1 at a distance of around 7.3 Kilometers from Perth station. It has two platforms with 2 sides architecture. It is an open station and can be accessed from Canning highway. Initially this station was built for buses only. When Mandurah railway lines were under construction, the freeway-level bus platforms gave their place to train platforms. The bridge was moved 9.5 meters to make space for the railway platforms. In urban development, transit oriented development has become a very important concept (Krizek, 2003). According to this concept, urban environments should be developed in a sustainable manner. It also states that businesses and amenities should be clustered around public transit stations. Also this concept promotes that public transit facilities should be created and planned in the way that facilitates general public thus bringing their interest towards walk, cycling and use of public transit system rather than going for the use of personal cars travel to work. It is long standing dream to have an 800 meters long catchment area, an area to attract customers and visitors around Canning Bridge Railway Station. The following plans are considered for this area. Since the residence around the proposed 800 meters area can be affected, the adjacent areas of Manning, Como, Applecross and Mt Pleasant are included in the plan. 1. As my research goes, currently Como and Manning have a housing compactness which can be said low or medium. If we observe the facts and figures of current decades, we will notice that landowners have divided the larger residential places into small units of three to five. This has caused to increase the boundaries along residential streets. There is additional traffic and areas of improvement at the moment and local authorities are trying to deal with it. 2. Moreover, it is likely that only non-Australian young professionals, serving in the industries of South Perth and Victoria Park will come over for jobs.These two areas are also favorite places for international students and teachers from universities as well as for FIFO workers. People living here do not depend much here on public transport as they can do without it for their work or daily living. The major problems in Manning and Como since the start of Southern Suburb rail line is the issue of street parking. The residents of the area are in real problem as they have inconvenience in reaching the main road. They are interrupted by the vehicles from the train station in the off-street parking .There is increase in panic and unsocial attitude. People accessing the station on foot also suffer from safety issues. The rest of two suburbs, Mt Pleasant and Applecros have old commercial buildings as their features. They are closer to Canning Highway and its bridge. There are congested residential structures built along Canning Highway and a large number of two or three storey houses on the river front. Some distances to cover. Big residential buildings have also been built. The people living in these houses are 35 to 45 years of age and work mostly in offices in Fremantle and Perth. But according to the map, majority of the houses are located outside the 800 meter long walk able area towards the Canning Bridge station. You can see that the population here uses private rides. It is because of their lifestyle but also because there are less The issues with other suburban area, Precinct are its unauthorized parking because of the rail station activity. It is a source of serious concern for the people of the area. The local community thinks that there is not enough parking to cater the needs of people. Besides, commercial use of areas and building has also caused this nuisance (Naess, 2005). Rebuilding Environmental setup and infrastructure The following points may be focused while taking into consideration the building forms of the plan The system or infrastructure of service must be examined deeply. It would include the study of communication system, underground power possibilities and water and sewerage system improvement. These guidelines are required for a steady and high quality development. The issues of plot ratios, residential thickness, resizing of communities, and laws about use of land and height limits for building shave to be dealt withTPS6 Amendment. Targets and motivational moves. Existing problems 1) The footpath does not have enough space to accommodate both cyclists and people on foot. 2) There is absence of bumper between the road and foot path and the traffic causes danger to pedestrians. 3) The little barrier on the bridge is not sufficient or secure for cyclists and people on foot. 4) It is highly inconvenient to get to the underground because the only way is at the lights. With the island and trafficaround you it is uncomfortable. The south side of Canning Road has no access to the station either. 5) The issue in short is about discomfort and inconvenience to most of the people. 6) Traffic noise is another annoying issue. Moreover there is no land to stop the buses for Passengers. Points for Discussion The overall choices and behavior of people is affected by the places and the attractions they offer. People are bound to use private rides because of their income level and age. Old people also do not use public vehicles. New development can bring about ease and comfort to the local lifestyle. Safety issues should be resolved. Demand of daily living and connectivity. Services like banks, hospitals can be made available in the area. Building Forms 1-lack of quality in building of paths, parking etc. 2 Road surfaces are uneven to use. 3.Lack of road sense and too much traffic 4.The cyclists can access the south of river. There are paths linked through underpass of Canning Bridge. The foot paths and links are there but cycling facilities are not available near school. The above discussion leads to the point that so many factors like safety and distances which influence where we want to travel and why. It is not our own choice. Bull Creek Railway Station is a busy railway station of Australia. It is located 11.7 km away from Perth in the city of Melville which is a local government area. The station It is located precisely in the Kiwnana Freeway median strip. It lies perpendicular to the Leach Highway interchange. The station started functioning on December23, 2007. The city of Bull Creek was named after a local, Henry Bull. There are multiple features that contribute to its fame. It offers integrated bus service that facilitates a large number of passengers. The Mandurah city of and Perth receive services of interurban Mandurah line. Architects of 'woodland' firm have designed this closed station. The trains travel throughout the country connecting Perth with the Southern Part. They have a 100km per hour speed limit which varies in Lakes of Road and central Perth. Facilities The transit-related development is due to the opening of Bull Creek Railway station. Leech Highway has been modified and changed to build the station. There are shared underpasses constructed for convenience of the commuters. Bus transfer facility is available with 10 bus stands and 14 bus routes. Other facilities include Transit guide booth that will guide you about routes and connections. Park and ride or incentive parking facility is also there. You can park your vehicles in the parking space and travel into city. Your vehicle will be stored in the car park and returned to you once you are back. The station also has 'pay and display' machines which are used to regulate parking in car parks. Problems Unlike most of the metropolitan railway stations at Perth, Bull Creek Railway Station does not offer Lock'n' Ride parking system in which cars are locked for six hours or so from 9 in the morning to 3:30 pm. The car owner has to call Transperth if he wants to get his car. There are more problems relating to the travel of Perth. There are certain facilities not available to the commuters in Perth. There is service of trains needed between east and west Perth. There is a light train track proposed but the plans for carrying it out has not been finalized yet. The city is growing and there is more need for refined transportation. According to an estimate the travel through has increased by 67 percent in the last ten years. The public is using public vehicles more and it necessitates that a better network of trains and other transport is introduced. Current network is unable to fulfill the current or future needs of Perth. Government's Plans to develop the Railway system It is estimated that the need for public transport will double in the year2031.There for after many recommendations the government is planning to maximize the capacity of Perth’s railway station. It has been announced that the government will use the parking revenue of the Bull Creek Station to build an improved network of rails in the city. The light rail system will be introduced along with rapid transit services More facilities will be given in the premises of the station which are already present In many of the main Australian fast track stations. The plans to start one light train were already in focus since 2007 but now recently a light train will be starting soon tom travel to the northern suburbs. The government aims to give public vehicles dominance over cars. With distances increasing and the population rising, it is very much recommended that a fast and comfortable network be designed. People prefer trains over buses. If the train system is modernized and improved in the less developed areas then people will not only have ease and comfort in commuting, but their lifestyle will also be improved. Conclusion: From the above discussion about Transit modes in Perth and detailed studies of Canning Bridge Railway station and Bull creek Railway station, it is obvious that the selection of mode of transit for anyone is not always dependent on his or her own choice. Looking at the pattern of change in use of any particular mode of transit in Perth, it is obvious that choice of transit mode changes with distance between home and work place, your age, availability of facilities, your socio-demographic background and a lot more factors. Detailed study of the above mentioned two areas shows that factors like security, availability of proper footpaths, infrastructure, access for cyclist, location of a railway station, routes covered by a railway station and road or rail track condition, all play an important role in selection of mode of transit by the people. This selection is dependent on a number of factors, and it is not a matter of choice only. References: Carey Curtis and Reena Tiwari, Transitioning urban arterial roads to activity corridors (Urban design International: (2008) 13) 105-120. Kevin J. Krizek, Residential Relocation and Changes in Urban Travel-does Neighbourhood scale urban form matter? (APA Journal, Summer 2003, Vol. 69 No. 3) Pp. 265-288 Peter Naess, Residential location affects travel behavior-but how and why? The case of Copenhagen metropolitan area (Elsevier: Progress in planning 6 (2005) 167-257 Robert Cervero and Carolyn Radisch, Travel choices in Pedestrian versus automobile oriented neighbourhoods (Transport policy Vol. 3 No. 3, 1996) 127-144. Robert Cervero and Kara Kochelman, Travel Demand and the 3 Ds: Density, Diversity and Design (Elsevier: Transpn Res-D, 1997, Vol 2 No. 3) 199-219. Read More
Cite this document
  • APA
  • MLA
  • CHICAGO
(“How far does the form and structure of the city together with its Essay”, n.d.)
Retrieved de https://studentshare.org/engineering-and-construction/1391181-how-far-does-the-form-and-structure-of-the-city-together-with-its-transport-network-influence-individual-travel-patterns
(How Far Does the Form and Structure of the City Together With Its Essay)
https://studentshare.org/engineering-and-construction/1391181-how-far-does-the-form-and-structure-of-the-city-together-with-its-transport-network-influence-individual-travel-patterns.
“How Far Does the Form and Structure of the City Together With Its Essay”, n.d. https://studentshare.org/engineering-and-construction/1391181-how-far-does-the-form-and-structure-of-the-city-together-with-its-transport-network-influence-individual-travel-patterns.
  • Cited: 0 times

CHECK THESE SAMPLES OF Influence of City Form and Structure on Individual Travel Patterns

Globalization and the Youth Culture of Dakar

In creating “imagined memberships” within a specified world, the individual becomes a part of a world through mimicry and recreation of the world to form and identify with the ways in which they associate themselves in congruence with the ways in which the structure services their need for identity (Sheld 235).... Globalization has become a driving force of youth culture, allowing for identification with groups from around the world where something of those social groups becomes an identifiable structure from which looks and behaviors are adapted....
8 Pages (2000 words) Essay

Comparison and Analysis of Architects: Le Corbousier and Leon Krior

For him, the buildings were not a reflection of his particular aesthetic, but, rather, were reflections of utilitarianism and city form.... He conceives of urban blocks in terms of how they can form complex urban patterns – some urban blocks are more likely to fit together to fit into patterns then others would be.... Both men had different focuses, although there is one thing which linked them – both wanted to ensure that there was harmony between the individual buildings and their surroundings....
13 Pages (3250 words) Essay

International Marketing for Travel and Tourism The 32nd Atlanta Jazz Festival

Air travel also became increasingly important as Atlanta Municipal Airport emerged as one of the busiest air hubs in the nation.... azz Festival - Introduction: Renowned as the largest free jazz festival in the country, the Atlanta Jazz Festival is traditionally a Memorial Day Weekend celebration of a true American art form - Jazz.... Atlanta is the most populous city and the capital city of the state of Georgia in the United States of America....
33 Pages (8250 words) Essay

The Influence of Transport Network of a City on Travel Patterns

This essay will discuss the extent to which the form and structure of the city, along with its transport network influences individual travel patterns.... (Banister D 1995) Although studies carried out by cognitive mapping researchers point to a connection between spatial learning, and travel patterns, not much can be concluded about the manner in which existing transportation infrastructures affect peoples travel patterns and route selection....
9 Pages (2250 words) Essay

Globalization and the Youth Culture of Dakar

The youths of Dakar have found identities through the entrepreneurial spirit, creating an unsanctioned, but thriving economy based upon information of the world outside of the city as it flows in through means of media influences.... Sheld states that 'youth steer the economic cultural life of the city and keep it hooked into the global economy' (232).... Sheld's research is based upon a belief that 'Dakarois youth use dress to shape the city and urban identity' (232)....
8 Pages (2000 words) Literature review

Information and Geography of the United Arab Emirates

The influence of Persian can be notably visible in the traditional folk arts and architecture of Emirati.... Moreover, this example attributes the influence of Persian towards the traditional architecture of the UAE.... This paper "Information and Geography of the United Arab Emirates" presents is a country which is bordering Saudi Arabia to the south and Oman to the east....
6 Pages (1500 words) Term Paper

Tourism Theory and Practice in the Context of the Forbidden City

The object of analysis for the purpose of this paper "Tourism Theory and Practice in the Context of the Forbidden city" is the Forbidden city that is also known as the Palace Museum and was considered the imperial palace at the time of the Ming and Qing Dynasties.... The Forbidden city is located in the center of Beijing to the northern part of Tiananmen Square.... Due to its fabulous attractions, Forbidden city has developed into a large palace complex but the most enjoyable tourist attraction that is commonly listed in all Beijing tours itineraries....
6 Pages (1500 words) Case Study

Integrated Land Use and Transportation: Network Dynamic

Even in the same authority as city governments, transportation and land use are repeatedly handled by different departments, with engineers in charge of transportation decisions while planners are accountable for land use planning.... The author of the paper "Integrated Land Use and Transportation: Network Dynamic" will begin with the statement that there has been considerable remark on the wants, rewards as well as opportunities that result from assimilating land use and transport planning....
17 Pages (4250 words) Term Paper
sponsored ads
We use cookies to create the best experience for you. Keep on browsing if you are OK with that, or find out how to manage cookies.
Contact Us