StudentShare
Contact Us
Sign In / Sign Up for FREE
Search
Go to advanced search...
Free

Service Quality in a University Sports Centre - Case Study Example

Cite this document
Summary
The paper "Service Quality in a University Sports Centre" sought to investigate and compare customers’ expectations from and experiences in the University Sports Centre, to determine students’ perceptions of the facility’s quality, and to investigate the difference in perception among the elements of service quality…
Download full paper File format: .doc, available for editing
GRAB THE BEST PAPER96.9% of users find it useful
Service Quality in a University Sports Centre
Read Text Preview

Extract of sample "Service Quality in a University Sports Centre"

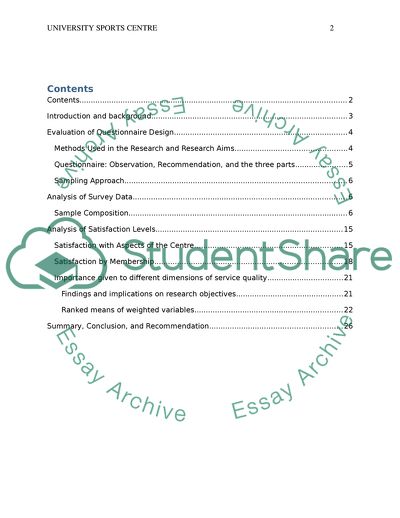
Quantitative Report: Service Quality in a Sports Centre Program Supervisor July 28, Contents Contents 2 Introductionand background 3 Evaluation of Questionnaire Design 4 Methods Used in the Research and Research Aims 4 Questionnaire: Observation, Recommendation, and the three parts 5 Sampling Approach 6 Analysis of Survey Data 6 Sample Composition 6 Analysis of Satisfaction Levels 15 Satisfaction with Aspects of the Centre 15 Satisfaction by Membership 18 Importance given to different dimensions of service quality 21 Findings and implications on research objectives 21 Ranked means of weighted variables 22 Summary, Conclusion, and Recommendation 25 Quantitative Report: Service Quality in a University Sports Centre Introduction and background Most organizations operate in competitive environments. Competition from other product providers requires strategies for meeting value expectations from consumers with the aim of attracting and retaining them (Lamb, Hair, & McDadiel 2012, n.p.). Some competitive industries rely on research and development for understanding their client’s needs that they can meet through generation of new products or through improvement of product quality. In the hotel industry, research can help define objectives improvement measures (Pavia, Stipanovic, & Floricic 2013, p. 279). Research on drivers to use of banking services (Aal-Qasa et al. 2014, p. 8) and loan facilities (Bofit 2012, p. 9, 10) has also informed customers’ preferences in the banking industry. Dynamism of capabilities and its role on competitive advantage (Schilke 2014, p. 179) and research can also inform of potentials at a time, has informed development of a competence model for business-to-Business leadership, and can be used for developing service delivery models. Such an approach is also necessary in the sports industry in which equipments and services can determine clients’ attitude and desire to come back to a service provider. Many factors affect attitude towards sports facilities and choice to visit. Income level that is reflective of students’ level of education (Candemir & Zalluhoglu 2012, p. 37), gender (Aksay 2013, p. 53), and comfort (Blank, Sweeney, & Fuller 2014, p. 237) are some of the factors to customers’ satisfaction in the sports industry. Research can also reveal percentage of a market that remains unexploited and shift interest to it for market expansion (Heydarinejad, et al. 2012, p. 160). In addition, understanding customers’ needs is a step to meeting their expectations through availing necessities but knowledge of the customers’ experience with products that can then be compared with expectations informs level of satisfaction. This, according to Smith (2012, p. 154) is important in ensuring and safeguarding customer satisfaction that in turn retain existing customers and can attract more customers through testimonials. Research on customers’ satisfaction in the sports’ industry is therefore necessary. The study, based on previously collected data, sought to investigate and compare customers’ expectations from and experiences in the University Sports Centre, to determine students’ perceptions of the facility’s quality, and to investigate difference in perception among the elements of service quality. The study will help the facility’s management to understand customers’ expectations from the facility, level of satisfaction, and perception of the facility’s service quality for service delivery decisions and for policymaking. In addition, the study will contribute to literature on sports facilities and strategic management of the facilities. Evaluation of Questionnaire Design Methods Used in the Research and Research Aims Quantitative method’s survey design was used for the study. With users of the sports facility, and focus on the institution’s students, as the population, an online survey questionnaire was used to collect the data. A standard questionnaire was used to collect the data and it was organized to ensure flow of questions and to elements of service quality. Two hundred and two students formed the research sample and using the students’ email addresses, they were directed to the survey’s website where they completed the online questionnaire. A pre-test of the questionnaire established its reliability and face validity. The study aimed at investigating customers’ expectations, experience, and opinion over the facility’s service quality. Tangible aspects of service, empathy, assurance, reliability, and responsiveness, which are elements of service quality, evaluated experience based on expectations and participants reported significance of each element. The aims are significant to various stakeholders such as the facility’s management that seeks to meet customers’ needs, other sports facilities that needs to understand benefits of evidence based approach to management, and to consumers who are likely to benefit from quality improvements. Questionnaire: Observation, Recommendation, and the three parts The questionnaire is precise and comprehensive, especially the first two sections. Organization of question 1 to have a narration that explains the context of the question and quantitative measure of the responses ensures accuracy and reliability of the responses. Having a brief question that applies to all the 21 prompts also helps achieve precision and easy comprehension of the questions. This also makes the questionnaire short and helps in motivating respondents because of shorter completion time. Presentation of question 1 is also appealing. Hoye, et al. (2012, p. 295) explain that tangible products, reliability of products, responsiveness to customers’ needs and willingness to meet the needs, confidence in staff’s positive attitude towards clients, and empathy to clients are service quality indicators in sports facility and inclusion of all the elements in the questionnaire identifies comprehensiveness in investigating quality. This also establishes external reliability of the study’s results. A greater level of precision could have however been achieved in questions two and three without losing meaning. Considering that the audience is a learned population, precise prompts such as appearance of physical facility could have been used in question two prompt one and prompts such as gender and year of study could have improved precision in question three. The purpose of the first part of the questionnaire was to collect data on participants’ views on service quality and performance, based on expectations. The second part of the questionnaire was to collect data on relative importance of the quality measures to the participants while the third part was to collect data on the participants’ demographic factors for comparative analysis and reliability tests. Question 3 is trivial to participants and should have been presented first. Being simple, the question would create a good environment to participants and prepare them for the critical questions in part 2 and 3. Sampling Approach Simple random sampling was used in the study. The approach offers equal probability of selection to every member of a sample space and therefore eliminates chances of researcher bias. This also develops confidence in reliability of a study’s results. Analysis of Survey Data Sample Composition Two hundred and two students formed the study’s sample. One hundred and twenty-six (62.4 percent) of the participants were male while 75 (37.1 percent) were female. The following histogram shows the distribution. Graph 1: Research participants by gender The sample is gender representative, though it reported fewer female students than it did male students. Derived opinions and conclusions are therefore applicable to the entire population and the statistics suggest focus on male students as the major clients, by gender, of the facility. The highest frequency of service demand per student is two days a week, though significant number of students also visits the facility once or less in a week and three times a week. Only 17.8 percent of the students visit the facility more than three times a week and just about 23 percent of the participants never visit the facility. The following table and histogram shows the frequency of visits. Table 1: Frequency of visits how often do you use the centre Frequency Percent Valid Percent Cumulative Percent Valid never 46 22.8 22.8 22.8 once a week or less 39 19.3 19.3 42.1 twice a week 47 23.3 23.3 65.3 3 times a week 34 16.8 16.8 82.2 4 times a week or more 25 12.4 12.4 94.6 5 11 5.4 5.4 100.0 Total 202 100.0 100.0 Graph 2: Frequency of visits The trend suggest need for daily operations of the facility to meet customers’ needs and possibility of expanding customer base by attracting the more than 20 percent of students who are not visiting the facility at all. Students’ year of study was another significant demographic factor and the following table and graph shows frequency distribution by year. Table 2: Year of study what year at university are you currently in? 1st /2nd/ 3rd/ 4th/ masters/ other Frequency Percent Valid Percent Cumulative Percent Valid 1st year 68 33.7 33.7 33.7 2nd year 84 41.6 41.6 75.2 3rd year 44 21.8 21.8 97.0 4th year 4 2.0 2.0 99.0 masters 1 .5 .5 99.5 other 1 .5 .5 100.0 Total 202 100.0 100.0 Graph 3: Year of study A majority of the respondents, 75.2 percent, were first year and second year students and fewer senior students participated. While little disparity is expected in number of students across years of undergraduate studies, the disparity could indicate difference in interest in the subject and could suggest first and second year students as the most interested segments and therefore possible clients of the facility. Membership to the sports club is another demographic variable but is not significant because the proportion of members and non-members was almost the same as the following graph shows. Graph 4: Membership This, interpreted together with distribution by year of study, suggests that every student in the likely academic years, despite membership, is interested in the topic and is therefore a probable visitor to the facility. The following table and graph show distribution of participants by their courses. Table 3: Distribution by courses subject area Frequency Percent Valid Percent Cumulative Percent Valid sports 68 33.7 33.7 33.7 business 41 20.3 20.3 54.0 media 24 11.9 11.9 65.8 other 69 34.2 34.2 100.0 Total 202 100.0 100.0 Graph 5: Distribution by courses Students who studies sports formed the majority class of respondents and this supports the opinion that interest in the subject motivated response and therefore shows reliability of the responses in understanding needs and expectations of clients for better management of the facility. Knowing sampling distribution is therefore important to identifying external reliability of research results. It shows representative nature of the participants and identifies underlying traits of the participants that could be relevant to a study’s objective. The study’s demographic distribution, for example, explains representation by gender, year or study, and course, factors that are also indicators of viable segments by the demographics. Existence of students who are neither members of the Sports Centre nor pay upon visit is the unexpected aspect of the sample composition. The segment is likely to be a privileged segment of students, such as members of student leadership. The segments therefore do not pay for possible visit and could lack base for accurately valuing the facility’s services. Consequently, their evaluation may not reflect on quality of the facility’s services. This shows that the sampling criteria was too general and could expose the study to confound. Inclusion criterion such as provision of consideration for the facility’s services should have been considered in the sampling approach. Analysis of Satisfaction Levels Satisfaction with Aspects of the Centre Question one related to elements of service quality. The following table shows ranked opinions over aspects of each question. Table 4: Aspects of the centre Descriptive Statistics N Mean Std. Deviation well mannered and informative staff 202 3.76 .848 How satisfactory modern sports/gym equipment 201 3.71 .780 providing a reliable service that is promised 200 3.70 .821 willingness to help facility users 199 3.69 .842 visually appealing facilities 200 3.67 .827 modern changing facilities 200 3.67 .778 service carried out as promised first time 198 3.66 .891 informing customer of new and changing schedule / timetables 200 3.64 .820 service performed at promised time 200 3.63 .881 prompt service to facility users 201 3.62 .870 staff with good customer service 199 3.60 .875 secure transactions e.g. membership payments and booking facilities 201 3.60 .939 smart , professionally appearing staff 202 3.57 .815 readiness to respond to user request 198 3.56 .851 convenient hours of operation 202 3.54 .947 knowledgeable and reliable staff 198 3.53 .865 attending to the needs of every customer e.g. on a personal one to one basis 197 3.48 .843 highly motivated staff for example encouraging gym staff 199 3.48 .858 informative, relevant and appealing documentation such as gym and class timetables and opening times 200 3.44 .928 dealing with customer complaints 191 3.31 .743 prompt actions based on customer feedback 191 3.29 .766 Valid N (listwise) 177 The following, based on the ranked means, are the aspects of the Sports Centre with which the participants were satisfied. Manners and informative capacity of staff Modern nature of equipments Provision of reliable service that is promised Willingness to help facility users Visual appeal of facilities The aspects are spread across the different elements of quality measures. The most satisfying aspect related to assurance while the subsequent aspects related to tangible features, reliability, responsiveness, and tangible features respectively. The following aspects derived the least level of satisfaction from the respondents and were equally spread across the service quality indicators except empathy. Promptness of actions based on customer feedback Dealing with customers’ complaints Informative, relevance, and appeal of documents such as timetables and opening times Motivation among staff Attending to needs of every customer The poorly rated aspects are also distributed across the service quality elements except reliability. Ranks of the 21 aspects suggest that managerial decisions for improving service delivery in the facility should be based on individual aspects and not be generalized to the five broad elements of service quality. This is because an aspect of an element may be highly valued while another aspect of the same element may be lowly values. Manners and informative capacity of staff and level of motivation of staff are examples of aspects of the same elements whose rating differ. In addition, all the aspects have means of between three and four and this means average. The management should therefore strive to improve on every aspect because current level of satisfaction is just average is all of the aspects. Focus should, however, be made to the aspects with the least average scores before the aspects with highest average scores. Satisfaction by Membership Table 5 shows average satisfaction in each aspect, by membership Table 5: Satisfaction by membership Report Mean are you a member or do you pay each time T1 T2 T3 T4 T5 T6 member 3.73 3.64 3.62 3.51 3.33 3.54 pay each time 3.67 3.70 3.74 3.67 3.58 3.51 Total 3.70 3.67 3.68 3.59 3.45 3.53 Table 5 continued Report Mean are you a member or do you pay each time D1 R1 R2 D2 D3 D4 member 3.67 3.28 3.29 3.73 3.65 3.69 pay each time 3.74 3.34 3.32 3.61 3.63 3.58 Total 3.70 3.31 3.31 3.67 3.64 3.64 Table 5 continued Report Mean are you a member or do you pay each time R3 R4 R5 C1 C2 C3 member 3.66 3.69 3.52 3.76 3.42 3.69 pay each time 3.58 3.68 3.60 3.77 3.54 3.50 Total 3.62 3.69 3.56 3.76 3.48 3.60 Table 5 continued Report Mean are you a member or do you pay each time C4 E1 E2 member 3.58 3.43 3.57 pay each time 3.46 3.54 3.63 Total 3.52 3.49 3.60 Observable differences in level of satisfaction existed between members and non-members in all of the aspects. The differences were however not significant except in the case of service carried out as promised. The following tables show the cross tab and chi-Square results. Table 6: Cross tab for service carried out as promised vs. membership Crosstab Count service carried out as promised first time Total very dissatisfactory dissatisfactory neutral satisfactory very satisfactory are you a member or do you pay each time member 1 12 21 37 23 94 pay each time 0 8 28 48 8 92 Total 1 20 49 85 31 186 Table 7: Chi-square test Chi-Square Tests Value df Asymp. Sig. (2-sided) Pearson Chi-Square 11.461a 4 .022 Likelihood Ratio 12.173 4 .016 Linear-by-Linear Association .907 1 .341 N of Valid Cases 186 a. 2 cells (20.0%) have expected count less than 5. The minimum expected count is .49. This suggests preferential treatment to members. Importance given to different dimensions of service quality Findings and implications on research objectives The study’s objective was to investigate difference in performance dimensions and the following table shows the analysis results. Table 8: Descriptive statistics on service quality elements Statistics the appearance of the sports centre, physical facilities such as staff, gym equipment, the sports hall, and changing rooms. the ability of the sports centre and its staff to implement the service promised reliably and accurately. the sports centres willingness to help users and provide a prompt and friendly service. the knowledge and manners of the sports centres staff, and their ability to supply and maintain confidence and trust within its customer. the attention to detail given when dealing with a customer on a one to one basis , though being caring and sympathetic to any problems that may have arisen. N Valid 202 202 202 202 202 Missing 0 0 0 0 0 Mean 25.34 18.25 18.29 17.26 20.95 Median 25.00 20.00 20.00 18.50 20.00 Mode 20 20 20 20 20 Std. Deviation 11.399 7.425 8.075 7.133 10.101 The results shows that appearance of the sports centre and physical facilities is the most important element to the respondents (Mean= 25.34). The element also reported the highest median and this establishes reliability. The results mean that the management should focus on the physical appearance of the centre and its facilities in general. Weighted variables Ranked means of weighted variables The following table shows the means of the weighted variables Table 9: Ranked means of weighted variables Descriptive Statistics N Mean Equipment Rating Weighted 201 95.4378 Appearance Weighted 200 94.4850 Changing Facilituies Weighted 200 93.8000 Smart staff weighted 202 91.9554 Convenience weighted 202 89.2624 information weighted 200 87.6250 Staff with good customer care weighted 199 73.0251 Attending to needs of every customer weighted 197 70.8376 Reliable Serice weighted 200 67.4650 readiness to respond to user requests weighted 199 67.2915 Informing Customers pf changes weighted 200 66.7500 willingness to help users weighted 201 66.7214 Service carried out 1st time weighted 198 66.3485 Service provided as promised weighted 200 66.1100 dealing with customer complaints weighted 198 65.7551 well mannered and informative staff weighted 202 65.1832 secure transactions weighted 201 63.2289 knowledgeable and reliable staff weighted 198 60.8763 prompt service to users weighted 191 60.7199 prompt actions on customer feedback weighted 191 60.5471 highly motivated staff weighted 199 60.0578 Valid N (listwise) 177 Comparison with original means Descriptive Statistics N Mean Rank of weighted Rank of unweighted Equipment Rating Weighted 201 95.4378 1 2 Appearance Weighted 200 94.4850 2 5 Changing Facilituies Weighted 200 93.8000 3 6 Smart staff weighted 202 91.9554 4 13 Convenience weighted 202 89.2624 5 15 information weighted 200 87.6250 6 19 Staff with good customer care weighted 199 73.0251 7 11 Attending to needs of every customer weighted 197 70.8376 8 17 Reliable Serice weighted 200 67.4650 9 3 readiness to respond to user requests weighted 199 67.2915 10 4 Informing Customers pf changes weighted 200 66.7500 11 8 willingness to help users weighted 201 66.7214 12 10 Service carried out 1st time weighted 198 66.3485 13 7 Service provided as promised weighted 200 66.1100 14 9 dealing with customer complaints weighted 198 65.7551 15 14 well mannered and informative staff weighted 202 65.1832 16 1 secure transactions weighted 201 63.2289 17 12 knowledgeable and reliable staff weighted 198 60.8763 18 16 prompt service to users weighted 191 60.7199 19 21 prompt actions on customer feedback weighted 191 60.5471 20 20 highly motivated staff weighted 199 60.0578 21 18 Valid N (listwise) 177 The aspects assumed new ranks after weighting and the ranks are consistent with respondents’ opinions on the elements of service quality. The weighting is therefore important for realizing reliability of the aspects in estimating elements of service quality. Summary, Conclusion, and Recommendation The study sought to investigate perception of element of service quality as offered by the University Sports Centre. Survey design, based on an online questionnaire, was used for data collection. The sample represented both genders, though males formed the majority. Not all students visit the facility and a majority visits the facility for less than four days in a week. A majority of the respondents were first and second year undergraduate students from sports and business related courses. Results show average level of satisfaction across all the aspects of service quality and rank identify equal significance of all the five elements of service quality. Observed difference in level of satisfaction occurred between members and non-members, but the difference was only significant for ‘service carried out as promised first time.’ Members were more satisfied than were non-members, an indicator of bias in service delivery. Even though opinions on the aspects of service quality suggest equal significance of all the service quality elements, results on the elements suggest relative significance, in which tangible aspects are the most significant, and weighted data confirms this. Weighting the responses on aspects of service quality changed their value, significantly. Tangible aspects of the centre are therefore the strengths while ability to supply and maintain confidence is the facility’s area of greatest weakness. Focus on senior students, female students, and on developing visitors’ confidence are recommended expansion of visitors base and satisfaction. Understanding service quality elements as subjective measures, I have expected disparity in relative significance but have not been able to rank or define a specific rank for the elements. The result shows that relative significance exists and this challenges my existing knowledge to the effect that the relative significance could vary across target audience, industries, and possibly time. Continuous research on the elements is therefore necessary. Adding the weighted values established reliability of data on the service quality elements. Use of simple random sampling and lack of inclusion and exclusion criteria are some of the identified weaknesses of the research design. A stratified random sampling is recommended for its ability to generate a representative sample and defined inclusion and exclusion criteria are recommended for eliminating confounds. The evaluation has however exposed me to important analytical tools such as cross tabulations that will improve my future research. Reference list Aal-Qasa, K et al. 2014, ‘Factors affecting intentions to use banking services in Yemen,’ Journal of Internet Banking & Commerce, Vol. 18, No. 3, pp. 1-14. Aksay, E 2013, ‘Factors affecting girls’ participation in sorts in Turkey,’ International Journal of Academic Research, Vol. 5, No. 6, pp. 52-56. Blank, ASweeney, K & Fuller, R 2014, ‘Room for growth in professional sport: An examination of the factors affecting African-American attendance,’ Sport Marketing Quarterly, Vol. 23, No. 4, pp. 225-240. Bofit 2012, ‘Factors affecting the choice of an Islam loan,’ BOTIT Discussion, pp. 9-14. Candemir, A & Zalluhoglu, E 2012, ‘Factors affecting the sport related consumer expenditures,’ Ege Academic Review, Vol. 12, pp. 29-39. Heydarinejad, S et al. 2012, ‘A ranking of barrier factors affecting the participation of Iranian females in sports,’ Studies in Physical Culture & Tourism, Vol. 19, No. 3, pp. 160-164. Hoye, R et al. 2012, Sport management, Routledge, Burlington. Lamb, C Hair, J & McDadiel, C 2012, Marketing, Cengage Learning, Mason. Pavia, N Stipanovic, C & Floricic, T 2013, ‘Sustainable development in increasing the competitiveness of hotel offer-Case study Istra county,’ Tourism in Southern & Eastern Europe, Vol. 2, pp. 279-293. Schilke, O 2014, ‘On the contingent value of dynamic capabilities for competitive advantage: The nonlinear moderating effect of environmental dynamism,’ Strategic Management Journal, Vol. 35, No. 2, pp. 179-203. Smith, I 2012, Meeting customer needs, Routledge, Burlington. Read More
Cite this document
  • APA
  • MLA
  • CHICAGO
(Service Quality in a University Sports Centre Case Study Example | Topics and Well Written Essays - 2750 words, n.d.)
Service Quality in a University Sports Centre Case Study Example | Topics and Well Written Essays - 2750 words. https://studentshare.org/education/1850563-quantitative-report-you-need-use-in-spss
(Service Quality in a University Sports Centre Case Study Example | Topics and Well Written Essays - 2750 Words)
Service Quality in a University Sports Centre Case Study Example | Topics and Well Written Essays - 2750 Words. https://studentshare.org/education/1850563-quantitative-report-you-need-use-in-spss.
“Service Quality in a University Sports Centre Case Study Example | Topics and Well Written Essays - 2750 Words”. https://studentshare.org/education/1850563-quantitative-report-you-need-use-in-spss.
  • Cited: 0 times

CHECK THESE SAMPLES OF Service Quality in a University Sports Centre

The Investment Idea to Extend the Services Area of East Nest Hotels

The investing ideas for fitness centres include incorporating fitness centre through swimming pool, indoor game, sports equipment shop as well as boxing club amenities through which generating greater revenues for the organisation will be possible along with attaining diversification benefits....
6 Pages (1500 words) Case Study

Service Quality of Sports Centre

In the paper “Service Quality of sports centre” the author provides analysis of measurement of the service quality level of a sports centre of UK.... Among male most of them used the sports centre twice a month, while users among females most of them used it only once.... The interview focused in 5 different factors of service quality level.... The interview focused n 5 different factors of service quality level which are tangibles, reliability, responsiveness, assurance and empathy....
28 Pages (7000 words) Essay

Sports Manufacturing in India and China

First of all, it examines some of the industry characteristics in the sports manufacturing sector.... Description of an imaginary sports manufacturing company2.... he products must also be superior to the rest; quality assurance.... The report looks at two case studies; in India and China....
14 Pages (3500 words) Essay

The Sports Centre - the Target Population

The sports centre is supposed to be a Leisure establishment set up to provide a quality sports as well as health and leisure experience in whichever activity an individual may decide to participate in.... Many writers argue that the sports centre is supposed to be a major local centre for sport and leisure courses open to staff and students as well as the general public.... hellip; According to Bowers (1970), the sports centre should run highly successful competitive teams in sports such as football, netball and basketball and other games such as Badminton, table tennis and martial arts, all open to both members and non-members....
6 Pages (1500 words) Essay

Sports and Leisure

Contemporary issue around sports, leisure or leisure sports center around an array of issue both at the urban and rural level.... hellip; Issues can have a blurred sociomoralistic undertone like concern over the growing obscenity of advertisement in sports industry, the role of ethics in sports and leisure industry, moral uprightness of role models in sports, as well as the concern over drug use among sports person....
4 Pages (1000 words) Essay

Discovering Statistics Using SPSS

nbsp;… The first objective is to evaluate the perception of learners on the quality of the sports services provided at the university sports center.... The first set comprised 21 separate questions concerning five dimensions of service quality.... The second set of questions attempted to get the respondents to weight the importance they attached to each of the five dimensions of service quality.... The first questionnaire was determined to assess the service quality of the sports center; the results obtained on a five-point Linkert scale....
12 Pages (3000 words) Assignment

The University Sports Centre

According to Williams & Buswell (2013), service satisfaction is mostly attained when there is high level of service quality in the service provided.... For this paper, the emphasis is on the outcome of service quality among students using a sports facility at a university.... To this end, service providers have used various means to measure and evaluate the extent of quality in the service they provide.... Once this goal is achieved, it is said that service quality has been met (Agus, Barker and… service quality is important and necessary for both profit based service delivery and non-profit service delivery....
15 Pages (3750 words) Essay

The Statistical Analysis

For instance, while analyzing the level of satisfaction among the users of the university sports Center, a number of questions relating to the level of satisfaction and importance of equipment and services were answered by the respondents; all the respondents answered the same questions.... As a result, the structured questionnaires enabled the researcher to access information regarding the level of satisfaction of the sports center; in other words, the information collected from the respondents was more reliable in informing various improvements (Bryman and Bell 2007)....
15 Pages (3750 words) Assignment
sponsored ads
We use cookies to create the best experience for you. Keep on browsing if you are OK with that, or find out how to manage cookies.
Contact Us