StudentShare
Contact Us
Sign In / Sign Up for FREE
Search
Go to advanced search...
Free

The Level of the Key Biomarkers - Lab Report Example

Cite this document
Summary
This lab report "The Level of the Key Biomarkers" uses spectrometry enzyme assay and Sandwich ELISA to accurately measure the level of the key biomarkers (i.e. glucose, insulin and C-peptide) for five samples from unknown patients (A-E). There was a proportional bias present. …
Download full paper File format: .doc, available for editing
GRAB THE BEST PAPER92.3% of users find it useful
The Level of the Key Biomarkers
Read Text Preview

Extract of sample "The Level of the Key Biomarkers"

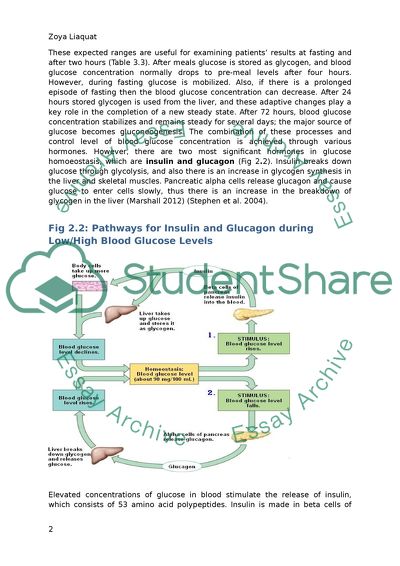
Lab report 0: The aim of this lab report is to use spectrometry enzyme assay and Sandwich ELISA to accurately measure the level of the keybiomarkers (i.e. glucose, insulin and C-peptide) for five samples from unknown patients (A-E). There was a use of methods comparison between the spec enzyme assay and glucose meter to evaluate 10 samples from (at fasting and after two hours). Thus there was proportional bias present, as the glucose meter (Method A) had higher values than the spec assay (Method B). According to these method values, Patient A was classed as either normal or impaired fasting hypoglycaemic. On the other hand, Patients B and E were diagnosed as fasting hypoglycaemic, since they had significantly lower blood glucose levels at fasting (1.0nmol/ml and 1.1nmol/ml). Furthermore, Patient B also had increased concentrations of insulin and C-peptide (1.70nmol/ml and 0.60nmol/ml). Conversely, Patient D had diabetes mellitus because their blood glucose concentration value was significantly higher and their values of insulin (-0.16nmol/ml) and c-peptides (-0.45nmol/ml) were significantly lower. These method values were compared with accurate standard reference values as evidenced by WHO guidelines. The abnormalities of glucose result in diabetic ketoacidosis, while abnormalities in glucose levels result in insulinamoia. 2.0: Introduction on Carbohydrates Metabolisms Glucose is a monosaccharide or simple sugar that is generally part of more complex carbohydrates. It is also an important source of energy. For some tissues, such as red blood cells, glucose is the only utilizing energy source. However, there are several tissues which are able to oxidise glucose to carbon dioxide, while the rest of them can only metabolize it to lactate; it can then be converted back into glucose in the liver and kidney through Gluconeogenesis. Lactate is produced when there is an inadequate availability of glucose from the anaerobic metabolism. There are two major sources of glucose; one is dietary, wherein the breakdown of carbohydrates takes place in diet, while the second is endogenous, which includes Glycogenolysis and Gluconeogenesis. Glycogenolysis occurs in muscle cells when there is an immediate requirement for energy; it also occurs in the liver when there are low levels of blood glucose. Pancreatic alpha cells release glucagon so that glucose enters cells slowly, thus there is an increase in breakdown of glycogen in the liver. Gluconeogenesis, which mainly occurs in the liver, is the pathway for producing glucose from non-carbohydrates molecules, such as lactate, amino acids and glycerol (Stephen et al. 2004). Blood glucose concentrations rely on relative rates of influx into circulation and utilization. The expected results of blood glucose levels in healthy subjects are not below 2.5mmol/L (before meals) or above 8.0mmol/L (two hours after meals). These expected ranges are useful for examining patients’ results at fasting and after two hours (Table 3.3). After meals glucose is stored as glycogen, and blood glucose concentration normally drops to pre-meal levels after four hours. However, during fasting glucose is mobilized. Also, if there is a prolonged episode of fasting then the blood glucose concentration can decrease. After 24 hours stored glycogen is used from the liver, and these adaptive changes play a key role in the completion of a new steady state. After 72 hours, blood glucose concentration stabilizes and remains steady for several days; the major source of glucose becomes gluconeogenesis. The combination of these processes and control level of blood glucose concentration is achieved through various hormones. However, there are two most significant hormones in glucose homoeostasis, which are insulin and glucagon (Fig 2.2). Insulin breaks down glucose through glycolysis, and also there is an increase in glycogen synthesis in the liver and skeletal muscles. Pancreatic alpha cells release glucagon and cause glucose to enter cells slowly, thus there is an increase in the breakdown of glycogen in the liver (Marshall 2012) (Stephen et al. 2004). Fig 2.2: Pathways for Insulin and Glucagon during Low/High Blood Glucose Levels Elevated concentrations of glucose in blood stimulate the release of insulin, which consists of 53 amino acid polypeptides. Insulin is made in beta cells of ‘islets of Langerhans’ and is synthesized as a large inactive biological molecule called prepoinsulin (prohormone). To form a smaller molecule (Proinsulin) there is a removal of the signal sequence and formation of three disulfide bonds. Proinsulin undertakes cleavage prior to secretion to make insulin and c-peptide (Fig 2.1). Circulating insulin has a short half-life (six minutes) during which it binds to its receptors in the liver, muscles and fat cells (Gupta 1997) (Saunders & Elsevier 2009). Fig 2.1: Biosynthesis of insulin (Marshall 2012) The disorder of glucose homoeostasis can cause hyperglycaemia (often to a degree diagnostic of diabetes) or hypoglycaemia. These three biomarkers measure the level of hypoglycaemia, when there are low levels of blood glucose, and hyperglycaemia when there is a high production of glucose in the liver and decreased removal of glucose from the blood. The major systemic metabolic disorder of glucose homeostasis is Diabetes Mellitus (DM), which is a group of carbohydrate metabolism disorders in which glucose is underutilised and produces hyperglycaemia. The following are classifications of DM (American Diabetes Association 2008): 1. Type 1 DM - destruction of pancreatic cells causing a decrease in insulin secretion 2. Type 2 DM - insulin secretion is defective and there is resistance to actions 3. Gestational DM 4. Impaired glucose tolerance 5. Impaired fasting glucose There are two aspects to clinical manifestation: chronic and acute complications Long-term chronic complications of diabetes can cause Microvascular (i.e. nephropathy, neuropathy or retinopathy) and Macrovascular (i.e. atherosclerosis) complications. The risk of microvascular problems occurs when glycaemic levels are poorly controlled and seem to be directly linked to hypoglycaemia. The abnormalities of lipids in atherosclerosis patients occur as a result of diabetes. Acute complications can include diabetic ketoacidosis and hyperosmolar coma. Untreated disturbances in metabolism may become intense with the development of life-threatening events of ketoacidosis or lactic acids (Kuzuya et al. 2001). 3.0: Methods Table 3.1: Types of Methods used for the Measurements of Three Biomarkers in Five Patients Samples (A-E) Biomarkers Methods Glucose Glucose (at 0 and 2 hours) was measured using the Spec Assay Insulin Sandwich ELISA C-Peptide Sandwich ELISA Table 3.2: Types of Biofulids Biomarkers Biofulids Glucose Blood Insulin Serum C-peptide Serum Table 3.3: Standards (WHO 2013 Guidelines) of Diagnosis Table 3.4: Reference Ranges used for Measurements of Biomarkers Table 3.4 displays the reference ranges used in the laboratory practical to measure each biomarker. The maximum concentration of glucose was (20mM), yet the use of glucose calibration range in the practical was (0-16mM). The purpose of using this broad calibration range was to obtain a wide range of results for the calibration plot. Results To determine the glucose concentration in the unknown patients’ samples calibration plots of Glucose, Insulin and C-peptide were completed. Fig 4.1: Calibration pPot of Glucose Concentration According to Fig 4.1, there is a wide range of calibration points. The above data shows a linear correlation between concentration glucose and absorbance of glucose oxidise. As absorbance of glucose oxidase increases the concentration of glucose increases too. Absorbance is quite low at a concentration level of 2Mm, but then it starts to increase at the concentration level of 4mM and drops down at the concentration of 6mM. At a concentration of 8mM, absorbance begins to increase again, and after that it significantly increases as the concentration of glucose increases. The linear line of best fit represents this, as most calibration points are within the calibration range. There is an anomalous point at the concentration level of 6Mm which seems to have a low absorbance values. This calibration plot has been drawn to determine the concentration of the unknown samples of patients at fasting and after two hours. Fig 4.2: Calibration Plot of Insulin Concentration The graph above, which illustrates the sigmoid plot of insulin, shows a positive correlation between the log concentration and absorbance. At the higher concentration of substrate there is a higher absorbance because the enzymes are working faster. Also, there is a higher reaction rate, and as the concentration decreases the absorbance decreases too. When the enzymes start to work there is a slow rate of reaction. Table 4.3: Using a Sandwich ELISA to Measure Insulin Concentration (Bradley and Zakir’s results) According to Table 4.3, the concentrations of five samples showed there was low insulin in all of them. Patient B had a significantly higher insulin level (1.70) than the others, while patient D had the lowest level of insulin (-0.16). Fig 4.4: Calibration Plot of C-peptide Concentration Table 4.5: Using a Sandwich ELISA to Measure C-Peptide (Based on my own results) According to the Table 4.5, Patients A and E showed infinity C-peptide concentrations. Patient B had a slightly higher concentration than Patient C, while Patient D had a negative concentration. 4.6: Comparison of Spec Assay and Glucose Meter To estimate the amount of glucose in blood it is important to lyse red blood cells and remove protein through adding a protein precipitant. There was a use of blank reading at the beginning, and then the remaining absorbance readings measured each of the blood samples at fasting and after two hours using the spec assay. The patient samples A-D corresponded to fast and two-hour post-glucose load, but for Patient E the samples were taken when the patient was found and two hours after, a dextrose infusion occurred when the patient had regained consciousness. On the other hand, the comparison method for glucose concentrations is glucose meter. This measures glucose concentrations using glucose-sensitive reagent strips at fasting level and after two hours. The instruments are vigorous and produce reliable results and, are used in hospitals and the community to measure blood glucose concentrations. They also provide quick analysis of blood glucose levels and are used to control both hypoglycaemic and hyperglycaemic disorders with the aim of regulating glucose to a near-normal range, depending on the patient group. Readings obtained from these glucose meters should not be used for diagnosis of diabetes. Thus there are recommendations of formal laboratory measurements, such as Enzyme spec assays (Tonyushkina et al. 2009). Table 4.7: Glucose Concentrations Provided by Two Methods at Fasting and after Two Hours Blood samples of five patients at fasting and after two hours Method A glucose Meter Glucose concentrations (mmol/ml) Method B Spec Assay Glucose concentrations (mmol/ml) A0 4.5 1.8 A2 4.2 2.1 B0 1.1 1 B2 5 3 C0 5.8 2.4 C2 5.5 2.3 D0 9.8 3 D2 19.8 4 E0 2.1 1.1 E2 4.2 2 Fig 4.8: Comparison between Two Glucose Methods Figure 4.8 shows glucose concentrations of 10 samples. There is a proportional bias, meaning that Method A gives higher values than Method B. There is a bias between the fasting values of both methods, as Method A had higher values than Method B. However, there is a positive correlation of concentration after two hours because they increased using both methods. Linear lines for both methods showed most values are within range, but values for Patients B, D and E are outside the linear line. This means these patients have abnormal results and glucose levels are poorly controlled in these patients. There is an identifying line in the middle to show that (A=B). From Table 4.7 and Figure 4.8, it can be gathered that with Method A Patient A at fasting had four times significantly higher concentration (4.5nmol/ml); it was also two times higher (4.2nmol/ml) after two hours compared to the same patient at fasting (1.8nmol/ml) and after two hours (2.1nmol/ml) with Method B. Considering Table 3.3 for standard reference ranges of blood glucose levels, Patient A had a low reference range (10.0nmol/ml), this illustrates that Patient D could have diabetic mellitus. However, with Method B Patient D started off with a low value (3.0nmol/ml) but the ending cut off value were significantly higher (4.0nmol/mol), and this means that Patient D could be normal. For Patient E, both methods showed lower values ( Read More
Cite this document
  • APA
  • MLA
  • CHICAGO
(The Level of the Key Biomarkers Lab Report Example | Topics and Well Written Essays - 3250 words, n.d.)
The Level of the Key Biomarkers Lab Report Example | Topics and Well Written Essays - 3250 words. https://studentshare.org/chemistry/1819400-clinical-biochemistry-lab-report
(The Level of the Key Biomarkers Lab Report Example | Topics and Well Written Essays - 3250 Words)
The Level of the Key Biomarkers Lab Report Example | Topics and Well Written Essays - 3250 Words. https://studentshare.org/chemistry/1819400-clinical-biochemistry-lab-report.
“The Level of the Key Biomarkers Lab Report Example | Topics and Well Written Essays - 3250 Words”. https://studentshare.org/chemistry/1819400-clinical-biochemistry-lab-report.
  • Cited: 0 times

CHECK THESE SAMPLES OF The Level of the Key Biomarkers

Biomarkers Associated with P53 in Breast Cancer

One of the biomarkers discovered in relation to breast cancer is p53 that has necessitated… Disruption of p53 function bears a central role in carcinogenesis.... This necessitates looking at an The main aim of this study was finding biomarkers associated with P53 status in Breast Cancer; Mutant or Wild Type, and how the status influences a biomarkers pathways.... biomarkers associated with p53 status include the following: p53K373ac, P53 K386ac, hMOF, H3K9me3, SUV39H1 and H3K9me3....
2 Pages (500 words) Book Report/Review

Markers Of Hemostasis: Gel Point and Fractal Microstructure of Incipient Blood Clots

Evans et al (2010) sought to find out if the incipient fractal dimension Df of a clot, could serve as functional biomarker in the process of hemostasis.... The focus of this study… This was important in providing the microstructural template, and helps in the determination of future morphology....
5 Pages (1250 words) Essay

Key Learning Points in Organizational Change

Stakeholder mapping align the right people to the right positionMapping helps identify the key participants in the change process and their contributions.... An important key learning points 02 – 03 Poor coordination among the levels of the company is a disadvantage of the conservative system that was used.... Group 2 Poor coordination is a key learning point because it helps underscore the fact that conservative systems refuse change.... Group 4This is a key learning point because the neutral zone acts as a redefining moment in the life of an individual....
6 Pages (1500 words) Essay

Public Key Infrastructure

However, external CAs reduces the level of integration to the infrastructure of the organization.... In addition, the level of flexibility in expanding and managing the certificates is reduced.... Public Key Infrastructure (PKI) is a type of security architecture that offers a higher level of confidence when it comes to the exchange of information over the internet.... Public Key Infrastructure Assignment Public Key Infrastructure (PKI) is a type of security architecture that offers a higher level of confidence when it comes to the exchange of information over the internet....
2 Pages (500 words) Case Study

Business-Level and Corporate-Level Strategies

Another key strategy that AT&T embarks on is product differentiation.... The essay describes business level and corporate level strategies of  AT&T company as the competitive environment in US telecommunication industry which includes AT&T, T-Mobile, Verizon, and Sprint… The paper considers that AT&T has to some extent controlled the US telecommunication industry although it is experiencing stiff competition from Verizon....
6 Pages (1500 words) Essay

Public Key Infrastructure

The in-house certification authority enhances the maximum level of control over the different software being used within an organization.... The management is convinced to implement Public key Infrastructure (PKI) as a framework to ensure integrity, confidentiality,… Subsequently, the company would be using digital certificate to sign software to demonstrate authenticity of software to their clients.... With this regard the study focuses on analyzing the fundamentals of PKI and their application in Public key Infrastructure Case Overview The organization is presently using a Microsoft Server Active Directory domain which is administered bya team of information security....
2 Pages (500 words) Research Paper

The Legal System Has the Duty of Resolving Disputes in Courts

Facts of case maybe important than others since… the key facts are necessary since they prove or disprove claims before the court.... There are four steps used in determining the key facts in a client's case (Albright & Putman, 2013). The first step is identifying each cause Key Facts Analysis The legal system has the duty of resolving disputes in courts by applying the principles and rule of law to the facts brought before the courts of law.... the key facts are necessary since they prove or disprove claims before the court....
2 Pages (500 words) Assignment

Determination of Antioxidant Strength of Unknowns, Foods, Drinks and Biological Samples

Glutathione, vitamin A, albumin, vitamin E, uric acid are key antioxidants.... The author of this study "Determination of Antioxidant Strength of Unknowns, Foods, Drinks and Biological Samples" discusses the antioxidant strength of unknown, known (cranberry and apple juice) and biological samples (saliva), analyzing what contains higher levels of antioxidants....
6 Pages (1500 words) Lab Report
sponsored ads
We use cookies to create the best experience for you. Keep on browsing if you are OK with that, or find out how to manage cookies.
Contact Us