StudentShare

Our website is a unique platform where students can share their papers in a matter of giving an example of the work to be done. If you find papers
matching your topic, you may use them only as an example of work. This is 100% legal. You may not submit downloaded papers as your own, that is cheating. Also you
should remember, that this work was alredy submitted once by a student who originally wrote it.
✕
Free
Statistical Analysis of the Document - Assignment Example
Summary
"Statistical Analysis of the Document" paper states that the statistical methods used are: Frequencies, Crosstabs since the dependent and independent variables are categorical variables, it is better to use the chi-square test rather than the other statistical procedures/test…
- Subject: Statistics
- Type: Assignment
- Level: Undergraduate
- Pages: 4 (1000 words)
- Downloads: 0
- Author: astiedemann
Extract of sample "Statistical Analysis of the Document"
Statistical Analysis The statistical methods used is: Frequencies, Crosstabs since the dependent and independent variables are categorical variables, it is better to use chi square test rather than the other statistical procedures/test.
2. Simulation of data set for the variables which will be used for measurements. (Variables are identified in attached documents). The SPSS file containing these data is attached herewith. File name is ssri.sav.
The variables under study are described as below:
Variables
1: Depression: 1 Mild (14-19), 2 Moderate (20-28)
2: Drugs: 1 SSRI, 2 Natural alternatives
3. Alternative regimen: 1 routine colon hydrotherapy sessions; 2 vegetarian dietary
lifestyle adjustment; 3 herbal combination
4. Interval: 0 the beginning of the study, 1 at 30 days, 2 at 60 days, and 3 at 90 days.
5. Region: 1 Rural 2 Urban
6 Side effects: 1 Moderate 2 Severe
3. The statistical software which will perform the statistical procedures required for the statistical methods is SPSS which is versatile for this kind of statistical analyses.
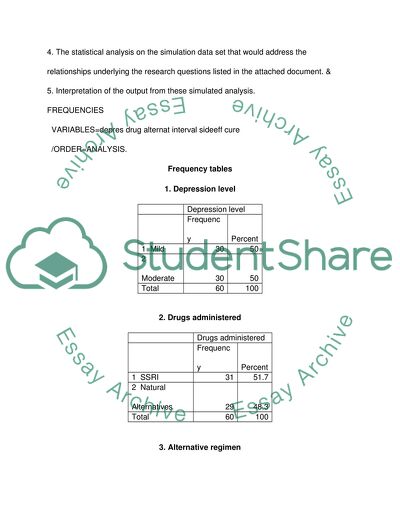
4. The statistical analysis on the simulation data set that would address the relationships underlying the research questions listed in the attached document. &
5. Interpretation of the output from these simulated analysis.
FREQUENCIES
VARIABLES=depres drug alternat interval sideeff cure
/ORDER=ANALYSIS.
Frequency tables
1. Depression level
Depression level
Frequency
Percent
1 Mild
30
50
2 Moderate
30
50
Total
60
100
2. Drugs administered
Drugs administered
Frequency
Percent
1 SSRI
31
51.7
2 Natural Alternatives
29
48.3
Total
60
100
3. Alternative regimen
Alternative regimen
Frequency
Percent
1 Routine
29
48.3
2 Vegetrarian
16
26.7
3 Herbal combination
15
25
Total
60
100
4. Interval time period
Interval time period
Frequency
Percent
1 At the beginning
16
26.7
2 at 30 days
15
25
3 at 60 days
13
21.7
4 at 90 days
16
26.7
Total
60
100
5. Side effects
Side Effects
Frequency
Percent
1 Low
31
51.7
2 High
29
48.3
Total
60
100
6. Cured
Cured
Frequency
Percent
0 No
30
50
1 Yes
30
50
Total
60
100
CROSSTABS
/TABLES=depres drug alternat interval sideeff BY cure
/FORMAT= AVALUE TABLES
/STATISTIC=CHISQ
/CELLS= COUNT.
Analysis and Interpretation:
1. Null Hypothesis: There is no association between depression level and the effect (cure) at 5% level of significance.
Alternative Hypothesis: There is an association between depression level and the effect (cure) at 5% level of significance.
Depression level * Cured
Crosstab
Count
Cured
Total
0 No
1 Yes
Depression level
1 Mild
16
14
30
2 Moderate
14
16
30
Total
30
30
60
Chi-Square Tests
Value
df
Asymp. Sig. (2-sided)
Exact Sig. (2-sided)
Exact Sig. (1-sided)
Pearson Chi-Square
.267(b)
1
0.606
Continuity Correction(a)
0.067
1
0.796
Likelihood Ratio
0.267
1
0.605
Fishers Exact Test
0.797
0.398
Linear-by-Linear Association
0.262
1
0.609
N of Valid Cases
60
Interpretation: Since the Chi square value is 0.267 with probability 0.606 (>0.05) we accept our null hypothesis and say that there is no association between depression level and the effect (cure) at 5% level of significance. ie. regardless of the depression level the cure is at the same level.
2. Null Hypothesis: There is no association between drugs administered and the effect (cure) at 5% level of significance.
Alternative Hypothesis: There is an association between drugs administered and the effect (cure) at 5% level of significance.
Drugs administered * Cured
Crosstab
Count
Cured
Total
0 No
1 Yes
Drugs administered
1 SSRI
15
16
31
2 Natural Alternatives
15
14
29
Total
30
30
60
Chi-Square Tests
Value
df
Asymp. Sig. (2-sided)
Exact Sig. (2-sided)
Exact Sig. (1-sided)
Pearson Chi-Square
.067(b)
1
0.796
Continuity Correction(a)
0
1
1
Likelihood Ratio
0.067
1
0.796
Fishers Exact Test
1
0.5
Linear-by-Linear Association
0.066
1
0.798
N of Valid Cases
60
Interpretation: Since the Chi square value is 0.067 with probability 0.796 (>0.05) we accept our null hypothesis and say that there is no association between drugs administered and the effect (cure) at 5% level of significance. ie. regardless of the drugs administered the cure is at the same level.
3. Null Hypothesis: There is no association between alternative regimen and the effect (cure) at 5% level of significance.
Alternative Hypothesis: There is an association between alternative regimen and the effect (cure) at 5% level of significance.
Alternative regimen * Cured
Count
Cured
Total
0 No
1 Yes
Alternative regimen
1 Routine
15
14
29
2 Vegetrarian
8
8
16
3 Herbal combination
7
8
15
Total
30
30
60
Chi-Square Tests
Value
df
Asymp. Sig. (2-sided)
Pearson Chi-Square
.101(a)
2
0.951
Likelihood Ratio
0.101
2
0.951
Linear-by-Linear Association
0.097
1
0.756
N of Valid Cases
60
Interpretation: Since the Chi square value is 0.101 with probability 0.951 (>0.05) we accept our null hypothesis and say that there is no association between alternative regimen and the effect (cure) at 5% level of significance. ie. regardless of the alternative regimen the cure is at the same level.
4. Null Hypothesis: There is no association between interval time period and the effect (cure) at 5% level of significance.
Alternative Hypothesis: There is an association between interval time period and the effect (cure) at 5% level of significance.
Interval time period * Cured
Crosstab
Count
Cured
Total
0 No
1 Yes
Interval time period
1 At the beginning
8
8
16
2 at 30 days
7
8
15
3 at 60 days
7
6
13
4 at 90 days
8
8
16
Total
30
30
60
Chi-Square Tests
Value
df
Asymp. Sig. (2-sided)
Pearson Chi-Square
.144(a)
3
0.986
Likelihood Ratio
0.144
3
0.986
Linear-by-Linear Association
0.012
1
0.911
N of Valid Cases
60
Interpretation: Since the Chi square value is 0.144 with probability 0.986 (>0.05) we accept our null hypothesis and say that there is no association between interval time period and the effect (cure) at 5% level of significance. I.e. regardless of the interval time period the cure is at the same level.
5. Null Hypothesis: There is no association between the side effects and the effect (cure) at 5% level of significance.
Alternative Hypothesis: There is an association between the side effects and the effect (cure) at 5% level of significance.
Side Effects * Cured
Crosstab
Count
Cured
Total
0 No
1 Yes
Side Effects
1 Low
15
16
31
2 High
15
14
29
Total
30
30
60
Chi-Square Tests
Value
df
Asymp. Sig. (2-sided)
Exact Sig. (2-sided)
Exact Sig. (1-sided)
Pearson Chi-Square
.067(b)
1
0.796
Continuity Correction(a)
0
1
1
Likelihood Ratio
0.067
1
0.796
Fishers Exact Test
1
0.5
Linear-by-Linear Association
0.066
1
0.798
N of Valid Cases
60
Interpretation: Since the Chi square value is 0.144 with probability 0.986 (>0.05) we accept our null hypothesis and say that there is no association between the side effects and the effect (cure) at 5% level of significance. ie. regardless of the side effects the cure is at the same level.
Read
More
sponsored ads
Save Your Time for More Important Things
Let us write or edit the assignment on your topic
"Statistical Analysis of the Document"
with a personal 20% discount.
GRAB THE BEST PAPER
