StudentShare
Contact Us
Sign In / Sign Up for FREE
Search
Go to advanced search...
Free

Statistical Parameters of the Company ABC - Essay Example

Cite this document
Summary
This essay declares that the company ABC has provided quarterly sales data for years from the year 2000 through 2004.  This assignment uses the values of the data set to study statistics of the past performance of the company and predict the future quarterly sales for years 2005 and 2006…
Download full paper File format: .doc, available for editing
GRAB THE BEST PAPER94.1% of users find it useful
Statistical Parameters of the Company ABC
Read Text Preview

Extract of sample "Statistical Parameters of the Company ABC"

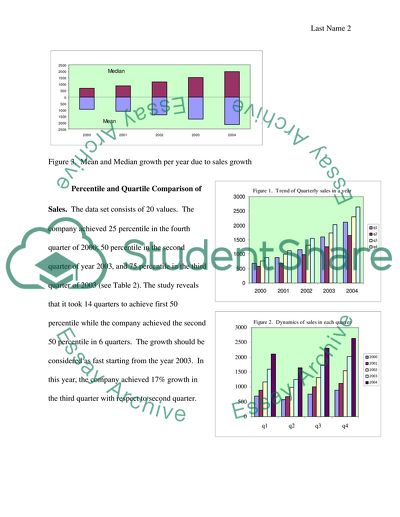
 Scope of Work The company ABC has provided quarterly sales data for years from the year 2000 through 2004. The data set consists of 20 values. This assignment uses the values of the data set to study statistics of the past performance of the company and predict the future quarterly sales for years 2005 and 2006. In studying the past performance, the assignment compares the past quarterly sales through statistical parameters such as mean, median, quartiles, and bar chart. The future quarterly sales are predicted using regression analysis and moving average method. Quarterly Sales Comparison. Table 1 displays the past quarterly sales values for years from 2000 to 2004. The analysis focuses on sales in each quarter of years from 2000 to 2004. The data structure allows viewing dynamic of sales in a quarter through all four years as well as trend through four quarters of each year. Figure 2 shows that sales in q1, q2, q3, and q4 grew in every consecutive year with respect to the previous year. On the other hand, Figure 1 displays that sales in the second quarter in every year decreased with respect to the first quarter; however, it kept growing in q3, and q4. This implies the seasonal influence on sales of this product. Nevertheless, the general trend of sales per year demonstrates growth, which is also confirmed by the mean and median values displayed in Table 1 and Figure 3. Figure 3. Mean and Median growth per year due to sales growth Percentile and Quartile Comparison of Sales. The data set consists of 20 values. The company achieved 25 percentile in the fourth quarter of 2000; 50 percentile in the second quarter of year 2003, and 75 percentile in the third quarter of 2003 (see Table 2). The study reveals that it took 14 quarters to achieve first 50 percentile while the company achieved the second 50 percentile in 6 quarters. The growth should be considered as fast starting from the year 2003. In this year, the company achieved 17% growth in the third quarter with respect to second quarter. Summary of Data Set. Shown below histogram of the values of the data set along with the position of the mean, first quartile, second quartile, and third quartile. Figure 4. Data set summary Percentile 10 25 50 75 95 Quartile Q1 Q2 Q3   Values 683.48 890.58 1211.9 1671.53 2127.46 Date q1 / 2000 q4 / 2000 q2 / 2003 q1 / 2004 q3 / 2004 Table 2. Percentile and Quartile values Sales Prediction The sample data set consists of 30 values and it shows a trend of sales through five years. The aforementioned section provided an analysis of past trend, which are displayed in tables and graphs. This section focuses on the evaluation of quarterly sales for the next two years based on the history of previous sales. The future sales prediction is performed using regression analysis and time series technique. Regression Analysis. Regression analysis prediction is based on the interdependency of two variables; one is independent and the other is dependent. In this study, sales are the dependent variables that follow a seasonal trend, which is displayed in Figure 5. The seasonal trend in this analysis is considered as independent variable. The relation is presented through the straight-line equation Y = a + bX, where X represents the season and Y represent the sales. The dependent variables receive values from 1 through 28, where the values, from 1 through 20, display past sales, and from 21 through 28 displays the future values. The intercept “a” and the slope “b” are calculated using the past data; these values are used to predict the future sales. The results are shown in Table 3 and Figure 6. Figure 6. Sales prediction using Regress analysis Time Series Technique. Time series technique studies a history of sales through time; once the pattern is identified the future is projected according to that pattern (“Forecasting Theory”). This study uses moving average method to forecast 2005 and 2006 quarterly sales using time series technique. The method uses the following formula F t + 1 = (St + St-1 + St-2+ …….+ S t-N-1) / N; where: F t + 1 = Forecast for the period t+1; St-1 = Sales for the period t – 1, and N = Number of period in moving average Thus; A three-period moving will be F t+1 = (S t + S t-1+ S t-2) / 3 A four-period moving will be F t+1 = (S t + S t-1+ S t-2 + S t-3) / 4. This study conducted an analysis using 3-day, 4-day, and 5-day moving averages. The purpose is to locate the best suitable curve for forecasting sales. Table 4 and Figure 7 display the results of the calculations. The three curves were compared visually against the curve that represents the original data set. Though all three curves display a trend, however; the graphical observation demonstrates that the 4-day average curve is the best fit to the original data. The forecast sales for years 2005 and 2006 are accepted as follows: Moving Average Method q1 q2 q3 q4 2005 2175 2192 2328 2334 2006 2257 2278 2299 2292 Regression Analysis q1 q2 q3 q4 2005 2320 2413 2506 2598 2006 2691 2783 2876 2969 Work Cited “Forecasting Theory.” utexas.edu. The University of Texas at Austin, n.d. Web. 02 July 2013. http://www.me.utexas.edu/~jensen/ORMM/omie/operation/unit/forecast/moving_avg.html Read More
Cite this document
  • APA
  • MLA
  • CHICAGO
(“Statistical Parameters of the Company ABC Essay - 3”, n.d.)
Statistical Parameters of the Company ABC Essay - 3. Retrieved from https://studentshare.org/statistics/1622435-case-study
(Statistical Parameters of the Company ABC Essay - 3)
Statistical Parameters of the Company ABC Essay - 3. https://studentshare.org/statistics/1622435-case-study.
“Statistical Parameters of the Company ABC Essay - 3”, n.d. https://studentshare.org/statistics/1622435-case-study.
  • Cited: 0 times

CHECK THESE SAMPLES OF Statistical Parameters of the Company ABC

Statistical Significance of the Parameters

This paper contains data on statistical significance of the parameters.... Statistical Significance of the parameters If the p-values of each parameter are considered, it can be observed that for variables X1, X3, X4 and X5, the p-values are greater than the cutoff significant level of 0.... 5, therefore, these parameters are not considered as significant in predicting then manhours needed on individual basis.... The other three independent parameters i....
12 Pages (3000 words) Statistics Project

Analyze statistics reported in a news article, advertisement, or poll from a print source

In this regard, it is under public scrutiny in terms of maintaining an objective and unbiased stance to provide accurate information about the parameters consisting labor and its movement in the country.... ?? Carefully examine the conclusion to make sure it is supported by the statistical evidence.... As an independent statistical agency, BLS serves its diverse user communities by providing products and services that are objective, timely, accurate, and relevant” (BLS: About BLS, 2011, par....
2 Pages (500 words) Statistics Project

General statistic

The following report contains study results performed on 100 students of a university, who had been chosen randomly from different areas of the university and were enquired about their ages.... The data was collected has been presented in tabulated form in fig i and fig.... hellip; There are two basic types of data quantitative and qualitative....
5 Pages (1250 words) Statistics Project

Business Statistics and Application Solutions

he sample is consistent with the company's data if and only if the policy's time is within the sample's control limit.... The project "Business Statistics and Applications Solutions" compares relationship between performance ratings and number of trainings attended and it can be noted that the number of managers who performed better does not increase with the number of trainings....
6 Pages (1500 words) Statistics Project

Relationship between Output Per Worker and Working Hours

This paper 'Relationship between Output Per Worker and Working Hours" focuses on the fact that the hypothesis to be tested for the present research is as follows: More working hours and higher earnings lead to a higher output per worker within the mining industry.... nbsp;… The simplest way to find out the nature of the relationship between any two variables is to form a scatter diagram....
11 Pages (2750 words) Statistics Project

Interpretation of Statistical Tables

Results of the study are discussed in the following paragraphs in which four statistical tables were interpreted in detail. ... Results of the study are discussed in the following paragraphs in which four statistical tables were interpreted in detail.... he Kaiser-Meyer-Olkin (KMO) and Bartlett's tests are preliminary tests to evaluate the appropriateness of factor analysis as a statistical procedure for the given data set.... In many statistical software packages like the SPSS, a Sig....
2 Pages (500 words) Statistics Project

Statistics assignment

(10) Suppose that in a certain country commercial airplanes crashes occur at a rate of 1.... per year.... Assuming the frequency of crashes per year to be a Poisson random variable, find the probability that three or more crashes will occur next year.... Also, find the probability… (Hint: Let Y denote the interval length between consecutive occurrences of an event described by a Poisson distribution....
2 Pages (500 words) Statistics Project

Statistic paper

Consequently, this would assist in determining appropriate physicians for the hospital.... A case study was implemented, which utilized secondary data… A sample of 289 normal baby delivery patients was obtained.... There were four key variables of primary interest; charges, days, physician and payor....
6 Pages (1500 words) Statistics Project
sponsored ads
We use cookies to create the best experience for you. Keep on browsing if you are OK with that, or find out how to manage cookies.
Contact Us