StudentShare
Contact Us
Sign In / Sign Up for FREE
Search
Go to advanced search...
Free

Interpretation of Statistical Tables - Statistics Project Example

Cite this document
Summary
The study investigated the dimensions around which student-generated metaphors regarding language teachers are focused, using quantitative analysis and a questionnaire prepared with the help of students enrolled in a Russian Language course at the Universiti Malaysia Sabah. A…
Download full paper File format: .doc, available for editing
GRAB THE BEST PAPER92.4% of users find it useful
Interpretation of Statistical Tables
Read Text Preview

Extract of sample "Interpretation of Statistical Tables"

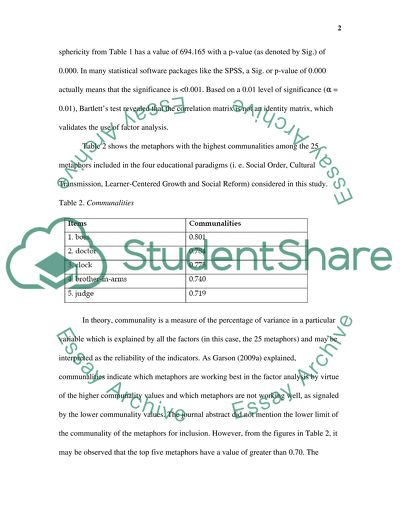
Measuring Metaphors: A Factor Analysis Conceptions of Language Teachers The study investigated the dimensions around which generated metaphors regarding language teachers are focused, using quantitative analysis and a questionnaire prepared with the help of students enrolled in a Russian Language course at the Universiti Malaysia Sabah. A total of 98 students from the same university voluntarily participated in the research inquiry. Data were statistically treated using factor analysis.1 Results of the study are discussed in the following paragraphs in which four statistical tables were interpreted in detail.

The Kaiser-Meyer-Olkin (KMO) and Bartlett’s tests are preliminary tests to evaluate the appropriateness of factor analysis as a statistical procedure for the given data set. Results of these two tests are shown in Table 1.Table 1. Kaiser-Meyer-Olkin and Bartlett’s tests The KMO test measures the adequacy of sampling. For the data set in this study, the KMO output value is 0.765 as shown in Table 1, which suggests that since KMO is greater than 0.5, factor analysis may be used. Meanwhile, the output of Bartlett’s test of sphericity from Table 1 has a value of 694.

165 with a p-value (as denoted by Sig.) of 0.000. In many statistical software packages like the SPSS, a Sig. or p-value of 0.000 actually means that the significance is

Read More
Cite this document
  • APA
  • MLA
  • CHICAGO
(“Interpretation of Statistical Tables Statistics Project - 1”, n.d.)
Interpretation of Statistical Tables Statistics Project - 1. Retrieved from https://studentshare.org/miscellaneous/1561349-interpretation-of-statistical-tables
(Interpretation of Statistical Tables Statistics Project - 1)
Interpretation of Statistical Tables Statistics Project - 1. https://studentshare.org/miscellaneous/1561349-interpretation-of-statistical-tables.
“Interpretation of Statistical Tables Statistics Project - 1”, n.d. https://studentshare.org/miscellaneous/1561349-interpretation-of-statistical-tables.
  • Cited: 0 times

CHECK THESE SAMPLES OF Interpretation of Statistical Tables

Statistical Significance of the Parameters

This paper contains data on statistical significance of the parameters.... statistical Significance of the Parameters If the p-values of each parameter are considered, it can be observed that for variables X1, X3, X4 and X5, the p-values are greater than the cutoff significant level of 0....
12 Pages (3000 words) Statistics Project

Statistical Foundations

… Table of Contents Page Description of the study 2 Detailed description of the statistical inference 3 Critique on inferential methods and tools used, and presentation of results 5 Other quantitative aspects in the study 9 Conclusion 10 References 11 Description of the study The study was all about understanding the pattern and enjoyment of daily activities among heterosexual couples.... Detailed description of the statistical inference ....
9 Pages (2250 words) Essay

Major Econometrics Issues and Multicolinarity

Therefore, it was used for interpretation as follows.... Your Full Name: Topic: Econometrics, Essay Subject: Question 1.... log(Urea Amount) = 9.... 60-0.... 82 log(Previous years application)-0.... 561 log (Urea Price)+0.... 59 log(Open Market Price of Paddy)- 0.... 61log(Wages)-0....
4 Pages (1000 words) Essay

SPSS as the Statistical Package Used for the Analysis

SPSS is the statistical package used for the analysis.... The The study is reduced to the involvement of only two ordinal variables and hence statistical designs using two-variables are only used to obtain results.... Two tasks were defined to compare the usage and importance given to the English language in private and state… The method of data collection is through an adaptation of a questionnaire about the learning and teaching of English vocabulary....
5 Pages (1250 words) Assignment

Statistical Analysis and Interpretation for Etisalat Telecom Corporation

The results are presented as follows: first, the descriptive results are shown in graphs and tables.... The analysis is based on a total of 826 questionnaire responses received.... The 668 questionnaires were received for sections A and B of the questionnaire while… The analysis was carried out using SPSS version 20....
10 Pages (2500 words) Essay

SPSS Statistics Project

These aspects include some basic terms, methods of data collection, data capturing and editing, statistical analysis, interpretation and report writing.... hellip; There are various statistical packages designed to carry out quantitative data analysis, the most widely used package is SPSS.... So according to given conditions we state that null hypothesis and alternative hypothesis will be The scales utilized within the test instruments will be designed to denote the use of detailed statistical algorithms on the collected data....
8 Pages (2000 words) Research Paper

Analysis of Statistical Methods

The paper "Analysis of statistical Methods" states that the Pearson coefficient of correlation was computed as -0.... he data matrix used in the statistical simulation is shown in Figure 1.... 15, which connotes an indirect or negative and almost negligible relationship which is not even statistically significant, between the extent of drug use and the level of recidivism....
7 Pages (1750 words) Case Study

Existing Relationships between the Response Variable: Sales and Four Independent Variables

"Existing Relationships between the Response Variable: Sales and Four Independent Variables" paper investigates the Number of full-timers, Number of part-timers, Total number of hours worked, and Salesfloor space of the store.... The paper looks at correlations and the multiple regression analysis....
6 Pages (1500 words) Assignment
sponsored ads
We use cookies to create the best experience for you. Keep on browsing if you are OK with that, or find out how to manage cookies.
Contact Us