StudentShare
Contact Us
Sign In / Sign Up for FREE
Search
Go to advanced search...
Free

Spectrophotometric Investigation of a First Order Reaction - Assignment Example

Cite this document
Summary
The paper “Spectrophotometric Investigation of a First Order Reaction” analyzes a first-order chemical reaction, which is one in which the rate of reaction is directly proportional to the concentration of a reactant. This is an experimental process of investigating the rate of a chemical reaction…
Download full paper File format: .doc, available for editing
GRAB THE BEST PAPER98.4% of users find it useful
Spectrophotometric Investigation of a First Order Reaction
Read Text Preview

Extract of sample "Spectrophotometric Investigation of a First Order Reaction"

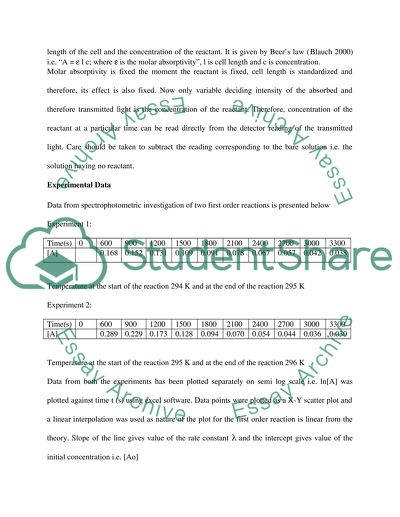
Spectrophotometric Investigation of a First Order Reaction Theory First Order Reaction A first order chemical reaction is one in which rate of reaction is directly proportional to concentration of a reactant. This can be schematically represented as A Products And rate of reaction is given as d[A] ⎯⎯⎯⎯⎯⎯⎯ = - λ[A] dt Where [A] is instantaneous concentration of A i.e. concentration of A tat time t and λ is the rate constant of the reaction. d[A] Therefore, ∫⎯⎯⎯⎯⎯ = - λ∫dt [A] Now integrating this between limits [A] = [Ao] at t = 0 and [A] at any point of time t the rate equation becomes ln[A] – ln[Ao] = - λt ; where ln is natural log of [A] This can be rearranged as ln[A] = - λt + ln[Ao] This is y = mx + c form of equation or a linear equation in [A] and time and values of the rate constant λ and initial concentration [Ao] is given by slope of the line and the intercept respectively. Spectrophotometric investigation of a reaction This is an experimental process of investigating rate of a chemical reaction. In this investigation a photon (light) source is used, light of this source is made to pass through a standard cell containing the reaction system an aqueous solution. Intensity of the transmitted light is measured by a detector. Amount of the absorbed light depends on the molar absorptivity of the reactant, length of the cell and the concentration of the reactant. It is given by Beer’s law (Blauch 2000) i.e. “A =  l c; where  is the molar absorptivity”, l is cell length and c is concentration. Molar absorptivity is fixed the moment the reactant is fixed, cell length is standardized and therefore, its effect is also fixed. Now only variable deciding intensity of the absorbed and therefore transmitted light is the concentration of the reactant. Therefore, concentration of the reactant at a particular time can be read directly from the detector reading of the transmitted light. Care should be taken to subtract the reading corresponding to the bare solution i.e. the solution having no reactant. Experimental Data Data from spectrophotometric investigation of two first order reactions is presented below Experiment 1: Time(s) 0 600 900 1200 1500 1800 2100 2400 2700 3000 3300 [A] 0.168 0.152 0.131 0.109 0.091 0.078 0.067 0.057 0.042 0.038 Temperature at the start of the reaction 294 K and at the end of the reaction 295 K Experiment 2: Time(s) 0 600 900 1200 1500 1800 2100 2400 2700 3000 3300 [A] 0.289 0.229 0.173 0.128 0.094 0.070 0.054 0.044 0.036 0.030 Temperature at the start of the reaction 295 K and at the end of the reaction 296 K Data from both the experiments has been plotted separately on semi log scale i.e. ln[A] was plotted against time t (s) using excel software. Data points were plotted as a X-Y scatter plot and a linear interpolation was used as nature of the plot for the first order reaction is linear from the theory. Slope of the line gives value of the rate constant λ and the intercept gives value of the initial concentration i.e. [Ao] Results: Experiment 1 Figure 1 shows variation of ln[A] vs time for Experiment 1. The close proximity of the data points from the linear interpolation line confirms that all the data points are very accurate. The same is confirmed by very high value of R2 which is 0.9929. One should note that value of R2 being 1 means all the data points will fall on the interpolation line. That is the ideal condition which never happens in actual experiments. The plot gives equation of the first order reaction as ln[A] = - 0.0006t – 1.3781 Comparing this with the general equation of first order reaction ln[A] = - λt + ln[Ao] derived above in the theory section one gets values of the rate constant λ and the initial concentration [Ao] as Rate constant (λ) = 0.0006 s-1 Initial concentration ln[Ao] = -1.3781 i.e. [Ao] = 0.252 There is another useful parameter half life (t1/2) associated with a first order reaction kinetics. This is the tie period during which concentration of the reactant is reduced to half of its original value. Value of half life (t1/2) can be calculated by putting [A] = [Ao]/2 and setting t as t1/2 in the integrated form of the rate equation derived above. This comes out to be t1/2 = 0.693/λ, where λ is the rate constant In experiment 1 value of the rate constant (λ) is 0.0006. Therefore, value of half life comes to be 1155 second. One should check in the experimental data whether really [A] is halving in every 1155s. What we find is that there is always some error. This error is nothing but the experimental error. Figure 1: Variation of ln[A] with time for experiment 1 The same procedure was adopted for extracting value of the rate constant and initial concentration from the data of experiment 2. Figure 2 shows the excel plot of ln[A] Vs time t for experiment 2. This is an X-Y scatter plot and imposed over the scatter plot is the linear interpolation line. Slope of the line gives the rate constant and intercept gives the initial concentration as in case of experiment 1. The values derived from the graph 2 is listed below Rate constant (λ) = 0.0009 s-1 Initial concentration ln[Ao] = -0.7456 i.e. [Ao] = 0.474 Half life t1/2 = 0.693/λ = 770 s The results for the two experiments are tabulated below Experiment 1 Experiment 2 Rate constant (λ) in s-1 0.0006 0.0009 Initial concentration [Ao] 0.252 0.474 Half life (s) 1155 770 Figure 2: Variation of ln[A] with time for experiment 2 Discussion: The experimental data for the two first order reaction shows very good fidelity with the linear interpolation line as indicated by the very high value of R2. This shows the experiment was carried out very carefully. The temperature variation during the experiment was just 1 Kelvin during the entire course of the experiment lasting close to one hour. This is also one of the reasons as why the experimenter could get such a good data. Although, there are always some sources of error during experiment and these errors are inherent with the experimental process. No one can get rid of these errors completely, one can only minimize them. This is the reason why all data points are not on the straight line, though the theoretical rate equation for the first order reaction predicts a perfect straight line. So what is the cause of error inherent in the spectrophotometric investigation used in this case? Well, in spectrophotometric process concentration of the reactant i.e. [A] is not measured directly rather what is measured as proxy of the concentration is the intensity of the absorbed light, that too is not measured directly rather it is calculated from the reading of the transmitted light intensity, which is measured directly. So, whatever is the error associated with measurement of the transmitted light intensity, goes directly into the error of the concentration reading. Now what causes error in these measurements? First the detector should collect the light for sufficiently long time so that the sample (intensity of light) is statistically acceptable and reproducible. For this to happen i.e. for the detector to collect sufficient light the collection time (t) will be different at different point of time (t), because concentration of the reactant [A] and therefore intensity of the transmitted light will be different at different point of time. One should keep in mind that while the transmitted light intensity is being collected the reaction does not stop rather it keeps moving at the rate guided by the rate constant and the instantaneous concentration [A]. Thus what one gets is an average concentration and not the instantaneous concentration. This is a source of error which is somehow built in the process itself. Another source of error could be change in molar aborptivity of the reactant with the concentration especially at lower concentration. Normally the reactant A decays and it produces some products which may interfere with the absorption process. While some correction may be employed, these corrections as well can be a potential source of error. Besides, sensitivity of the detector etc. also contribute to a very extent but these are now a days are taken care of by advancement in the instrumentation. Still, the data from the experiment 1 and 2 shows that the experiments were performed very carefully. Now coming to the results of experiments one and two; one can notice that rate constant of experiment 2 is 1.5 times that of experiment 1. This implies that reaction in experiment 2 is much faster than that in experiment 1. Also half life of experiment 2 is accordingly about two third of the half life in experiment 1. Conclusions: Rate constant for the first order reactions has been computed by plotting the available experimental data. Rate constant for the reaction in first experiment is 0.0006 while that of the reaction in the second experiment is 0.0009. The experimental data shows that the experiments were carried out very carefully as confirmed by very high value of R2 for both the plots. Reference David N. Blauch, 2000, ‘Spectrophotometry: Beer’s Law’, 9 May 2006, http://www.chm.davidson.edu/ChemistryApplets/spectrophotometry/BeersLaw.html Read More
Cite this document
  • APA
  • MLA
  • CHICAGO
(Spectrophotometric Investigation of a First Order Reaction Assignment, n.d.)
Spectrophotometric Investigation of a First Order Reaction Assignment. Retrieved from https://studentshare.org/chemistry/1536877-practical-chemistry-report
(Spectrophotometric Investigation of a First Order Reaction Assignment)
Spectrophotometric Investigation of a First Order Reaction Assignment. https://studentshare.org/chemistry/1536877-practical-chemistry-report.
“Spectrophotometric Investigation of a First Order Reaction Assignment”, n.d. https://studentshare.org/chemistry/1536877-practical-chemistry-report.
  • Cited: 0 times

CHECK THESE SAMPLES OF Spectrophotometric Investigation of a First Order Reaction

The Rationale behind Antibody Usage in Common Laboratory Assays

4 The Rationale behind Antibody Usage in Common Laboratory Assays Such As ELISA, Immunofluorescence, Immunohistochemistry, and Western Blotting, their Relative Advantages and Disadvantages Introduction The immune system produces antibodies in reaction to an assortment of foreign substances as well as infections in the body.... Any test concerning an antibody-antigen reaction is referred to as a serological test (Kudesia 2006, p.... The first step of monoclonal antibody production in rats involves injecting the rat with an antigen that elicits an immune response by production of antibody-forming cells....
11 Pages (2750 words) Essay

Adulterants in Toxicology Specimens

Bleach, chromate, nitrite, and hydrogen peroxide are viewed as effective urine adulterants sometimes with pH adjusting substances, for instance sodium bicarbonate or vinegar that are utilized by the illegal drug users in order to conceal the positive results of marijuana.... Name: Instructor: Course: Date: Adulterants in toxicology specimens For an experiment to be considered efficient so as to relay credible results, it must be free from any adulterations....
10 Pages (2500 words) Research Paper

Oral Colonization of Mutans Streptococci in Young Children

nbsp; It was observed during the course of investigation that children acquired MS by horizontal as well as vertical transmission.... It was observed during the course of investigation that children acquired MS by horizontal as well as vertical transmission.... The aim of this study was to evaluate influence of host and bacterial factors on oral colonization by MS in young children....
15 Pages (3750 words) Research Paper

Annotated Bibliography

47The article provides the results of investigation by the Genetic Epidemiology unit in Brisbane, Queensland, Australia.... It shows how the genetic studies of pigmentation have benefited from the spectrophotometric measures of light to dark hair color.... According to the studies, the investigations concerning the hair color have turned to the spectrophotometric measurements, as well as the biochemical quantification.... In using spectrophotometric methods, a wavelength of 650nm is used as it has the greatest power to differentiate the different amounts of dermal melanin....
2 Pages (500 words) Research Paper

Genetics and Society

According to the Federal Bureau of Investigations, as of the year 2013, over two hundred thousand cases used DNA evidence to facilitate criminal investigations.... On the other hand, DNA evidence… as also been used to exonerate wrongly accused individuals, and several of them were in death row (Dnaforensics....
8 Pages (2000 words) Essay

Spectrophotometer & Immunochemistry

In order to understand the mechanics of spectrophotometry, it is very imperative to discuss the underlying fundamentals associated with this technique.... The paper "Spectrophotometer & Immunochemistry" states that there are different versions of a spectrophotometer, and on the other hand, there are different examples of immunoassays, such as radioimmunoassay, fluorescence immunoassay, etc (Geddes, pp....
8 Pages (2000 words) Coursework

Forensic Science as a Very Important Element in Law Enforcement and Administration of Justice

nbsp;… The ancient Chinese people were the first people to use fingerprint technology for purposes of identifying business documents.... This paper "Forensic Science as a Very Important Element in Law Enforcement and Administration of Justice" focuses on the fact that the evolution of forensic science can be traced to thousands of years ago....
7 Pages (1750 words) Report

Fire Investigation and Fire Prevention

… The paper "Fire investigation and Fire Prevention" is a brilliant example of a term paper on social science.... The paper "Fire investigation and Fire Prevention" is a brilliant example of a term paper on social science.... He could utilize the powers by limiting the access of other people in to and out of the building once the investigation begins....
6 Pages (1500 words) Term Paper
sponsored ads
We use cookies to create the best experience for you. Keep on browsing if you are OK with that, or find out how to manage cookies.
Contact Us