StudentShare
Contact Us
Sign In / Sign Up for FREE
Search
Go to advanced search...

Handling Data Comparing height and weight for Mayfield High School - Essay Example

Cite this document
Summary
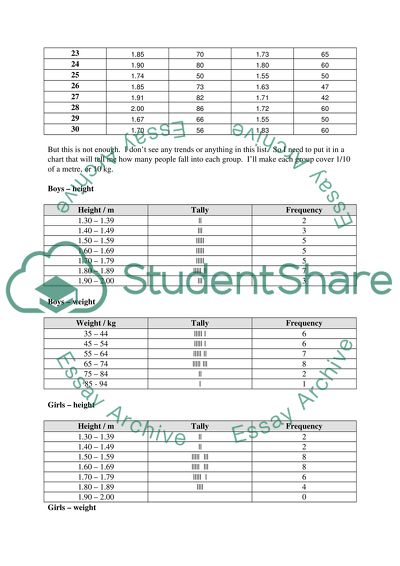
I could use the entire table, but it is so large that I could very quickly make mistakes. So, in order to begin, I need a random sample of data. I collected a random sample of data for 30 boys and 30 girls as shown below in the table.
But this is not enough…
Download full paper File format: .doc, available for editing
GRAB THE BEST PAPER94% of users find it useful
Handling Data Comparing height and weight for Mayfield High School
Read Text Preview

Extract of sample "Handling Data Comparing height and weight for Mayfield High School"

Download file to see previous pages

But if I can turn this into a picture, I can then compare the boys data with the girls data.Heights of Boys and GirlsAnd to compare boys and girls, I can put them both on the same graph.It looks like more boys are taller than girls, which I think is normal. I can do the same for weight. Weight of Boys and GirlsAnd to compare the weights of boys and girls:From the graph above it seem that boys have a weight that is more spread out. Girls seem to be closer together, and don't seem to weigh more than 74 kg.

It looks like the boys also weigh more, which makes sense if their taller.Stem and LeafSince I already grouped all the data, I can record it in stem and leaf diagrams. That way, I can more easily find the median and the mode.Boys HeightStemLeafFrequency1.302, 221.405, 8, 831.500, 2, 3, 4, 851.600, 2, 5, 5, 751.700, 2, 2, 4, 551.800, 0, 0, 2, 5, 5, 671.900, 122.0001The mean height is easily found by adding up all the heights and dividing by 30. Adding up all the heights comes to 50.13, and dividing by 30 gives 1.67m. I can also find the median, which should be between the 15th and 16th numbers (written in pink), so it's 1.

685, which rounds to 1.69. And the mode is the number that occurs most frequently, which is 1.80 (in red).Boys WeightStemLeafFrequency3081400, 2, 3, 4, 4, 5, 7, 88500, 2, 4, 6, 6, 7, 8, 98602, 4, 6, 6, 8, 96700, 2, 2, 34800, 2, 63900I can get the mean, median and mode for boys weights the same way. The mean is the addition of all the weights divided by 30, which means 1763/30 or 58.767, which rounds to 58.8kg. The median is between the 15th and 16th numbers which is 57.5kg. There are 4 modes: 44, 56, 66, and 72.Girls. I can also see that boys tend to be taller than girls.

But if I can turn this into a picture, I can then compare the boys data with the girls data. From the graph above it seem that boys have a weight that is more spread out. Girls seem to be closer together, and don't seem to weigh more than 74 kg. It looks like the boys also weigh more, which makes sense if their taller. The mean height is easily found by adding up all the heights and dividing by 30. Adding up all the heights comes to 50.13, and dividing by 30 gives 1.67m. I can also find the median, which should be between the 15th and 16th numbers (written in pink), so it's 1.

685, which rounds to 1.69. And the mode is the number that occurs most frequently, which is 1.80 (in red). I can get the mean, median and mode for boys weights the same way. The mean is the addition of all the weights divided by 30, which means 1763/30 or 58.767, which rounds to 58.8kg. The median is between the 15th and 16th numbers which is 57.5kg. There are 4 modes: 44, 56, 66, and 72. The range that holds the mode for boys and girls is the same in both cases. This is probably because boys height is more spread out than girls.

It could also be because there is a mistake in the sampling. Since there are more than one mode for boys weight, there's not a lot I can so about it.

...Download file to see next pages Read More
Cite this document
  • APA
  • MLA
  • CHICAGO
(“Handling Data Comparing height and weight for Mayfield High School Essay”, n.d.)
Handling Data Comparing height and weight for Mayfield High School Essay. Retrieved from https://studentshare.org/miscellaneous/1513245-handling-data-comparing-height-and-weight-for-mayfield-high-school
(Handling Data Comparing Height and Weight for Mayfield High School Essay)
Handling Data Comparing Height and Weight for Mayfield High School Essay. https://studentshare.org/miscellaneous/1513245-handling-data-comparing-height-and-weight-for-mayfield-high-school.
“Handling Data Comparing Height and Weight for Mayfield High School Essay”, n.d. https://studentshare.org/miscellaneous/1513245-handling-data-comparing-height-and-weight-for-mayfield-high-school.
  • Cited: 0 times

CHECK THESE SAMPLES OF Handling Data Comparing height and weight for Mayfield High School

Handling Data Mayfield High

Based on the provided data for students at mayfield high school in grades 7 to 11, I chose to investigate whether there is a relationship between height and weight of students.... Steam and leaf diagrams were used to obtain summary statistics and draw certain conclusions about the samples. To test the hypothesis that there is a positive correlation between the height and the weight and "the taller a person the more they weigh", I used scatter plots and cumulative frequency diagrams....
14 Pages (3500 words) Research Paper

Data Handling Checklist

The research paper "data Handling Checklist" is purposed to give an instruction in creating a data handling checklist.... … On the task to design and use a questionnaire to collect data comprised of open and closed questions, the author offers a questionnaire to collect data about left-handedness as a solution.... Use data collection sheets to record data from a practical exercise (e....
11 Pages (2750 words) Research Paper

Flight Situation in the Case of Coleen Colombo

hellip; He is capable of handling the situation.... The essay "Fight or Flight" states that Fight or flight is an instant reflex through which the brain detects an imminent danger or threat, which can either be imagined or real.... This stress response makes it possible for an individual to confront a situation....
1 Pages (250 words) Essay

Relationship between height and weight of mother birth weight

In order to analyze the relationship between the height and weight of the mothers, I will plot the scatter graphs, cumulative frequency curve and box plot together with statistical values such as mean, mode, range and median (Cleveland, 1994).... Scatter graphs, frequency curve and box plots together with statistical measure such as mean, median and mode were used to… The samples obtained were statistically fair and the investigation confirmed our hypothesis that taller women weigh more than shorter women. In this statistical investigation, my main aim is to find out if a relationship exist between weight and height of the The study of these two quantities among mothers just after giving birth is very important as these are the quantities that is used to calculate the body mass index used for health check (Taylor, 2010, p....
4 Pages (1000 words) Essay

Height and the Weight of the Mother, with structure

Mother's with a high BMI tend to have longer gestation period.... As the age increases, the height increases and the weight increase too.... Taller mothers have a higher BMI than the shorter, thus the height of the mother has an effect on the weight of the mother and has a direct correlation with the BMI.... The BMI effect on gestation period can be traced to weight factor; thus mother's who have a higher BMI have a probability of having longer gestation period....
3 Pages (750 words) Lab Report

Maximum height of a projectile motion

The data was tabulated,… and graphs were drawn and analyzed to find the dependence of maximum height reached by a body in projectile on initial velocity and angle of elevation. According to the fundamental laws of physics, when a body if projected into the air, its trajectory motion in determined by Since the gravitational pull acts downwards (vertical sense) then the horizontal and vertical components can be treated separately.... Thus, the maximum height traveled by the body upwards can be calculated (Warren 73)....
5 Pages (1250 words) Lab Report

Healthy Body Weight

Reportedly, the weight for Height Table gives an average range of pounds based on gender.... The present paper "Healthy Body weight" points out that Body Mass Index (BMI) can best be described as your total weight.... Nowadays, however, in regards to weight loss diets, this chemical reaction can be seen as both a hindrance and a help; as a hindrance, the chemical reaction can cause a chemical imbalance, which makes a person feel good about how much weight they have lost....
6 Pages (1500 words) Coursework

Body Size and Weight Management

The author of the current paper "Body Size and weight Management" points out that aspects of Wellness involved in Body Size and weight Management are physical dimensions of maintaining an adequate level of body fat and intellectual awareness to analyze the media messages being given....
16 Pages (4000 words) Coursework
sponsored ads
We use cookies to create the best experience for you. Keep on browsing if you are OK with that, or find out how to manage cookies.
Contact Us