StudentShare
Contact Us
Sign In / Sign Up for FREE
Search
Go to advanced search...
Free

Applicability of GBM Model on Daily Share Prices of Bunzl PLC - Report Example

Cite this document
Summary
The report "Applicability of GBM Model on Daily Share Prices of Bunzl PLC" critically analyzes the share price of a UK or international company to determine whether the company's daily closing share prices follow the Geometric Brownian motion (GBM) model…
Download full paper File format: .doc, available for editing
GRAB THE BEST PAPER94.3% of users find it useful
Applicability of GBM Model on Daily Share Prices of Bunzl PLC
Read Text Preview

Extract of sample "Applicability of GBM Model on Daily Share Prices of Bunzl PLC"

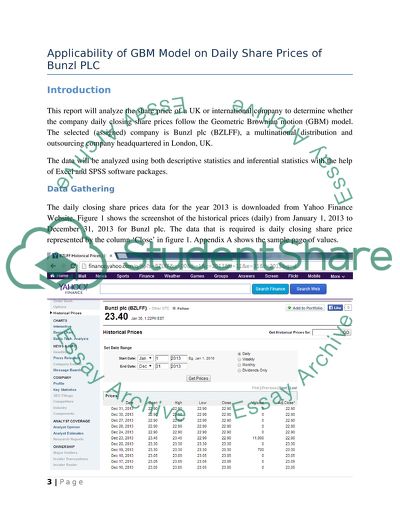
MA5040 – Financial Mathematics with Statistics 2 work 14 Applicability of GBM Model on Daily Share Prices of Bunzl PLC Submitted by: Submission Deadline: End of Week 17 (Friday 7 February 2014) Contents Introduction 3 Data Gathering 3 Data Analysis and Results 4 Time Series Analysis of the Daily Closing Share Prices 4 Daily Return 4 Normalized Daily Return 5 Histogram and Cumulative Frequency Graph 5 Test for Normality using a Q-Q (quantile-quantile) plot 7 Kolmogorov-Smirnov Test for Normality 8 Chi-square test of Independence 10 Hypothesis Test 11 Summary of Results and Conclusions 14 References 15 Appendix A: Data 16 Applicability of GBM Model on Daily Share Prices of Bunzl PLC Introduction This report will analyze the share price of a UK or international company to determine whether the company daily closing share prices follow the Geometric Brownian motion (GBM) model. The selected (assigned) company is Bunzl plc (BZLFF), a multinational distribution and outsourcing company headquartered in London, UK. The data will be analyzed using both descriptive statistics and inferential statistics with the help of Excel and SPSS software packages. Data Gathering The daily closing share prices data for the year 2013 is downloaded from Yahoo Finance Website. Figure 1 shows the screenshot of the historical prices (daily) from January 1, 2013 to December 31, 2013 for Bunzl plc. The data that is required is daily closing share price represented by the column ‘Close’ in figure 1. Appendix A shows the sample page of values. Figure 1: Screenshot of historical prices from January 1, 2013 to December 31, 2013 Data Analysis and Results Time Series Analysis of the Daily Closing Share Prices Figure 2 shows the time series graph for the Bunzl plc (BZLFF) daily closing share prices for the year 2013. As shown in figure 2, an increasing trend is evident from the time series graph. The lowest share price value of £16.27 is in January and the highest share price value of £23.30 is in December. From January to December the share prices fluctuates, however, there is always an increasing trend in daily share prices. The average daily closing share price is £20.28 and varies from the mean by about £1.66. Figure 2: Bunzl plc (BZLFF) daily closing share prices for the year 2013 Daily Return The daily return (relative daily change in prices), R is calculated using below formula: The calculated daily return data values are shown in ‘Relative Daily Return’ column in Appendix A. The sample mean daily return of the Bunzl plc shares for year 2013 is about 0.001376 (or 0.1376%) and sample standard deviation is about 0.009390 (or 0.939%). Normalized Daily Return The next step is to normalize the daily return values, Rnorm using: , Where and SD are sample mean and standard deviation, respectively. The calculated normalized daily return data values are shown in ‘Normalized Daily Return’ column in Appendix A. Histogram and Cumulative Frequency Graph Figure 3 shows the histogram of normalized daily return using SPSS. As shown in figure 3, there appears that the distribution of daily return is not normal. The distribution of daily return is positively (right) skewed with peaked distribution (leptokurtic). Figure 3: Histogram of normalized daily return Table 1 shows the cumulative frequency table for the normalized daily return. Most (90.04%) of the daily return is between -0.50 and 0 standard deviation from the mean daily return. Figure 4 shows the cumulative frequency graph of normalized daily return. Table 1: Cumulative frequency table Normalized Daily Return (Bin) Frequency Cumulative Frequency Cumulative % -3.50 1 1 0.40% -3.00 1 2 0.80% -2.50 1 3 1.20% -2.00 2 5 1.99% -1.50 2 7 2.79% -1.00 2 9 3.59% -0.50 2 11 4.38% 0.00 215 226 90.04% 0.50 4 230 91.63% 1.00 5 235 93.63% 1.50 3 238 94.82% 2.00 0 238 94.82% 2.50 3 241 96.02% 3.00 5 246 98.01% 3.50 2 248 98.80% 4.00 1 249 99.20% 4.50 0 249 99.20% 5.00 0 249 99.20% 5.50 0 249 99.20% 6.00 1 250 99.60% 6.50 0 250 99.60% 7.00 0 250 99.60% 7.50 0 250 99.60% 8.00 1 251 100.00% Total 251     Figure 4: Cumulative frequency graph of normalized daily return Test for Normality using a Q-Q (quantile-quantile) plot Figure 5 shows the normal Q-Q plot of normalized daily return. Figure 5: Normal Q-Q plot of normalized daily return As shown in Q-Q plot, most of the data values deviate from the straight line. This suggests that the normality assumption is in doubt. That is, reject the hypothesis of normality since Q-Q plot is not approximately linear. Kolmogorov-Smirnov Test for Normality The null and alternate hypotheses tested are H0: Daily return is normally distributed. H1: Daily return is NOT normally distributed. The selected significance level, α is 0.05. Using SPSS, the results of the tests of normality is presented in table Table 2: Tests of normality Tests of Normality Kolmogorov-Smirnova Shapiro-Wilk Statistic df Sig. Statistic df Sig. Normalized Daily Return .455 251 .000 .434 251 .000 a. Lilliefors Significance Correction Using the Kolmogorov–Smirnov test of normality: p-value < 0.001 Conclusion: The data provide sufficient evidence, at the 5% significance level, to reject H0. Thus, there is sufficient evidence that the daily return data are NOT normally distributed. Hence, do not accept the assumption that the daily return data may be normally distributed. Using the Shapiro-Wilk test of normality gives the same result. Chi-square test of Independence A Chi-square Test of Independence will be performed to determine whether a gain or loss from one day to the next is independent of what has happened the day before. The daily return is calculated using the log of ratios of successive prices. Daily return (Log) = The calculated daily return data values are shown in ‘Log’ column in Appendix A. Under geometric Brownian motion, the daily return (Log) would be independent and identically distributed normal random variables (Ross, 2011). A Chi-square Test of Independence can be performed on cross-tabulated data. Therefore, the Log values need to be categorized in a contingency (cross tabulation) table. This can be done as below: The daily return (Log) will be classified as being one of four possible states small loss (SL), big loss (BL), small profit (SP) and big profit (BP) as follows: 1. BL if Log ≤ -0.01, 2. SL if -0.01 < Log ≤ 0, 3. SP if 0 < Log ≤ 0.01, 4. BP if Log > 0.01. A formula is written in Excel to categorize the data into specified group as shown below: fx =IF(E3 0.05 The decision is to Not reject H0, as p-value = 0.449 > 0.05. The test statistic value of 8.870 is less than the critical value of 16.919. Conclusion: The data provide no evidence, at the 5% significance level, to reject H0. Thus, there is no evidence to reject the hypothesis that a gain or loss from one day to the next is independent of what has happened the day before. Summary of Results and Conclusions This report analyzed Bunzl plc (BZLFF) daily closing share prices data from January 1, 2013 to December 31, 2013, using appropriate statistical methods, to determine whether the data follows the Geometric Brownian motion model. Under geometric Brownian motion, the daily return would be independent and identically distributed normal random variables (Ross, 2011). In other words, if the data follows a GBM model, a gain or loss from one day to the next is independent of what has happened the day before. Time series analysis of closing price indicated that there is a continuous increasing trend in the share price. The low (£16.27) and peak (£23.30) value of share prices are in January and December, respectively. The average daily closing share price is £20.28 and varies from the mean by about £1.66. The sample mean daily return of the Bunzl plc shares for year 2013 is about 0.001376 (or 0.1376%) and sample standard deviation is about 0.009390 (or 0.939%). Most (90.04%) of the daily return is between -0.50 and 0 standard deviation from the mean daily return. A histogram of normalized daily return indicated that the distribution of daily return is positively (right) skewed with peaked distribution (leptokurtic). A Q-Q plot of normalized daily return also indicated that the distribution of daily return is not normal. Furthermore, the Kolmogorov–Smirnov test of normality indicated that the daily return data are NOT normally distributed (p < 0.001). To determine whether a gain or loss from one day to the next is independent of what has happened the day before, a Chi-square Test of Independence is conducted using both Excel and SPSS. The results of the Chi-square test is not significant, χ2 (9) = 8.87, p = 0.449 (> 0.05). Thus, there is no evidence to reject the hypothesis that a gain or loss from one day to the next is independent of what has happened the day before. In conclusion, Bunzl plc (BZLFF) daily closing share prices data from January 1, 2013 to December 31, 2013 partially follows the Geometric Brownian motion model. This is because a gain or loss from one day to the next is independent of what has happened the day before, however, the distribution of daily return is not normal. References Anon., n.d. Bunzl plc (BZLFF). [Online] Available at: http://finance.yahoo.com/q?s=BZLFF [Accessed 3 February 2013]. Ross, S. M., 2011. An Elementary Introduction to Mathematical Finance. 3rd ed. Cambridge: Cambridge University Press. Appendix A: Data Date Closing Share Price Relative Daily Return Normalized Daily Return Log Group Category 02/01/2013 16.39           03/01/2013 16.62 0.014033 1.348 0.0139 BP   04/01/2013 16.62 0.000000 -0.147 0.0000 SL BP, SL 07/01/2013 16.27 -0.021059 -2.389 -0.0213 BL SL, BL 08/01/2013 16.27 0.000000 -0.147 0.0000 SL BL, SL 09/01/2013 16.27 0.000000 -0.147 0.0000 SL SL, SL 10/01/2013 16.77 0.030731 3.126 0.0303 BP SL, BP 11/01/2013 16.94 0.010137 0.933 0.0101 BP BP, BP 14/01/2013 16.97 0.001771 0.042 0.0018 SP BP, SP 15/01/2013 17.09 0.007071 0.606 0.0070 SP SP, SP 16/01/2013 17.09 0.000000 -0.147 0.0000 SL SP, SL 17/01/2013 17.26 0.009947 0.913 0.0099 SP SL, SP 18/01/2013 17.26 0.000000 -0.147 0.0000 SL SP, SL 22/01/2013 17.26 0.000000 -0.147 0.0000 SL SL, SL 23/01/2013 17.26 0.000000 -0.147 0.0000 SL SL, SL 24/01/2013 17.26 0.000000 -0.147 0.0000 SL SL, SL 25/01/2013 17.26 0.000000 -0.147 0.0000 SL SL, SL 28/01/2013 17.26 0.000000 -0.147 0.0000 SL SL, SL 29/01/2013 17.26 0.000000 -0.147 0.0000 SL SL, SL 30/01/2013 17.26 0.000000 -0.147 0.0000 SL SL, SL 31/01/2013 17.75 0.028389 2.877 0.0280 BP SL, BP --- --- --- --- --- --- --- --- --- --- --- --- --- --- --- --- --- --- --- --- --- 20/12/2013 23.3 0.000000 -0.147 0.0000 SL BP, SL 23/12/2013 22.9 -0.017167 -1.975 -0.0173 BL SL, BL 24/12/2013 22.9 0.000000 -0.147 0.0000 SL BL, SL 26/12/2013 22.9 0.000000 -0.147 0.0000 SL SL, SL 27/12/2013 22.9 0.000000 -0.147 0.0000 SL SL, SL 30/12/2013 22.9 0.000000 -0.147 0.0000 SL SL, SL 31/12/2013 22.9 0.000000 -0.147 0.0000 SL SL, SL Source: http://finance.yahoo.com/q?s=BZLFF Read More
Cite this document
  • APA
  • MLA
  • CHICAGO
(Applicability of GBM Model on Daily Share Prices of Bunzl PLC Report Example | Topics and Well Written Essays - 2000 words, n.d.)
Applicability of GBM Model on Daily Share Prices of Bunzl PLC Report Example | Topics and Well Written Essays - 2000 words. https://studentshare.org/mathematics/1807836-work
(Applicability of GBM Model on Daily Share Prices of Bunzl PLC Report Example | Topics and Well Written Essays - 2000 Words)
Applicability of GBM Model on Daily Share Prices of Bunzl PLC Report Example | Topics and Well Written Essays - 2000 Words. https://studentshare.org/mathematics/1807836-work.
“Applicability of GBM Model on Daily Share Prices of Bunzl PLC Report Example | Topics and Well Written Essays - 2000 Words”. https://studentshare.org/mathematics/1807836-work.
  • Cited: 0 times

CHECK THESE SAMPLES OF Applicability of GBM Model on Daily Share Prices of Bunzl PLC

The Competitive Position of Kellogg

As per Porter's Five Forces model, the collective strength of the five forces decide the final profit making capacity in an industry.... Opportunities: Kellogg is an old company firmly placed in the business of food products – ready to eat cereals, cookies and snacks known as convenience foods worldwide, and is rooted well in North America....
4 Pages (1000 words) Admission/Application Essay

Huey Long Share of Wealth 1935

This meant that (Your Huey Long share of Wealth 1935 Louisiana's governor Huey Long became very popular and a huge amount of population followed him because of his services for the state.... Later his relationship with the president ended and he initiated a nationwide movement called “share Our Wealth”.... The details of Long's share of Wealth movement are as follows:Long proposed that each family was to be aided with an income of at least one third of the amount of average family capital (Edsforth 208)....
1 Pages (250 words) Admission/Application Essay

IBM Corporation Case Update

The earnings per share of IBM during the June 2000 quarter was $1.... There several reasons that could cause an earning per share to increase.... Revenue and net income growth can cause the earnings per share metric to increase.... The formula to calculate return of equity is net income divided by total equity....
1 Pages (250 words) Admission/Application Essay

Economic Growth or Unemployment Rate or Discourage Workers

An economic growth model can be made applicable in explaining and measuring the impacts caused on prices of goods and services in the market, due to changes in the price of one commodity.... As the prevailing… prices of energy rises due to their reduction in the supply level, an economic growth model offers critical lessons in estimating the impacts of different factors, after which we determine the impacts of the market general price levels. An increase in the price level of a Economic Growth An economic growth model can be made applicable in explaining and measuring the impacts causedon prices of goods and services in the market, due to changes in the price of one commodity....
2 Pages (500 words) Admission/Application Essay

Shark Tank as the Next-Step Reality Show

When the “sharks” in “Shark Tank” come across a good business opportunity or idea, they become excited and jointly seek a share in the business through capital, profits, and/or share propositions.... The following essay “Shark Tank as the Next-Step Reality Show” will discuss the ABC's show “Shark Tank”, which depicts aspiring entrepreneurs presenting their business ideas, companies or opportunities to a cluster of high net worth businesspersons....
2 Pages (500 words) Admission/Application Essay

Palm Beach Real Estate Listings by Top Florida Company Lowered in Sale Price

n the article, the author is trying to inform the reader how Palm Beach Real Estate has lowered the prices of its listings with the hope of increasing the company's sales.... But based on the information that previously the sales were low due to high prices, this movement is likely to increase the sales of the company due to reduced prices of the listings.... He reviewed the recent performance of the company and what caused such low performance (high prices of listings) and this justifies his recommendations about the effect of lowered prices on the company's future sales....
2 Pages (500 words) Admission/Application Essay

Spending Figures

Instead of containing costs through access restrictions, Japan tends to set its health care prices in order to ensure that its total health spending remain within its budget.... The average daily hospital stay cost in any US hospital is almost $4,287 as compared to Japan's $320.... Unlike the United States, Japan tends to offer an interesting model in terms of its health care....
2 Pages (500 words) Admission/Application Essay

New Beginnings- From Ship to shore

This allows every student to share their growing personality with others and get the mutual benefits from them as well.... It is a way of life, a philosophy, a perspective of a certain kind.... My life in the Navy is a valuable never-ending lesson that reveals to me my own strengths, goals, and opportunities....
2 Pages (500 words) Admission/Application Essay
sponsored ads
We use cookies to create the best experience for you. Keep on browsing if you are OK with that, or find out how to manage cookies.
Contact Us