StudentShare
Contact Us
Sign In / Sign Up for FREE
Search
Go to advanced search...
Free

Step-By-Step Guide for Increasing the Market Share of a Software Development Company - Case Study Example

Cite this document
Summary
The paper  "Step-By-Step Guide for Increasing the Market Share of a Software Development Company" offers an action plan - from the initial stage (raising customer awareness), through a distribution strategy aimed at penetrating the market, up to a sharp increase in market share and getting into the top three…
Download full paper File format: .doc, available for editing
GRAB THE BEST PAPER93.1% of users find it useful
Step-By-Step Guide for Increasing the Market Share of a Software Development Company
Read Text Preview

Extract of sample "Step-By-Step Guide for Increasing the Market Share of a Software Development Company"

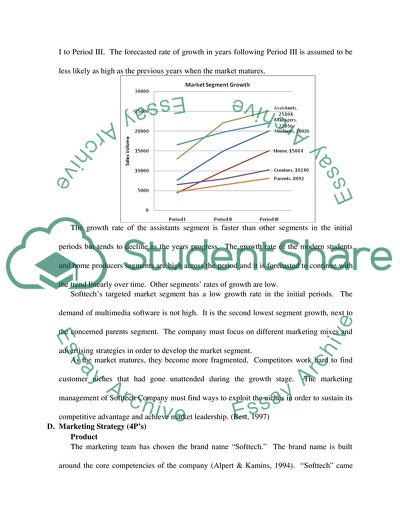
Marketing Game Report – SOFTTECH I. Findings A. Target Market Softtech Company targets the professional creators particularly the creative artists. The end-users are mostly designers, photographers and other creative originators. This market segment relies on the software to produce better products and save on time. These types of customers are mostly innovators. They seek speed and special commands for advance capabilities. They are also confident and experienced users of different kinds of software. Professional creators invest on products that meet their needs and expectations of time-savings, functionality and capability. B. Size of Market The professional creator market segment accounts for ten percent of the total sales in multimedia software. Other segments of the multimedia market include the modern students, home producers, harried assistants, high-tech managers and concerned parents where the size of the segments are 20 %, 15 %, 25 %, 22% and 8 % of the total multimedia sales, respectively. The market segments are best illustrated in the pie chart below. C. Growth Trends Market analysts see a continuing growth for a decade or so in industry sales of multimedia software. The individual trends of the growing market segments are reflected on the line graph below. The data available spotlights the growth period of the market on Period I to Period III. The forecasted rate of growth in years following Period III is assumed to be less likely as high as the previous years when the market matures. The growth rate of the assistants segment is faster than other segments in the initial periods but tends to decline as the years progress. The growth rate of the modern students and home producers segments are high across the period and it is forecasted to continue with the trend linearly over time. Other segments’ rates of growth are low. Softtech’s targeted market segment has a low growth rate in the initial periods. The demand of multimedia software is not high. It is the second lowest segment growth, next to the concerned parents segment. The company must focus on different marketing mixes and advertising strategies in order to develop the market segment. As the market matures, they become more fragmented. Competitors work hard to find customer niches that had gone unattended during the growth stage. The marketing management of Softtech Company must find ways to exploit the niches in order to sustain its competitive advantage and achieve market leadership. (Best, 1997) D. Marketing Strategy (4P’s) Product The marketing team has chosen the brand name “Softtech.” The brand name is built around the core competencies of the company (Alpert & Kamins, 1994). “Softtech” came from two words, software and technology which suggest that the company is software and technology development. For many consumers and business-to-business acquisitions, customers are influence by the status of a brand name and the assurance it gives them. (Blackett, 2003) The development of product is critical to the survival and growth of a business. Product development of Softtech was sourced from inputs of customers, engineering, research and development, sales, manufacturing, accounting, and competitors. (Calantone, Benedetto, & Bhoovaraghan, 1994) However, professional creators are expert users with vast experience in other software and demands fast applications. They don’t need much protection against user errors. For Softtech to increase the speed, it has smaller protections against user errors. As a segment of frequent multimedia software users, the creative artists know the basic operations of the software and are fast learners of new applications. The ease of learning for Softtech Software is low on initial product launch on period I. However, ease of learning increases onwards as the number of special command increases. Below is the evolution of the feature index of the product as time progresses, the demand increases and customer preferences changes. The product modifications are made in response to external factors such as technology upgrades and customer feedbacks. The increasing index of special commands are the requirements suggested by end-users. Evolution of Product Features of Softtech Features Period I Period II Period III Period IV Period V Special Commands 8 9 10 11 12 Error Protection 3 4 5 6 6 Ease of Learning 3 4 5 6 7 Place Distribution strategy of Softtech involves two types of channels that serve different types of customers. Channel 1 involves full-service dealers that have well-trained personnel that provide technical information, distribution and personalised service before and after sales. Full-service dealers are market pioneers that serve local customers, thereby; tapping their services create a competitive advantage for software producers like Softtech Company. Points of sale are mostly in-store sales from dealers who are either independent or part of a larger chain of stores. Channel 2 includes discount dealers who utilises the Internet or mail-order catalogues for purchases. They offer lower prices because of their lower economies of scales. Price-sensitive customers tend to employ the services of discount dealers. However, discount dealers are primarily order takers with limited technical and after sales services. They have more rigid policies concerning product returns and usually experience delays in getting repairs. The intensity of distribution involving the two channels are summarised in the bar graph below. The distribution strategy and the dollar invested on customer service helped Softtech increase its market share in both channels.   Period I Period II Period III Period IV Period V Channel 1           Units sold 12,614 14,309 19,612 19,898 16,382 Gross Sales ($) 1,261,400 1,430,900 1,941,588 2,089,290 1,965,840 Market Share 23% 24% 28% 27% 25%             Channel 2           Units sold 14,319 16,605 21,620 23,056 38,819 Gross Sales ($) 1,431,900 1,660,500 2,140,380 2,420,880 4,658,280 Market Share 26% 27% 31% 28% 36%             Customer Service ($) 92,000 75,000 50,000 30,000 50,000 Promotion Personal Selling Softtech Company employs twenty sales representatives that serve the channels. The company maintains the number of sales representatives over the periods since it was perceived as the optimum number to effectively serve the channels. The sales representatives sell products to the dealers who then sell to its respective customers. There tasks involve getting order from current dealers and develop new accounts. Negotiation and persuasion skills are required in order to push the Softtech brand. Other support tasks, include explaining technical details, After year five, the number of sales personnel for channel 1 is nine while for channel 2 is eleven. Advertising Strategy The advertising expense allocated by Softtech during the first year of the growth stages is over 9% of the gross sales or almost 29% of the total operating expenses. This cost of advertising is appropriate since the company is aiming at gaining market share. Over the years, the expenses incurred in advertising increased in absolute amount from $250,000 initially to $300,000 at the end of period five. The increase in allocated advertising dollars is due to the increasing demand of the market. However, the ratio of advertising to the total revenue decreased to less than 5% or less than 25% of the total operating expenses. The bar graph below illustrates the effectiveness of the advertising strategy with respect to the market share of Softtech Company. Price The pricing strategy of Softtech comprise of a wholesale price and a suggested retail price for dealers in respective channel. The mark-up price of for channel 1 is about 50% while the mark-up price for channel 2 is about 35%. The percentage mark-up for dealers is the ratio of the difference in retail price and wholesale price. Full-service dealers have higher mark-up because of the service they provide for customers. Discount dealers pass some of their savings to customers that resulted to a lower retail price. Below is the pricing strategy of Softtech in the market. The wholesale price of the product tends to increase as the cost of production increases. However, Softtech tries to protect the increase of wholesale price by absorbing the cost which, eventually, lessens the profit margin on the sales of products. However, effective marketing strategies made by Softtech still made the company profitable at the bottom line.   Period I Period II Period III Period IV Period V Retail Price ($)           Channel 1 200.00 200.00 198.00 210.00 239.00 Channel 2 153.84 153.84 152.30 161.53 184.61 Wholesale Price ($) 100.00 100.00 99.00 105.00 120.00 Unit Cost ($) 47.00 56.00 65.00 74.00 80.00 % margin 113% 79% 52% 42% 50% E. Competitor Analysis The competitors of Softtech are other multimedia developers such as Speechless, Message and Monicas Company. Each firms commands a market share of the multimedia industry. However, different marketing strategies with each firms eventually developed a market leader. Below is the summary of market share in dollar revenues. The closest competitor of Softtech in terms of market share is Speechless Company. Monicas intensive marketing strategy helped them gain market share on period three and in time became the market leader. Softtech is a bit conservative in their strategies which made them loose in the market share leadership race. Market Share per Competitor Company Period I Period II Period III Period IV Period V Softtech 23.7% 24.3% 27.4% 25.6% 26.3% Speechless 26.5% 29.2% 27.9% 24.7% 27.7% Message 24.9% 23.1% 19.9% 16.0% 18.6% Monicas 24.9% 23.4% 24.8% 33.7% 27.3% The summary prices of competing products are illustrated below. It can be seen that Speechless commands a premium price and still lead the market share. Ranking the competitors would show Softtech as third in place. Market Price per Competitor Company Period I Period II Period III Period IV Period V Channel 1 Softtech 200.00 200.00 198.00 210.00 239.00 Speechless 210.00 220.00 240.00 240.00 300.00 Message 190.00 190.00 190.00 190.00 499.00 Monicas 210.00 210.00 210.00 250.00 250.00 Channel 2 Softtech 153.84 153.84 152.3 161.53 184.61 Speechless 161.53 169.23 184.61 184.61 199.99 Message 146.15 146.15 146.15 146.15 384.61 Monicas 161.53 161.53 161.53 192.3 192.3 II. Discussion A. Period I This period is the introduction stage in the product life cycle. The business strategies of Softtech are focused on product development and market growth. Product design in Softtech is started with target customers where technical people are included in hearing what customer preferred and desires (Bloch, 1995). The initial design of the software is moderate on special commands (8), low on error protection (3), and low on ease of learning (3) which is the minimum preference of the target customers – professional creators. The cost of producing a unit is at $47 and the wholesale price is set up at $100, where the gross margin is more than twice the unit cost. Market growth is achieved through the development of customer awareness. This is achieved through pioneering campaigns such as advertising and personal selling (Kotler, Marketing Management: Analysis, Planning, Implementation and Control, 1993). Advertising in the growth stages is focused on building market awareness on the product. It includes intensive information campaigns about the product towards the targeted market. A strong product-market focus for the advertising strategy is crucial to hold market share and grow market demand (Kotler, 1991). The advertising budget is allocated at $250,000 which is 25% of the operating expenditures. The budget is appropriate since the company aims in gaining market share. The distribution strategy is focused on market penetration in order to gain impactful brand presence. It involves ten sales representatives serving full-service dealers and ten sales representatives serving discount dealers. The intensity of distribution is 30% on both channels. Customer service aims at providing quality service in order to meet customers’ expectations, perceptions and experience (Zeithaml, Berry, & Parasuraman, 1993). Customer service activities are allocated with $92,500 budget. The forecasted demand for period I is around 25,000 units. The quantity is the production order for Softtech. However, at the end of the period, the market response for the product was high such that the actual units exceeded the forecast demanded. The firm sold a total of 26,933 units to the market. The result of the marketing, distribution and production strategies of Softtech was seen as promising. The firm held a 23.7% market share in total sales dollars of the industry. The company comprehends the attractiveness and profitability of the industry through the end-results. (Higgins, 1995) The gross margin achieved was 53% of sales and the net profit was 20% of total revenues generated. B. Period II At the beginning of period II, the firm aims at increasing the market share and created new strategies. In order to be effective in increasing market share, the strategies implemented which are appropriate to the current market position, are focused on sustaining the competitive edge and continuing business growth in terms of sales and profitability. (DiMingo, 1990) The market share gained by the company is lower than its rivals. The potential causes of low levels of customer response hierarchy are outlined below. Poor Response Marketing Problem Underlying Cause Low Awareness Marketing Communications Poor Media Selection     Insufficient Frequency     Poor Ad Copy Poor Comprehension Marketing Communications Insufficient Frequency     Poor Ad Copy Low Interest Product Positioning Insufficient Benefits     High Price     Poor Ad Copy Low Intention Product Positioning Weak Value Proposition     Need for Low-Cost Trial     Not Readily Available Low Purchase Level Distribution Channels Not Available     Hard to Find in Store     Insufficient in-Store Services Source: (Best, 1997, p.244) As a reaction to the poor customer response, firm has decided to upgrade the functionalities of the product. Increase in product features would create appreciation of new customers and retention of existing users. (Bloch, 1995) The product features for Softtech were revised to 9 points special commands, 4 points error protection and 4 points ease of learning. However, the cost of production increased to $56 per unit. The company opted to maintain the wholesale price in order to protect the price in the market. To increase purchase level, the number of sales representatives in Channel 2 is increased to 11 in order to exploit user demand. On the hand, Channel 1 sales representatives were reduced to 9 persons. The company restructured the sales force without hiring new employees in order to maintain costs and budget. The company still has less confidence on market response that is why the distribution intensity remained at 30% each channel. In order to heighten product availability, the production order quantity was increased to 28,000 units. The company perceives that period II will have slow market growth that is why they have decreased budget on customer service spending to &75,000 and sustained the previous year’s advertising budget of $250,000. The end-result of Period II showed that the strategies made by Softtech paid off. The actual units produced and sold exceed the forecasted demand. The market share increased to 24.3%. The sales revenues grew by 15%. However, the profit to sales ratio decreased to 15% due to increase in cost of goods. C. Period III The company’s perception of market growth in the previous period was inaccurate. To address the issue, Softtech allocated $300,000 for sales promotion and advertising expenditures. The product features were again upgraded to increase market demand and serve new customers. The benefits of the product were now 10 points special commands, 5 points error protection and 5 points ease of learning. The unit cost increased to $65 per unit. With the same pricing strategy as before, Softech opted to slightly decrease wholesale price to $99 per unit in the hopes of catching the attention of the buying public. To compensate for increase in production expenditures, the company decreased budget for customer service to $50,000. The company anticipated increase in demand and ordered a projected quantity of 35,000 units to be produced. At the end of Period III, the market demand for Softtech grew and the company sold 41,232 units in the market. The market share dramatically increased to 27.4% making the company’s position as 2nd in the industry. However, the profit to sales ratio has further decreased to 11%. Clearly, the business strategy of the company in gaining market share has a trade off on its profitability. (Hindle, 2003) D. Period IV With the success of previous year’s performance, Softtech decided on balancing the number of sales representatives with ten persons on each channel but the intensity of distribution was changed. Distribution intensity for Channel 1 is now 35% while for Channel 2 is 40%. In order to achieve customer value, Softtech methodically analyses the market segment and behaviour and designs the business processes with those customers in mind. (Thompson, 1998) Softtech realised that the growth of market demand increases as the product features are upgraded. (Sultan, Farley, & Lehmann, 1990) The benefits of the product are 11 points special commands, 6 points error protection and 6 points ease of learning. The wholesale price was increased to $105 dollars in order to increase margins and turnaround the company’s profitability. (Rowbotham, Galloway, & Azhashemi, 2007) The results at the end of the period showed a decrease in market share to 25.6%. The profit to sales ratio further decreased to 8%. The sales growth is only at 4%. The poor performance of firm may be aligned to the decline of technological life cycles which puts pressure on the company to innovate. (Kiernan, 1995) E. Period V The company implemented innovative strategies to prevent further decline in performance and resuscitate in the last stages of the product life cycle. (Gardner, 1987) The product features is now 12 points special commands, 6 points error protection and 7 points ease of learning. Customer service budget was increased to $50,000 in order to regain lost customers. Sales promotions were introduced with an allocation of $5 per unit on both channels. The wholesale price was increased to $120 per unit in order to regain profitability. The company did not expect growth in demand such that the production order quantity was maintained at 46,000 units, same as previous period. The result of the innovative strategies demonstrated positive impacts on the company’s performance. The market share increased back to 26.3%. The profit to sales ratio has returned to 15%. The sales growth is 29% from the previous year, the biggest in the firm’s history. References Abell, D., & Hammond, J. (1979). Strategic Market Planning. New Jersey: Prentice Hall, Inc. Alpert, F., & Kamins, M. (1994). Pioneer Brand Advantage and Consumer Behavior: A Conceptual Framework and Propositional Inventory. Journal of the Academy of Marketing Science , 22, 244-253. Best, R. J. (1997). Market-based Management: Strategies for Growing Customer Value and Profitability. New Jersey: Prentice Hall, Inc. Blackett, T. (2003). What is a Brand. In R. Clifton, & J. Simmons, Brands and Branding (pp. 13-26). Oxford: Profile Books Ltd. Bloch, P. (1995). Seeking the Ideal Form: Product Design and Consumer Response. Journal of Marketing , 30, 16-29. Calantone, R., Benedetto, A. d., & Bhoovaraghan, S. (1994). Examining the Relationship between Degree of Innovation and New Product Success. Journal of Business Research , 30, 143-148. DiMingo, E. (1990, January-February). Marketing Strategies for Small Share Players. Journal of Business Strategy , 26-30. Higgins, R. (1995). Analysis for Financial Management (4th ed.). Chicago: Irwin, Inc. Hindle, T. (2003). Guide to Management Ideas. London: Profile Books Ltd. Kiernan, F. (1995). Get Innovative or Get Dead. Marin County, CA: Arrow. Kotler, P. (1991). Marketing Management (7th ed.). New Jersey: Prentice-Hall. Kotler, P. (1993). Marketing Management: Analysis, Planning, Implementation and Control. New Jersey: Prentice-Hall. Rowbotham, F., Galloway, L., & Azhashemi, M. (2007). Operations Management in Context (2nd ed.). Oxford: Elsevier Ltd. Sultan, F., Farley, J., & Lehmann, D. (1990, February). A Meta-Analysis of Applications of Diffusion Models. Journal of Marketing Research , 70-77. Thompson, H. (1998, July-August). What Do Your Customers Really Want. Journal of Business Strategy , 16-22. Zeithaml, V., Berry, L., & Parasuraman, A. (1993). The Nature and Determinants of Customer Expectations of Service. Journal of the Academy of Marketing Science , 21 (1), 1-12 Read More
Cite this document
  • APA
  • MLA
  • CHICAGO
(Step-By-Step Guide for Increasing the Market Share of a Software Devel Case Study, n.d.)
Step-By-Step Guide for Increasing the Market Share of a Software Devel Case Study. Retrieved from https://studentshare.org/marketing/1724061-the-marketing-game-report
(Step-By-Step Guide for Increasing the Market Share of a Software Devel Case Study)
Step-By-Step Guide for Increasing the Market Share of a Software Devel Case Study. https://studentshare.org/marketing/1724061-the-marketing-game-report.
“Step-By-Step Guide for Increasing the Market Share of a Software Devel Case Study”, n.d. https://studentshare.org/marketing/1724061-the-marketing-game-report.
  • Cited: 0 times

CHECK THESE SAMPLES OF Step-By-Step Guide for Increasing the Market Share of a Software Development Company

Legal infrastructure in Asian countries

The essay "Legal infrastructure in Asian countries" analyzes legal infrastructure in civil and commercial law is a basic intellectual infrastructure for a development of certain type of industry which the state sector wants to introduce in addition to general modernization.... oat and Yacht industry is an excellent opportunity for China because China's development Marines is speedy.... To develop an industry like legal Information Technology, agriculture, and marketing etc, the knowledge of market of specific country is also very necessary....
7 Pages (1750 words) Essay

The Concentration Ratio and the Investigation of the OFT

(b) The table of market share of the com0anies that would be taking place if the shares are revised are: Company Market Share Kellogs 15% Oaty Oats 15% Tesco Cereals 15% Quaker Oats 15% Malty Malt 15% New Cereals 15% Others (assuming that are 10 other firms) 1% (each firm) It can be commentated that the firms in the above market are facing cut-throat competition with each other.... S =market share of each firm.... Si is considered to be the market share and the m is the firm's number....
9 Pages (2250 words) Essay

Semiconductor Industry

Its main products used in TV sets, air conditioners, computers, mobile phones, refrigerators, computer software, and network equipment.... This essay "Semiconductor Industry" is about one of the most important infrastructure requirements, which is essential for the expansion of opportunities and plays an important role in making or breaking the competitive positioning....
10 Pages (2500 words) Essay

Open Source Development

The paper "Open Source Development" tells us about software development.... The use of this causes uncertainty with the IT managers that have to make the decisions about the company's IT policy and the software they use.... nbsp;Big and famous IT companies such as IBM and Novell are investing in open source development.... This is a research proposal for the evaluation of Open Source development.... The objective of the study is to show the importance of Open Source development in the increasing number of businesses and universities that are using the internet....
7 Pages (1750 words) Assignment

The Importance of Market Research to Kudlers Fine Foods

Kudler Fine Foods has… The need for new locations after the opening of the Encinitas branch in 2003 shows that the market has accepted the strong presence of Kudler Fine Foods in the The company believes that people's concern of over quality and health have contributed to the success of the company.... A new enterprise like Kudler Fine Foods, a gourmet grocery store that to caters to target clients would find marketing research an invaluable tool in strengthening its operations, expanding its services, and increasing the consumer purchase cycle....
6 Pages (1500 words) Essay

Why Is Microsoft So Successful

In the initial years, the company focused on creating computer language, but most of the financial success came after it embarked on producing operating systems.... However, according to Harvard Business School professors Marco Iansiti and Alan MacCormack, the company's success can be attributed to its capability to predict future technological developments and make maximum efficient use of the major software technologies.... Although it has been criticized that Microsoft Corporation's success is largely due to its monopoly position in the global market which the company has taken full advantage of, Iansiti and MacCormack have a different perspective....
6 Pages (1500 words) Essay

Marketing Draft of Haier Group

The company aims at getting the market share to over 50%.... The company has divided China into five sections of the market in order to enable it win over the competitors.... Haier Group company is out to provide customers in China and all over the world with electronic products that it classifies as white, brown and IT products.... Having been operation since 1984, it has grown from supplying refrigerators in China to supplying its products to at least… The company provides the customers quality products at affordable prices....
6 Pages (1500 words) Essay

Apples Implementation of the Hybrid Strategy

% of the market share compared to a 2.... % global market share that places the company ninth amongst the global list of computer makers.... In the 1970s, Apple ignited the revolution of personal computers within the market.... Apple is a multinational company based in America that deals in the design and sale of computer software personal computers and a wide range of hand held gadgets.... Since then, the company has grown to gain global recognition to the daily consumers of electronics....
6 Pages (1500 words) Essay
sponsored ads
We use cookies to create the best experience for you. Keep on browsing if you are OK with that, or find out how to manage cookies.
Contact Us