StudentShare
Contact Us
Sign In / Sign Up for FREE
Search
Go to advanced search...
Free

Horizontal and Vertical Financial Analysis - PepsiCo vs Coca-Cola - Essay Example

Cite this document
Summary
This article mainly emphasizes upon the financial comparison of the two giant companies of the world in the industry of beverages which are PepsiCo Inc. and Coca-Cola Inc. for the year ended 2003, 2004 and 2005. …
Download full paper File format: .doc, available for editing
GRAB THE BEST PAPER97.9% of users find it useful
Horizontal and Vertical Financial Analysis - PepsiCo vs Coca-Cola
Read Text Preview

Extract of sample "Horizontal and Vertical Financial Analysis - PepsiCo vs Coca-Cola"

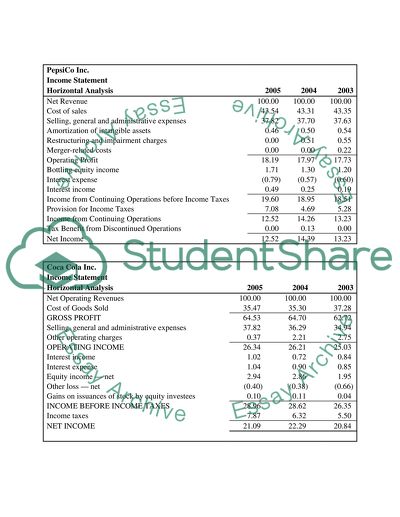
?Horizontal & Vertical Financial Analysis – PepsiCo v/s Coca-Cola Introduction This article mainly emphasizes upon the financial comparison of the two giant companies of the world in the industry of beverages which are PepsiCo Inc. and Coca-Cola Inc. for the year ended 2003, 2004 and 2005. The structure of this article is framed in such a manner that firstly income statements of both the companies are analyzed on horizontal and then on vertical basis. Next section is based on the analysis of balance sheets for the two companies on horizontal basis and then followed by vertical analysis. Income Statement Analysis on Horizontal Basis The major components of income statements are analyzed for both the companies in respect of cost of goods sold, operating income, income before taxes and finally net income. Cost of sales for PepsiCo is around 43% of the sales whereas the same for Coca-Cola is around 35% of the sales which is substantially lower than that of PepsiCo. In respect of operating profits, Coca-Cola has also an edge over PepsiCo such that its operating income is around 26% of the sales whereas PepsiCo remained behind and has the operating profit of just around 18%. Coca-Cola remained successful in maintaining a healthy position in respect of its income before taxes such that it managed to earn income before taxes around 28% of the sales whereas PepsiCo hardly managed to earn income before taxes of around hardly 19% of the sales. Net income for Coca-Cola has remained on a stronger side pursuing around 21% of its sales. On the other hand, PepsiCo just managed to earn net income of 13% of its sales in the three years. Following are the attached tables for percentage change on horizontal basis for two companies. PepsiCo Inc.       Income Statement   Horizontal Analysis 2005 2004 2003 Net Revenue 100.00 100.00 100.00 Cost of sales 43.54 43.31 43.35 Selling, general and administrative expenses 37.82 37.70 37.63 Amortization of intangible assets 0.46 0.50 0.54 Restructuring and impairment charges 0.00 0.51 0.55 Merger-related costs 0.00 0.00 0.22 Operating Profit 18.19 17.97 17.73 Bottling equity income 1.71 1.30 1.20 Interest expense (0.79) (0.57) (0.60) Interest income 0.49 0.25 0.19 Income from Continuing Operations before Income Taxes 19.60 18.95 18.51 Provision for Income Taxes 7.08 4.69 5.28 Income from Continuing Operations 12.52 14.26 13.23 Tax Benefit from Discontinued Operations 0.00 0.13 0.00 Net Income 12.52 14.39 13.23 Coca Cola Inc.           Income Statement   Horizontal Analysis 2005   2004   2003 Net Operating Revenues 100.00 100.00 100.00 Cost of Goods Sold 35.47   35.30   37.28 GROSS PROFIT 64.53 64.70 62.72 Selling, general and administrative expenses 37.82 36.29 34.94 Other operating charges 0.37   2.21   2.75 OPERATING INCOME 26.34 26.21 25.03 Interest income 1.02 0.72 0.84 Interest expense 1.04 0.90 0.85 Equity income — net 2.94 2.86 1.95 Other loss — net (0.40) (0.38) (0.66) Gains on issuances of stock by equity investees 0.10   0.11   0.04 INCOME BEFORE INCOME TAXES 28.96 28.62 26.35 Income taxes 7.87 6.32 5.50 NET INCOME 21.09   22.29   20.84             Income Statement Analysis on Vertical Basis In respect of vertical analysis, PepsiCo is found to have earned much more growth as compared to Coca-Cola such that PepsiCo’s revenues increased by 8% and 11% respectively as compared to previous years whereas Coca-Cola’s revenues increased with 4% and 6% during the same periods. Operating profits of PepsiCo increased by around 10% and 12% as compared to previous years, however, only 9% and 7% increase in operating income for Coca-Cola can be observed. Net income of PepsiCo decreased by 3.18% as compared to previous year but Coca-Cola managed to increase its net income by 0.52%. Following tables highlight the comparative vertical analysis for both companies. PepsiCo Inc.     Income Statement   Vertical Analysis 2005 2004 Net Revenue 11.28 8.49 Cost of sales 11.85 8.41 Selling, general and administrative expenses 11.63 8.70 Amortization of intangible assets 2.04 1.38 Restructuring and impairment charges (100.00) 2.04 Merger-related costs   (100.00) Operating Profit 12.61 10.00 Bottling equity income 46.58 17.65 Interest expense 53.29 2.45 Interest income 114.86 45.10 Income from Continuing Operations before Income Taxes 15.07 11.10 Provision for Income Taxes 67.93 (3.65) Income from Continuing Operations (2.30) 16.98 Tax Benefit from Discontinued Operations     Net Income (3.18) 18.05 Coca Cola Inc.     Income Statement   Vertical Analysis 2005 2004 Net Operating Revenues 6.26 4.24 Cost of Goods Sold 6.79 (1.31) GROSS PROFIT 5.98 7.55 Selling, general and administrative expenses 10.76 8.28 Other operating charges (82.29) (16.23) OPERATING INCOME 6.79 9.14 Interest income 49.68 (10.80) Interest expense 22.45 10.11 Equity income — net 9.50 52.96 Other loss — net 13.41 (40.58) Gains on issuances of stock by equity investees (4.17) 200.00 INCOME BEFORE INCOME TAXES 7.52 13.23 Income taxes 32.22 19.77 NET INCOME 0.52 11.50       Balance Sheet Analysis on Horizontal Basis If the balance sheets of the two companies are considered as a percentage of total assets, it can be observed that PepsiCo’s current assets remained around 32% of the total sales. On the other hand, Coca-Cola’s current assets contributed around 34% and 39% in both the years. Property, plant and equipment for PepsiCo were 27% of the total assets but in case of Coca-Cola they were even less than 20% of total assets. PepsiCo had experienced relatively lower proportion of its current liabilities such around 24% to 29% of total assets were financed by current liabilities. Conversely, the current liabilities of Coca-Cola stood at around 35% of the total assets. Total liabilities for PepsiCo accumulate around 55% of the total assets whereas for Coca-Cola this percentage is around 45%. Shareholder’s equity of PepsiCo is nearly 45% of total assets and for Coca-Cola it is around 55%. The following tables exactly highlight the horizontal analysis of both the companies. PepsiCo Inc.     Balance Sheet   Horizontal Analysis 2005 2004 ASSETS     Current Assets   Cash and cash equivalents 5.41 4.57 Short-term investments 9.98 7.74 Accounts and notes receivable, net 10.28 10.72 Inventories 5.34 5.51 Prepaid expenses and other current assets 1.95 2.34 Total Current Assets 32.95 30.87 Property, Plant and Equipment, net 27.36 29.12 Amortizable Intangible Assets, net 1.67 2.14 Goodwill 12.88 13.97 Other non-amortizable intangible assets 3.42 3.33 Non-amortizable Intangible Assets 16.31 17.30 Investments in Non-controlled Affiliates 10.98 11.73 Other Assets 10.73 8.84 Total Assets 100.00 100.00 LIABILITIES AND SHAREHOLDERS’ EQUITY   Current Liabilities   Short-term obligations 9.11 3.77 Accounts payable and other current liabilities 18.82 20.01 Income taxes payable 1.72 0.35 Total Current Liabilities 29.65 24.13 Long-Term Debt Obligations 7.29 8.56 Other Liabilities 13.63 14.65 Deferred Income Taxes 4.52 4.34 Total Liabilities 55.08 51.68 Preferred Stock, no par value 0.13 0.15 Repurchased Preferred Stock (0.35) (0.32) Common Shareholders’ Equity   Common stock, par value 1 2/3? per share (issued 1,782 shares) 0.09 0.11 Capital in excess of par value 1.94 2.21 Retained earnings 66.56 66.92 Accumulated other comprehensive loss (3.32) (3.17)   65.27 66.07 Less: repurchased common stock, at cost (126 and 103 shares, respectively) (20.13) (17.58) Total Common Shareholders’ Equity 45.14 48.49 Total Liabilities and Shareholders’ Equity 100.00 100.00 Coca Cola Inc.       Balance Sheet   Horizontal Analysis 2005   2004 ASSETS       CURRENT ASSETS   Cash and cash equivalents 15.98 21.33 Marketable securities 0.22 0.19 Trade accounts receivable, less allowances of $72 and $69, respectively 7.75 7.14 Inventories 4.84 4.52 Prepaid expenses and other assets 6.04 5.88 TOTAL CURRENT ASSETS 34.83   39.06 INVESTMENTS   Equity method investments:   Coca-Cola Enterprises Inc. 5.88 4.99 Coca-Cola Hellenic Bottling Company S.A. 3.53 3.39 Coca-Cola FEMSA, S.A. de C.V. 3.34 2.52 Coca-Cola Amatil Limited 2.54 2.34 Other, principally bottling companies 7.01 5.51 Other, principally bottling companies 1.22 1.13 TOTAL INVESTMENTS 23.52   19.88 OTHER ASSETS 9.00 9.48 PROPERTY, PLANT AND EQUIPMENT — net 19.66 19.37 TRADEMARKS WITH INDEFINITE LIVES 6.61 6.48 GOODWILL 3.56 3.49 OTHER INTANGIBLE ASSETS 2.81 2.23 TOTAL ASSETS 100.00   100.00 LIABILITIES AND SHAREOWNERS’ EQUITY   CURRENT LIABILITIES   Accounts payable and accrued expenses 15.27 14.00 Loans and notes payable 15.35 14.41 Current maturities of long-term debt 0.10 4.74 Accrued income taxes 2.71 2.26 TOTAL CURRENT LIABILITIES 33.43   35.41 LONG-TERM DEBT 3.92 3.68 OTHER LIABILITIES 5.88 8.95 DEFERRED INCOME TAXES 1.20 1.28 SHAREOWNERS’ EQUITY   Common stock, $0.25 par value; Authorized — 5,600 shares;   Issued — 3,507 and 3,500 shares, respectively 2.98 2.78 Capital surplus 18.66 15.67 Reinvested earnings 106.36 92.57 Accumulated other comprehensive income (loss) (5.67) (4.29) Treasury stock, at cost — 1,138 and 1,091 shares, respectively (66.76) (56.06) TOTAL SHAREOWNERS’ EQUITY 55.58   50.68 TOTAL LIABILITIES AND SHAREOWNERS’ EQUITY 100.00   100.00 Balance Sheet Analysis on Vertical Basis For PepsiCo, its current assets increased by around 21% as compared to the previous year whereas for Coca-Cola its current assets decreased by around 16% which is a major change. Total assets of PepsiCo experienced an increase of around 13% whereas Coca-Cola’s total assets decreased by around 6%. There has been an increase of around 39% in current liabilities of PepsiCo whereas for Coca-Cola, its current liabilities suffered a reduction of 11%. The shareholders’ equity for PepsiCo increased by some 5% and on the other hand, it increased mere around 2% for Coca-Cola. Overall, PepsiCo experienced a significant growth in its financial position as compared to Coca-Cola which remained below par. PepsiCo Inc.   Balance Sheet   Vertical Analysis % Change ASSETS   Current Assets   Cash and cash equivalents 34.06 Short-term investments 46.24 Accounts and notes receivable, net 8.74 Inventories 9.86 Prepaid expenses and other current assets (5.50) Total Current Assets 21.01 Property, Plant and Equipment, net 6.53 Amortizable Intangible Assets, net (11.37) Goodwill 4.58 Other non-amortizable intangible assets 16.40 Non-amortizable Intangible Assets 6.86 Investments in Non-controlled Affiliates 6.12 Other Assets 37.49 Total Assets 13.36 LIABILITIES AND SHAREHOLDERS’ EQUITY   Current Liabilities   Short-term obligations 174.10 Accounts payable and other current liabilities 6.64 Income taxes payable 451.52 Total Current Liabilities 39.31 Long-Term Debt Obligations (3.50) Other Liabilities 5.46 Deferred Income Taxes 17.93 Total Liabilities 20.82 Preferred Stock, no par value 0.00 Repurchased Preferred Stock 22.22 Common Shareholders’ Equity   Common stock, par value 1 2/3? per share (issued 1,782 shares) 0.00 Capital in excess of par value (0.65) Retained earnings 12.74 Accumulated other comprehensive loss 18.85 Less: repurchased common stock, at cost (126 and 103 shares, respectively) 29.82 Total Common Shareholders’ Equity 5.51 Total Liabilities and Shareholders’ Equity 13.36 Coca Cola Inc.   Balance Sheet   Vertical Analysis % Change ASSETS   CURRENT ASSETS   Cash and cash equivalents (29.91) Marketable securities 8.20 Trade accounts receivable, less allowances of $72 and $69, respectively 1.65 Inventories 0.28 Prepaid expenses and other assets (3.84) TOTAL CURRENT ASSETS (16.54) INVESTMENTS   Equity method investments:   Coca-Cola Enterprises Inc. 10.33 Coca-Cola Hellenic Bottling Company S.A. (2.62) Coca-Cola FEMSA, S.A. de C.V. 23.99 Coca-Cola Amatil Limited 1.63 Other, principally bottling companies 18.98 Other, principally bottling companies 1.41 TOTAL INVESTMENTS 10.72 OTHER ASSETS (11.17) PROPERTY, PLANT AND EQUIPMENT — net (5.01) TRADEMARKS WITH INDEFINITE LIVES (4.47) GOODWILL (4.56) OTHER INTANGIBLE ASSETS 17.95 TOTAL ASSETS (6.41) LIABILITIES AND SHAREOWNERS’ EQUITY   CURRENT LIABILITIES   Accounts payable and accrued expenses 2.04 Loans and notes payable (0.29) Current maturities of long-term debt (98.12) Accrued income taxes 12.41 TOTAL CURRENT LIABILITIES (11.65) LONG-TERM DEBT (0.26) OTHER LIABILITIES (38.52) DEFERRED INCOME TAXES (12.44) SHAREOWNERS’ EQUITY   Common stock, $0.25 par value; Authorized — 5,600 shares;   Issued — 3,507 and 3,500 shares, respectively 0.23 Capital surplus 11.44 Reinvested earnings 7.54 Accumulated other comprehensive income (loss) 23.81 Treasury stock, at cost — 1,138 and 1,091 shares, respectively 11.46 TOTAL SHAREOWNERS’ EQUITY 2.64 TOTAL LIABILITIES AND SHAREOWNERS’ EQUITY (6.41) References Brigham, Eugene F. & Ehrhardt, Michael C., (2008). Financial management: theory and practice. 12th ed. New York: Cengage Learning. Eckbo, BE., (2008). Handbook of corporate finance: empirical corporate finance. Oxford: Elsevier. Jaffe, J. & Ross, R Westerfield., (2004). Corporate Finance. New Delhi: Tata McGraw-Hill Education. Read More
Cite this document
  • APA
  • MLA
  • CHICAGO
(“Horizontal and Vertical Financial Analysis - PepsiCo vs Coca-Cola Essay”, n.d.)
Retrieved from https://studentshare.org/marketing/1397102-financial-analysis
(Horizontal and Vertical Financial Analysis - PepsiCo Vs Coca-Cola Essay)
https://studentshare.org/marketing/1397102-financial-analysis.
“Horizontal and Vertical Financial Analysis - PepsiCo Vs Coca-Cola Essay”, n.d. https://studentshare.org/marketing/1397102-financial-analysis.
  • Cited: 4 times

CHECK THESE SAMPLES OF Horizontal and Vertical Financial Analysis - PepsiCo vs Coca-Cola

Past and New Strategies: Case Study of Pepsi co

In traditional economic theorizing, the analysis of the firm and its behavior is built upon the assumption that firms operate in such a manner as to maximize their profits.... This paper is a study of different business strategies at different stages of the life and growth of an enterprise....
15 Pages (3750 words) Essay

Checkpoint ratio, vertical, and horizontal analyses

Analysis of Pepsico and coca-cola companies The current ratio shows that Pepsico is showing a decreasing trend from 1.... coca-cola is also showing a similar trend with the ratio at 1.... However, the trend could be alarming for their short term liquidity position in the future if it continues, especially for coca-cola which has almost equal amount of current assets covering the current liabilities ($1.... For coca-cola current liabilities have increased and assets decreased again showing increased short term financing (appendix)....
2 Pages (500 words) Assignment

Choose a business whose main focus is in the manufacture of renewable energy technology

Lastly, these executives concentrate in variance analysis of firing and hiring, cost of training, and cost of recruitment (Panneersalvam, 2006, p.... Aelos Wind Turbine Company offers products which include vertical and horizontal axis wind… Q2.... It swiftly managed to build 13 plants and companies in 7 countries worldwide after 30 years of development....
5 Pages (1250 words) Essay

Analysis of Leadership based on Microsoft and Coca-Cola

The paper contains a description of the organizational structure and culture of coca-cola.... The company for which interest is important is the coca-cola Company.... It analysis the leadership styles of Bill Gates along with the performance of Bill Gates and his motivation level.... The manufacturing is tasked with ensuring supply is efficient and marches demand in the market while the corporate staff takes care of management both at a vertical and horizontal level at that stage....
7 Pages (1750 words) Case Study

Business Policy and Strategic Management of Coca-Cola

Stakeholder analysis enables companies to identity the changing interests of stakeholders, identify the potential risks and implement measures that will satisfy the stakeholders' needs (Srivastava & Verma, 2012).... The analysis will identify the actual and potential conflict of interests and relationships among several stakeholders....
7 Pages (1750 words) Essay

Financial Comparisons between PepsiCo and Coca-Cola

Both the companies… Instead, they focus on enhancing respective brand images in the global market with intensive marketing strategies and reducing cost of production through In this paper, 2004 to 2005 financial analysis will be based on comparing financial ratios of both companies along with essential Balance Sheet items.... This paper will make a financial comparison for the years 2004 and 2005 between two of the most globally spread companies in the beverage industry, PepsiCo and coca-cola with the purpose of making recommendations for a better performance in the coming years....
7 Pages (1750 words) Book Report/Review

The Evaluation of Coca-Cola Company

This paper gives an evaluation and an analysis of The coca-cola Company.... It gives the general evaluation of the company and synthesizes the information to give the reason of the success The coca-cola in the soft drink industry.... The coca-cola Company is a multinational beverage firm, and manufacturer, marketer, and retailer of non-alcoholic beverage drink and syrups.... The company is popular for its coca-cola product that a pharmacist John Stith Pemberton invented in 1886 in Columbus, Georgia....
8 Pages (2000 words) Case Study

Managing the Coca-Cola Company

To illustrate, through the provided information, one can come up with a horizontal and vertical analysis of the company that could be of great importance in explaining Coca Cola's financial performance.... With over “500 non-alcoholic beverages brands,” the coca-cola Company has managed to… 1).... With over “500 non-alcoholic beverages brands,” the coca-cola Company has managed to become the market leader in the beverage industry (Coca Cola 10K Report, 2014, p....
2 Pages (500 words) Essay
sponsored ads
We use cookies to create the best experience for you. Keep on browsing if you are OK with that, or find out how to manage cookies.
Contact Us