StudentShare
Contact Us
Sign In / Sign Up for FREE
Search
Go to advanced search...
Free

Financial Comparisons between PepsiCo and Coca-Cola - Book Report/Review Example

Cite this document
Summary
The paper "Financial Comparisons between PepsiCo and Coca-Cola" makes a financial comparison between two of the most globally spread companies in the beverage industry, with the purpose of making recommendations for better performance in the coming years…
Download full paper File format: .doc, available for editing
GRAB THE BEST PAPER92.8% of users find it useful
Financial Comparisons between PepsiCo and Coca-Cola
Read Text Preview

Extract of sample "Financial Comparisons between PepsiCo and Coca-Cola"

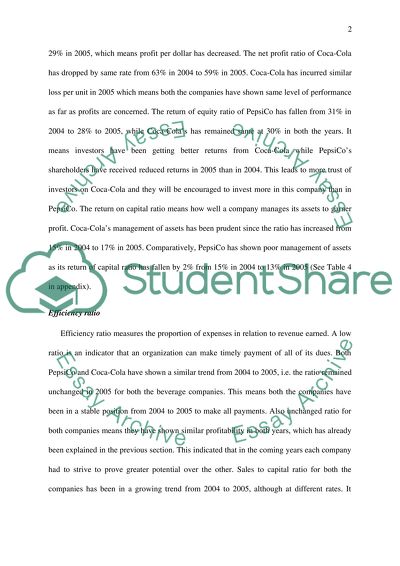
Financial Comparisons between PepsiCo and Coca-Cola Introduction This paper will make a financial comparison for the years 2004 and 2005 between twoof the most globally spread companies in the beverage industry, PepsiCo and Coca-Cola with the purpose of making recommendations for a better performance in the coming years. Both the companies are fierce competitors of each other; however they have been able to avoid price competition in order to garner high profits. Instead, they focus on enhancing respective brand images in the global market with intensive marketing strategies and reducing cost of production through better management and improved operational activities. In this paper, 2004 to 2005 financial analysis will be based on comparing financial ratios of both companies along with essential Balance Sheet items. Financial comparisons (see appendix for the tables) Profitability ratio In PepsiCo, the gross profit ratio has fallen by 1 percent from 2004 to 2005. Therefore, the company dwindled slightly on generating more cash from sales in 2005. In Coca-Cola, the gross profit ratio also fell by 1 percent from 2004 to 2005. This tells us that both companies’ capacity of cash generation showed similar trend. Decline in gross profit ratio means a company has less cash in hand to make payments to creditors, suppliers etc. However, since the ratio decline rate of PepsiCo and Coca-Cola was not very high (only 1 percent) from 2004 to 2005, hence it can be said that both the beverage companies had in them to plan their activities in a more economic way resulting in efficient management of their business activities. The net profit ratio of PepsiCo has decreased from 33% in 2004 to 29% in 2005, which means profit per dollar has decreased. The net profit ratio of Coca-Cola has dropped by same rate from 63% in 2004 to 59% in 2005. Coca-Cola has incurred similar loss per unit in 2005 which means both the companies have shown same level of performance as far as profits are concerned. The return of equity ratio of PepsiCo has fallen from 31% in 2004 to 28% to 2005, while Coca-Cola’s has remained same at 30% in both the years. It means investors have been getting better returns from Coca-Cola while PepsiCo’s shareholders have received reduced returns in 2005 than in 2004. This leads to more trust of investors on Coca-Cola and they will be encouraged to invest more in this company than in PepsiCo. The return on capital ratio means how well a company manages its assets to garner profit. Coca-Cola’s management of assets has been prudent since the ratio has increased from 15% in 2004 to 17% in 2005. Comparatively, PepsiCo has shown poor management of assets as its return of capital ratio has fallen by 2% from 15% in 2004 to 13% in 2005 (See Table 4 in appendix). Efficiency ratio Efficiency ratio measures the proportion of expenses in relation to revenue earned. A low ratio is an indicator that an organization can make timely payment of all of its dues. Both PepsiCo and Coca-Cola have shown a similar trend from 2004 to 2005, i.e. the ratio remained unchanged in 2005 for both the beverage companies. This means both the companies have been in a stable position from 2004 to 2005 to make all payments. Also unchanged ratio for both companies means they have shown similar profitability in both years, which has already been explained in the previous section. This indicated that in the coming years each company had to strive to prove greater potential over the other. Sales to capital ratio for both the companies has been in a growing trend from 2004 to 2005, although at different rates. It indicates greater sales volume in relation to capital invested which means both the companies are giving good performance in recent years (See Table 4 in appendix). Liquidity and current ratio A higher liquidity and current ratio means the company has enough cash to pay all debts within a year, while a low ratio can also indicate insolvency possibility. Current ratio has been very fluctuating for both PepsiCo and Coca-Cola in the 2 years from 2004 to 2005. PepsiCo has shown a steep drop in the ratio to 1.11 in 2005 from 1.28 in 2004. It may need to arrange for extra cash to make payment to debtors and suppliers. Coca-Cola, like its rival has also shown a drop in the ratio to 1.04 in 2005 from 1.10 in 2004. Since the percentage drop in current ratio of PepsiCo (13.28) is much higher than the percentage drop of Coca-Cola (5.45), therefore it can be assumed that Coca-Cola is comparatively in a strong position financially than its rival company. However, liquidity ratio has fallen for both the companies from 2004 to 2005. This means that the companies’ liquid assets are falling and this can lead to difficulty in meeting current debts (See Table 4 in appendix). Gearing ratio and interest cover ratio Gearing ratio can assess the company’s financial position in the long run. In Coca-Cola the ratio has shown a reduction from 5.18 in 2004 to 5.15 in 2005, while in PepsiCo it increased gradually from 9.06 in 2004 to 9.72 in 2005. Higher ratio means risks are greater. So, Coca-Cola seems to in a better financial position than PepsiCo. Interest cover ratio is showing a gradual decrease from 2004 to 2005 in both the companies, which indicates the companies are not in a good position to meet their interest payments (See Table 4 in appendix). Horizontal analysis Comparing the sales, operational profit (O.P) and net profit (N.P) of PepsiCo and Coca-Cola it can be seen that all the three elements have substantial growth from fiscal year 2004 to fiscal year 2005. Only N.P. of PepsiCo has declined by 3.18 percent. O.P. of PepsiCo has increased by around 12.6% from 2004 to 2005. O.P. of Coca-Cola has increased by around 6.79% from 2004 to 2005, and N.P. has increased by almost 0.52% during the same period. Both the companies saw growth in sales expenses from 2004 to 2005, yet the profit has increased because rate of increase of expenses has been lower than rate of increase in profit. PepsiCo’s sales expenses have increased by 11.85% from 2004 to 2005 and Coca-Cola’s by 6.79%. Coca-Cola’s performance has been better than PepsiCo since the latter’s net profit has declined and also rate of expenses growth is higher (See Table 1 in appendix). Comparing the 3 principle elements of Balance sheet of both the companies, it can be observed that asset management has been much better in PepsiCo than in Coca-Cola. In PepsiCo there has been 13.4% increase in assets from 2004 to 2005 and 5.5% increase in liabilities. In Coca-Cola there has been 6.4% decrease in assets from 2004 to 2005 and 15.7% decrease in liabilities. Coca-Cola is in a good position since there has been significant decrease in liabilities and although PepsiCo has a greater percentage of increase in assets, its position is not good since its liabilities increased by a high percentage (See Tables 2 & 3 in appendix). Vertical analysis Shareholder equity of both PepsiCo and Coca-Cola has increased from fiscal year 2004 to fiscal year 2005. The rate of increase has been 5.5% for PepsiCo and 2.6% for Coca-Cola. This means the shareholders are getting good returns from the beverage companies in the two years. Shareholder equity has been 45.1% of total assets of PepsiCo in 2005 fiscal year, and 48.5% in 2004 fiscal year. Shareholder equity has been 55.6% of total assets of Coca-Cola in 2005 fiscal year, and 50.7% in 2004 fiscal year. Hence, it can be seen that shareholders of Coca-Cola has received greater percentage of assets in 2005 than the shareholders of PepsiCo (See Tables 2 & 3 in appendix). In this era of globalization, every company strives to capture the world market. Intense competition from companies within same industry leads to strategic marketing for brand promotions and developing management techniques to reduce production cost. In the global market, the rules of competition change and different factors become the focus rather than the traditional concept of single market competition. PepsiCo and Coca-Cola have been the longest running rival companies dominating the soft drink or beverage industry across the world. Both the companies strive to hold the larger share of the global market than the other. Since the companies were formed, their competition has been extremely severe in the U.S. market; however Coca-Cola has traditionally been in a much better position than its rival company in the international market. Since the global market is growing rapidly compared to any domestic market, therefore Coca-Cola has this added advantage of having stronger foothold, with its Coke brand, outside the United States compared to PepsiCo. The sales figure of Coca-Cola far exceeds the sales of PepsiCo in majority of the world’s top ten markets. PepsiCo, however has a huge market in the US and the UK (Jeannet & Hennessey, 2005, p.284). Conclusion Both PepsiCo and Coca-Cola are strong competitors in the global beverage industry. From fiscal year 2004 to 2005, the percentage growth of sales of PepsiCo has been 11.9 percent and net profit declined by 3.18 percent. On the other hand, Coca-Cola has experienced increase in sales by 6.8 percent from 2004 to 2005, and also net profit increased by 0.52 percent. Hence, although sales growth has been more in the case of PepsiCo, net profit has increased for Coca-Cola company. This places Coca-Cola in a better financial position since profit maximization is always the main objective of any company. Very often to capture the larger market, the companies resort to unethical marketing strategies. Recently in 2013, Coca-Cola promoted its product as guide to fight obesity. In order to reverse the declining sale of Diet Coke, the company adopted deceptive means to convince consumers that aspartame which is an artificial sweetener used in Diet Coke is healthier than sugar. However, studies have shown that aspartame contributed towards weight gain by increasing appetite. Such marketing campaigns can be harmful especially for people who are weight conscious (Paul, 2013). Since there will always be fierce competition between the two companies, the focus should be on effective marketing strategies to enhance sales. More emphasis should be on increasing the net profit since PepsiCo has seen decline in N.P. in 2005 while Coca-Cola’s N.P. increased only by less than one percent. In the current recession, both the companies should focus on cutting costs to increase profit margin. Stronger advertisement techniques will help each company to beat the competition. Also, alternatives to the sugar content in the drinks will help the companies since most people today are calorie conscious. References Financial Statements of PepsiCo and Coca-Cola, 2004 and 2005 Jeannet, J.P. & Hennessey, H.D. (2005). Global Market Strategies, Dreamtech Press Paul, K. (2013) Why Coca-Cola’s New Ad Campaign May Be Dangerous to Your Health, AlterNet, retrieved on July 11, 2014 from: http://www.alternet.org/food/why-coca-colas-new-ad-campaign-may-be-dangerous-your-health Appendix All figures in $ millions Table 1: Income statement 2005 2004 Sales O.P N.P Sales O.P N.P PepsiCo 14,176 5,922 4,078 12,674 5,259 4,212 Coke 8,195 6,085 4,872 7,674 5,698 4,847 Table 2: Balance sheet of PepsiCo Total Assets Total Liabilities Shareholder equity 2005 31,727 17,476 14,320 2004 27,987 14,464 13,572 Table 3: Balance sheet of Coca-Cola Total Assets Total Liabilities Shareholder equity 2005 29,427 13,072 16,355 2004 31,441 15,506 15,935 Table 4: gross profit ratio 2005 2004 Gross income Sales GI/sales Gross income Sales GI/sales Pepsi 5,632 14,176.00 0.4 5,250 12,674 0.41 Coke 14,909 8,195.00 1.82 14,068 7,674 1.83 net profit ratio Net income Sales NI/sales Net income Sales NI/sales Pepsi 4,078 14,176.00 0.29 4,212 12,674 0.33 Coke 4,872 8,195.00 0.59 4,847 7,674 0.63 return on shareholder funds Net income Shareholders equity NI/equity Net income Shareholders equity NI/equity Pepsi 4,078 14,320.00 0.28 4,212 13,572 0.31 Coke 4,872 16,355.00 0.3 4,847 15,935 0.3 return on capital employed Net income Total assets Income/assets Net income Total assets Income/assets Pepsi 4,078 31,727.00 0.13 4,212 27,987 0.15 Coke 4,872 29,427.00 0.17 4,847 31,441 0.15 efficiency ratio Expenses (excl. interest) Revenue Exp./Rev. Expenses (excl. interest) Revenue Exp./Rev. Pepsi 26,640.00 32,562.00 0.82 24,002 29,261 0.82 Coke 17,019 23,104.00 0.74 16,044.00 21,742.00 0.74 sales to capital Sales Capital employed Sales to capital Sales Capital employed Sales to capital Pepsi 14,176.00 614.00 23.09 12,674 618.00 20.51 Coke 8,195.00 877.00 9.34 7,674 875.00 8.77 liquidity ratio Assets-liabilities Sales A-L/Sales Assets-liabilities Sales A-L/Sales Pepsi 14,251.00 14,176.00 1.01 13,523 12,674 1.07 Coke 16,355.00 8,195.00 1.2 15,895 7,674 2.07 current ratio Current assets Current liabilities CA/CL Current assets Current liabilities CA/CL Pepsi 10,454.00 9,406.00 1.11 8,639 6,752 1.28 Coke 10,250.00 9,836.00 1.04 12,281.00 11,133.00 1.1 gearing ratio Loan capital employed loan/capital Loan capital employed loan/capital Pepsi 5,971.00 614.00 9.72 5,599 618.00 9.06 Coke 4,518.00 877.00 5.15 4,531.00 875.00 5.18 interest cover ratio EBIT Int. exp. EBIT/Int. exp. EBIT Int. exp. EBIT/Int. exp. Pepsi 4,609.00 256.00 18 4,274.00 167.00 25.59 Coke 6,085.00 240.00 25.35 5,698.00 196.00 29.07 Read More
Cite this document
  • APA
  • MLA
  • CHICAGO
(“Financial Comparison of Pepsi Co. and Coca-Cola Book Report/Review”, n.d.)
Retrieved from https://studentshare.org/finance-accounting/1651703-financial-comparison-of-pepsi-co-and-coca-cola
(Financial Comparison of Pepsi Co. And Coca-Cola Book Report/Review)
https://studentshare.org/finance-accounting/1651703-financial-comparison-of-pepsi-co-and-coca-cola.
“Financial Comparison of Pepsi Co. And Coca-Cola Book Report/Review”, n.d. https://studentshare.org/finance-accounting/1651703-financial-comparison-of-pepsi-co-and-coca-cola.
  • Cited: 0 times

CHECK THESE SAMPLES OF Financial Comparisons between PepsiCo and Coca-Cola

Financial Analysis of Pepsi Cola Company

pepsico Inc.... There are now hundreds of product brands that belong to the business of pepsico Inc.... 48% of pepsico business is made up of Global Snacks like the Lay, Doritos, Cheetos, Tostitos, Sun Chips.... 69% of the current pepsico Inc.... Another owner of pepsico Inc.... pepsico Inc.... It would be important to know all these initial background in order to comprehend generalizations about pepsico Inc....
10 Pages (2500 words) Term Paper

Competitive Review of PepsiCo

pepsico is a world leader in convenient snacks, foods, and beverages, with revenues of more than $43 billion and over 185,000 employees.... The company consists of pepsico Americas Foods (PAF), pepsico Americas Beverages (PAB) and pepsico International (PI).... pepsico is one of the biggest soft drink, beverage, and convenient snacks companies.... Introduction of new brands has always been a favorite marketing strategy with pepsico management....
8 Pages (2000 words) Term Paper

Marketing Strategy of Pepsi and Coca Cola

Just as coca-cola have expected to create an image about their product that will persuade you to buy, so too have Pepsi.... This is certainly creating special images of their products in comparison to coca-cola.... he "coca-cola" trademark was registered for the first time in 1893, although it was seven years earlier that pharmacist Dr John Styth created a fragrant caramel-coloured syrup that went on sale as a soda fountain drink in Atlanta, Georgia....
18 Pages (4500 words) Essay

Pepsi vs. Coca Cola

This section will form the foundation of the research and will assist in the development of the comparison between the two companies.... Both the companies being giants in the industry will be compared and contrasted on three main areas, a) Strengths and weaknesses, b) financial perspectives and c) a comparison of the two companies as competitors.... Hence the financial performance of Coca Cola can be considered better than Pepsi....
4 Pages (1000 words) Case Study

Liquidity Measurement Ratios of Coke and Pepsi

Higher current ration indicates ability to meet the obligations.... According to Kuppapally (2008), a ratio of 2:1 is suitable for an organization's current ratio.... This,.... ... ... Coca Cola reported a current ratio of 1.... 71 in the year 2012 and this shows inability to meet short-term obligations because the value is far below the 2:1 ratio....
3 Pages (750 words) Essay

Business Model Used by PepsiCo

The paper "Business Model Used by pepsico" suggests that pepsico offers the world's largest food and beverage brands portfolio.... pepsico serves their customers with a range of products starting from cold beverages to tasty treats, which can deliver enjoyment and nutrition at an affordable price.... Although pepsico is a market leader, it is still hard for them to retain the market share in this competitive environment.... pepsico has always been a leading company in beverages advertising and promotions....
17 Pages (4250 words) Research Paper

Management - PepsiCo Australia & New Zealand

This company is the world leader in beverages and shares a competitive market share with other brands like coca-cola Inc.... This company is the world leader in beverages and shares a competitive market share with other brands like coca-cola Inc.... The company chosen for this problem solving project is, pepsico Australia & New Zealand.... The paper 'Management - pepsico Australia & New Zealand" is a great example of a management case study....
13 Pages (3250 words) Case Study

Financial Situation of Coca-Cola Company

The paper "Financial Situation of coca-cola Company" is a perfect example of a finance and accounting case study.... The report is exploring the financial situation of coca-cola Company.... The paper "Financial Situation of coca-cola Company" is a perfect example of a finance and accounting case study.... The report is exploring the financial situation of coca-cola Company.... The paper "Financial Situation of coca-cola Company" is a perfect example of a finance and accounting case study....
11 Pages (2750 words) Case Study
sponsored ads
We use cookies to create the best experience for you. Keep on browsing if you are OK with that, or find out how to manage cookies.
Contact Us