StudentShare
Contact Us
Sign In / Sign Up for FREE
Search
Go to advanced search...
Free

Area lassification and Methodology - Essay Example

Cite this document
Summary
The essay "Area Сlassification and Methodology" applies the statistical methods to geographical means and looks at the multivariate statistical analysis technique used and how labels were decided for the final set of clusters at distinct levels of hierarchy…
Download full paper File format: .doc, available for editing
GRAB THE BEST PAPER94.4% of users find it useful
Area lassification and Methodology
Read Text Preview

Extract of sample "Area lassification and Methodology"

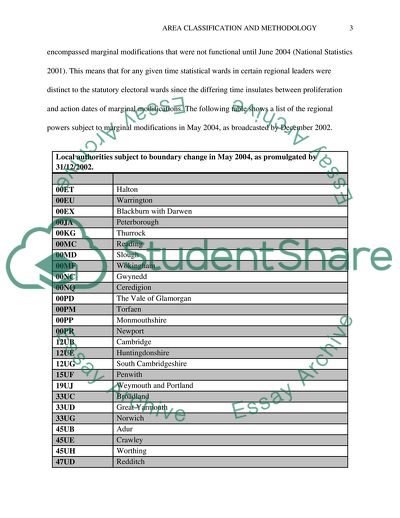
Geography, Area ification and methodology second Insert Geography, Area ification and methodology second Determination of national demographical statistics for intensely populated areas like UK has to be determined using national ward level methodology in the sense that they be able to cover all regions and every individual. This is also effective because a nation like England is entirely a subject to the administration of the UK Government in Westminster. This means that determination of the population and demographical statistics of such a country might be difficult if conducted at state or district level (National Statistics 2001). Therefore, the ultimate aim of this context is to examine the geography area classification and methodology used in determining the national area classification. It begins by explaining the details of the methodology of the national ward level classification to give a clear understanding of statistical wards and census area statistics (CAS) wards. It then assesses the concept of variables, which is also significant in classification followed by the choice of variable used (National Statistics 2001). The paper also looks at the multivariate statistical analysis technique used and how labels were decided for the final set of clusters at distinct levels of hierarchy. Details of the methodology of the national ward level classification Statistical Wards In 2003, certain policy was established across National Statistics to reduce the statistical effect of recurrent electoral ward boundary modifications, especially in England. Under the same policy, any modifications to English or Welsh ward margins broadcasted (as stated in statute) by the closing stages of a calendar year were applied for statistical reasons on 1 April of 2004, irrespective of the year the real modification occurred (National Statistics 2001). The wards that came because of this policy were termed as ‘statistical wards’. The 2003 statistical wards were appropriately those that were broadcasted by 31 December 2002. Therefore, these statistics mirrored the real electoral wards by May 2003, but for 28 regional powers, they also encompassed marginal modifications that were not functional until June 2004 (National Statistics 2001). This means that for any given time statistical wards in certain regional leaders were distinct to the statutory electoral wards since the differing time insulates between proliferation and action dates of marginal modifications. The following table shows a list of the regional powers subject to marginal modifications in May 2004, as broadcasted by December 2002. Local authorities subject to boundary change in May 2004, as promulgated by 31/12/2002. 00ET Halton 00EU Warrington 00EX Blackburn with Darwen 00JA Peterborough 00KG Thurrock 00MC Reading 00MD Slough 00MF Wokingham 00NC Gwynedd 00NQ Ceredigion 00PD The Vale of Glamorgan 00PM Torfaen 00PP Monmouthshire 00PR Newport 12UB Cambridge 12UE Huntingdonshire 12UG South Cambridgeshire 15UF Penwith 19UJ Weymouth and Portland 33UC Broadland 33UD Great Yarmouth 33UG Norwich 45UB Adur 45UE Crawley 45UH Worthing 47UD Redditch 47UE Worcester 47UG Wyre Forest In 2006, the then National Statistics Geography Group (NSGG) settled a modification to the policy (National Statistics 2001). The accomplishment that was settled on 1 April was kept but it now associates to those managerial and electoral regions that are statutorily effective on 31 December of the previous statutory electoral wards. This implies that statistical wards are no longer available after the last set that was generated in 2005. Census Area Statistics (CAS) Wards Census Area Statistics Wards were established for the 2001 census outputs, encompassing those present on the Neighborhood statistics (NeSS) website. In Wales and England, they were recognized to the 2003 statistical wards with exception of that 25 of the sub-threshold wards have been combined into seven getting wards to keep away from confidentiality threats of releasing data for very small regions. This has taken place to those wards with little than 100 occupants or 40 households as per the 2001 census) (National Statistics 2001). Scotland, on the other hand, has CAS wards but these are generated from best-fit Output Area (OA) aggregations to 2001 electoral wards. According to the statistics, there are 1,222 Scottish Census CAS wards, with a least size of 50 occupants and 20 households. It should also be clear that Scottish Census outputs employ distinct ward codes to the ONS customary. In Northern Ireland 2001 Census outputs, they employ the 582 electoral wards in presence at Census Day (National Statistics 2001). There was no obligation to initiate precise CAS wards all electoral wards go beyond the 100 occupants pr 40 households threshold. Nevertheless, just like Scotland, Northern Irish Census outputs employ distinct ward codes to the ONS standard. Understanding Variables The choosing procedure for the ward level 2001 Area Classifications is similar to that employed for the Local Authority Classification and it has come out that the first variables chosen are same with those with fewer modifications. The fundamental aim in variable selection is to choose the least number of variables that will sufficiently stand for the key measurements in the census data. For appearance reasons, this has been illustrated as household composition, demographic arrangement, housing, employment and socio-economic property. This is discussed in groups. The acquired data are from the 2001 main statistics tables generated by Census which are also present for the 2003 wards margins (National Statistics 2001). It should be clear that wards with a population size that is less than 1000 were merged with neighbors to make sure all wards had an average of 1000 individuals. These are referred to as statistical wards and are illustrated by census. The following are the key steps entailed in the selection of variables: I. Variables from main statistics tables were regarded for use. II. Variables were combined to generate compound variables for instance, the variable ‘Indian’ stands for individuals recognized as Indian, Bangladesh or Pakistan (National Statistics 2001). III. Powerfully associated variables were eliminated by assessing the comparison matrix. If a couple of variables had a person correlation coefficient beyond 0.82 or below -0.82, then one of the couple was regarded for elimination. It was essential to eliminate powerfully connected variables so that the concept of census data that they stand for did not have too much effect on the outcomes. IV. Variables with deficiently behaved allocation such as a high quantity of zeros were not incorporated. Therefore, it is clear that in both instances, the decision to incorporate or keep out a variable also engrossed using individual judgment (National Statistics 2001). Continuity with preceding classifications was regarded when making decision on whether to integrate or keep out a variable. Discussions concerning the choice of variables were conducted with the Area Classification Advisory Board. The advisory Board suggested conducting a principal element analysis to assist with variable selection. This was tried but never succeeded (National Statistics 2001). Choice of Census Variables The assessment was conducted using the main statistical tables generated from the census data. The variables are demographic and socio-economic (National Statistics 2001). The selected variables wrap the six measurements: household masterpiece, employment and industry section and demographic arrangement. This permit the least number of variables to be selected so that the six key census measurements were symbolized using the variable data. Multivariate Statistical Analysis Techniques used Multivariate statistical assessment is the multiple progressed methods for analyzing associations among several variables at the same time. Studies employ multivariate processes in researches that entail more than one reliable variable (also identified as a forecaster or occurrence of interest), more than one reliable variable (also called a forecaster) or both. Upper-level scholar courses and graduate courses in statistical educate multivariate statistical analysis (National Statistics 2001). However, this case uses ONS classification to assess the methodology techniques. The ONS classification is a pecking order categorization into duper groups, groups and mini-groups using clustering methods. Statistical Data Throughout the classification process, the entire clustering methods were centered on the likeliness or unlikeliest of the cases that were to be clustered (National Statistics 2001). This was gauged through building a distance matrix replicating all the variables in the data set for each matter. In case of any distinct scales or magnitudes, there must be occurrence of some difficulties. Generally, variables with bigger dispersion (with great standard deviations) have high effect on the final similarity measure. It was essential therefore to make every variable equivalently represented in the distance gauged by standardizing data. There are three main standardizations used for this case: Z-score standardization This is the most essential and ordinary form of standardization. It compares every value of a variable, Xi to the average X. this is then halved by the standard deviation of each variable, σ. Z-score standardization operates appropriately when the data are mostly distributed, nevertheless, data may not always be usually allocated (National Statistics 2001). Range Standardization This technique of standardization was applied in the 1991 classification. It compares every value of a variable, Xi, to the least, Xmin. This is then split by the distance between the least Xmin, and the maximum, Xmax, of the variable (National Statistics 2001). This technique does not operate efficiently if the data contain outliers. Inter-decile range standardization This technique is a minor variation of the range standardization technique that conquers the difficulty linked to the outliers (National Statistics 2001). This technique contrasts each value of a variable, Xi, to the median, Xmed, which is then split by the distance between the 90th percentile, and the 10th percentile X90th, and the 10th percentile, X10th. The first experimentation using the inter-decile range standardization data disclosed that variables with a highly skewed allocation were directing the classification that is the skewed variables were issued with too much weight by the inter-decile range standardization using the range standardization technique (National Statistics 2001). Therefore, the range standardization is used to standardize the ward level data. Let it be clear that this is distinct from the Local Authority and Health Area Level data where inter-decile range standardization operates efficiently. Defining the Clustering Technique Despite the fact that there are numerous techniques of hierarchical cluster assessments present, they are categorized into two key types of clustering: the agglomerative technique and the K-means refinement technique (National Statistics 2001). Agglomerative technique This technique progresses by a sequence of fusions, or divisive techniques responsible for unraveling groups into finer groupings. Agglomerative processes are possibly the most broadly employed of the hierarchical techniques and were employed for the ONS classifications (National Statistics 2001). Note that this ward technique is the most commonly employed because it is the ordinary technique for clustering. K-means refinement This is the easy non-parametric clustering technique that reduces the within-cluster variability and maximizes the between cluster variability. The K-means technique demands that the number of clusters be stated in advance (National Statistics 2001). It is an iterative relocation algorithm centered on an error sum of squares. The algorithm recurringly moves a case from one cluster to another to observe whether the shift advances the sum of squares within each cluster. The case is allocated or re-allocated to the cluster to which it brings the highest development. When all the cases have been practiced, the algorithm shifts to the next iteration (National Statistics 2001). A stable classification is acquired when there are no more shifts in a full iteration. The following figure shows agglomerative schedule for the classification of the statistical wards. From the graph, it is clear that the most favorable levels can be acquired on the basis of where there is a native leveling off in the slope of the line (National Statistics 2001). Rise in distance between the most unlike statistical wards within combined cluster. Bibliography National Statistics 2001Area Classification. Area Classification for Statistical Wards – Methods. retrieved from https://mail-attachment.googleusercontent.com/attachment/?view=att&th=135e17745fb88376&attid=0.1&disp=vah&realattid=f_gzf3v4ip0&safe=1&zw&saduie=AG9B_P89dwt6PAsiVRPGyDiRfACK&sadet=1330953183101&sads=ByOdGMDV7ZTfNaPU5_kP8d-4Leg Read More
Cite this document
  • APA
  • MLA
  • CHICAGO
(Area lassification and Methodology Essay Example | Topics and Well Written Essays - 1750 words, n.d.)
Area lassification and Methodology Essay Example | Topics and Well Written Essays - 1750 words. https://studentshare.org/geography/1767900-geography-area-classification-and-methodology-second
(Area Lassification and Methodology Essay Example | Topics and Well Written Essays - 1750 Words)
Area Lassification and Methodology Essay Example | Topics and Well Written Essays - 1750 Words. https://studentshare.org/geography/1767900-geography-area-classification-and-methodology-second.
“Area Lassification and Methodology Essay Example | Topics and Well Written Essays - 1750 Words”. https://studentshare.org/geography/1767900-geography-area-classification-and-methodology-second.
  • Cited: 0 times

CHECK THESE SAMPLES OF Area lassification and Methodology

Writing Scientific Report

(Banman, 2001) A walk through of the methodology is presented below to enhance understanding.... Introduction Remote sensing techniques can be used reliably to classify vegetation and to differentiate between vegetation of different kinds.... hellip; Introduction Remote sensing techniques can be used reliably to classify vegetation and to differentiate between vegetation of different kinds....
22 Pages (5500 words) Coursework

The Resort Classification Criteria

Critique Name Tutor Date Introduction Resort classification has failed to produce a definition that are based on a firm description of resort.... The article proposed such a classification that allows industry comparisons through typologies and geographic limits.... hellip; Classification Taxonomy of Resorts (Brey, 2013) starts by highlighting the issue at hand stating resorts have not been classified....
5 Pages (1250 words) Assignment

Article critique in Higher Education

This area is one of the weak points of this study.... Considering the increase in the needed quality and the supply of mathematics and science teachers within the community, the article focuses on the National Science Foundation (NSF) and Phi Theta Kappa (PTK) project that was implemented in the community. This article was never… All information written by the authors come from their own personal views....
5 Pages (1250 words) Essay

Police Recorded Crime and British Crime Survey

Any observer looking at these two graphs would immediately notice that they portrayed two completely different perceptions of the crimes committed in the area.... There are multiple reasons why these two graphs show different perceptions of crimes committed in this area....
4 Pages (1000 words) Essay

Identifying, Stating, and Addressing Research Problems

(Rogers, 2008) Research methodology adapted for the assessment of “dishonesty and deception” increasingly has been standardized.... Deception is a typical element of life.... Not surprisingly, it frequently occurs when a person wishes to acquire employment or some other advantage and suppresses information that could… (Swets, 1973)But in employment circumstances, the nature of the information required tends to be specific....
5 Pages (1250 words) Essay

Case study>State Firm: Dangerous Intersections

he research methodology employed by State Firm has been effective in trying to curb the menace of accidents on intersections.... The research methodology used is inquiry mode that uses the unstructured approach.... This methodology aims at describing the variation of the phenomenon or situation.... A qualitative research methodology is appropriate since it gives the researcher a chance to explore the precise nature of the phenomenon without quantifying the issue....
2 Pages (500 words) Essay

Principles of Marketing

Customers classify products under generic brand names because of a particular brand been dominant in the market or having existed in the market for a long time.... For instance, brands such as sellotape, Hoover and biro are considered more than just brand names but a noun or an… Consumers buy these products are motivated by quality assurance and superiority of the brand. Customers buy Toyota vehicles because they are assured of performance and quality....
4 Pages (1000 words) Term Paper

Remote Sensing and Image Processing

The methodology used for this task involves the calculation of the Ratio Vegetation Index (RVI) as well as the Normalized Difference Vegetation Index (NDVI) for Lake Nakuru Thematic Mapper (TM) image.... This study presents the details of activities performed in class practices for the course of Remote Sensing and Image processing....
8 Pages (2000 words) Case Study
sponsored ads
We use cookies to create the best experience for you. Keep on browsing if you are OK with that, or find out how to manage cookies.
Contact Us