StudentShare
Contact Us
Sign In / Sign Up for FREE
Search
Go to advanced search...
Free

JD Sports Fashion Financial Analysis - Case Study Example

Cite this document
Summary
The company was formed in 1981 by John Wardie and David Makin, it name was derived from the initials of the founders’ first names. JD started from just one store in Bury,…
Download full paper File format: .doc, available for editing
GRAB THE BEST PAPER96.8% of users find it useful
JD Sports Fashion Financial Analysis
Read Text Preview

Extract of sample "JD Sports Fashion Financial Analysis"

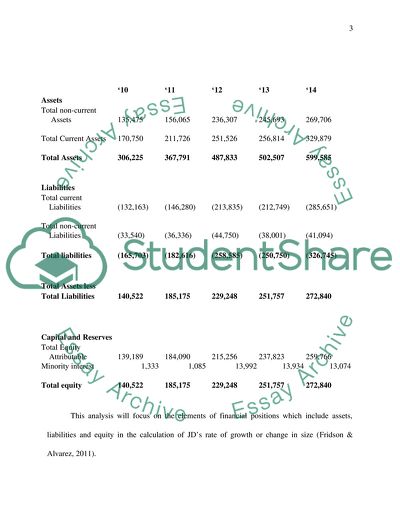
JD Sports Fashion Financial Analysis General JD Sports Fashion plc, commonly known as JD, is a retail company that mainly deals with sports fashion. The company was formed in 1981 by John Wardie and David Makin, it name was derived from the initials of the founders’ first names. JD started from just one store in Bury, Great Manchester, England but it has expanded over the years to over 800 stores in six countries. Some of the factors that have given JD an edge in the fashion and sportswear industry include demand for products, and competitive prices for latest products from the best brands. Most of the company’s revenue comes from its line of sportswear, fashion wear and outdoor products. JD’s major cost elements include provisions against slow moving stock, warehouse costs, property leases, stock and inventory, IT and general infrastructure improvement, among other standard operational costs. Financial Analysis Size and Growth Analysis This analysis focuses on the four years period ending in February 2014 with 2010 being the base year. All the items on the financial statements for successive years will be compared with the items on the financial statements of 2010. Below is a table showing the trends followed by some aspects of JD’s financial positions over the four-year period (JD Sports Fashion plc. 2012; JD Sports Fashion plc 2012). ‘10 ‘11 ‘12 ‘13 ‘14 Assets Total non-current Assets 135,475 156,065 236,307 245,693 269,706 Total Current Assets 170,750 211,726 251,526 256,814 329,879 Total Assets 306,225 367,791 487,833 502,507 599,585 Liabilities Total current Liabilities (132,163) (146,280) (213,835) (212,749) (285,651) Total non-current Liabilities (33,540) (36,336) (44,750) (38,001) (41,094) Total liabilities (165,703) (182,616) (258,585) (250,750) (326,745) Total Assets less Total Liabilities 140,522 185,175 229,248 251,757 272,840 Capital and Reserves Total Equity Attributable 139,189 184,090 215,256 237,823 259,766 Minority interest 1,333 1,085 13,992 13,934 13,074 Total equity 140,522 185,175 229,248 251,757 272,840 This analysis will focus on the elements of financial positions which include assets, liabilities and equity in the calculation of JD’s rate of growth or change in size (Fridson & Alvarez, 2011). Assets Rate of Growth %: = [(Comparison Year –Base Year) ÷ Base Year] × 100% 2010-2011 = [(£367,791 - £306,225) ÷ £306,225] × 100% = 20.1% 2011-2012 = [(£487,833 - £306,225) ÷ £306,225] × 100% = 59.3% 2012-2013 = [(£502,507 - £306,225) ÷ £306,225] × 100% = 64% 2013-2014 = [(£599,585 - £306,225) ÷ £306,225] × 100% = 95.7 Liabilities Rate of Growth %: = [(Comparison Year –Base Year) ÷ Base Year] × 100% 2010-2011 = [(£182,616 - £165,703) ÷ £165,703] × 100% = 10.2% 2011-2012 = [(£258,585 - £165,703) ÷ £165,703] × 100% = 56.05% 2012-2013 = [(£250,750 - £165,703) ÷ £165,703] × 100% = 51.3% 2013-2014 = [(£326,745 - £165,703) ÷ £165,703] × 100% = 97.1% Equity Rate of Growth %: = [(Comparison Year –Base Year) ÷ Base Year] × 100% 2010-2011 = [(£185,175 - £140,522) ÷ £140,522] × 100% = 31.7% 2011-2012 = [(£229,248 - £140,522) ÷ £140,522] × 100% = 63.1% 2012-2013 = [(£251,757 - £140,522) ÷ £140,522] × 100% = 79.1% 2013-2014 = [(£272,840 - £140,522) ÷ £140,522] × 100% = 94.1% From the calculations, it is evident that JD has grown tremendously over the past four years. The assets, the liabilities and equity have comparatively increased to above 90 percent in comparison to the base year over the past four years (Brechner, 2012, p 40). This indicates that the dynamism of the company is progressive hence JD is almost attaining its full potential and, JD can generate enough revenue to satisfy the needs created by rising costs (Helfert, 2002, p78). Profitability Analysis Gross Profit on Sales % = (Gross Profit ÷ Sales Revenue) × 100% Gross Profit on Sales % (2010): = (£379,537 ÷ £769785) × 100% = 49.3% Gross Profit on Sales % (2011): = (£437, 012 ÷ £883,669) × 100% = 49.4% Gross Profit on Sales % (2012): = (£520,847 ÷ £1,059.523) × 100% = 49.1% Gross Profit on Sales % (2013): = (£613,488 ÷ £1,258,892) × 100% = 48.7% Gross Profit on Sales % (2014): = (£645,130 ÷ £1,330,578) × 100% = 48.3% This shows that for every pound of sales, JD earns an average of 49 cents in profits after spending about 51 cents in production. Considering this rate has been maintained throughout the four-year period, the company’s sales have been steady and the profit margin is high enough to encourage investment, it means the use of raw materials and labor in JD is very efficient (Lee et al. 2009, p 56). Return on Sales % = (Operating Income ÷ Sales Revenue) × 100% Return on Sales % (2010): = (£62,308 ÷ £769,785) × 100% = 8.09% Return on Sales % (2011): = (£75,643 ÷ £883,669) × 100% = 8.5% Return on Sales % (2012): = (£66,776 ÷ £1,059,523) × 100% = 6.3% Return on Sales % (2013): = (£55,975 ÷ £1,258,892) × 100% = 4.4% Return on Sales % (2014): = (£59,052 ÷ £1,330,578) × 100% = 4.4% The percentage has been progressively reducing from an average of eight to approximately four percent. This indicates that initially, JD spent about eight cents on expenses unrelated to production to make a pound in sales. These unrelated costs reduced to four cents over the four-year period hence JD is highly effective on cost-cutting especially on administrative expenditure and, subsequent boosting of efficiency in production (Pehlivan, 2011, p 54). Return on Assets%: = (Operating Income ÷ Total Assets) × 100% Return on Assets% (2010): = (£62,308 ÷ £306,225) × 100% = 20.3% Return on Assets% (2011): = (£75,643 ÷ £367,791) × 100% = 20.6% Return on Assets% (2012): = (£66,776 ÷ £487,833) × 100% = 13.68% Return on Assets% (2013): = (£55,975÷ £502,507) × 100% = 11.1% Return on Assets% (2014): = (£59,052 ÷ £599,585) × 100% = 9.8% This indicates that JD has a capability of generating an average of 18 cents from every pound the company holds in assets. Even though the rates have been diminishing over the four-year period, the company’s assets are still being put into proper productive use as indicated by the positive percentages. Risk on Equity %: = (Operating Income ÷ Total Sales) × 100% Risk on Equity % (2010) = (£42,746 ÷ £140,522) × 100% = 30.4% Risk on Equity % (2011) = (£55,867 ÷ £185,175) × 100% = 30.1% Risk on Equity % (2012) = (£49,349 ÷ £229,248) × 100% = 21.5% Risk on Equity % (2013) = (£41,242 ÷ £251,757) × 100% = 16.4% Risk on Equity % (2014) = (£41,486 ÷ £272,840) × 100% = 15.2% This shows that JD makes an average of 23 cents for every pound invested in the company. Even though the returns have been diminishing over the four-year period, the rate is still satisfactory especially in the fashion industry. Liquidity Analysis Current Ratio: = Currents Assets ÷ Current Liabilities 2010 = £170,750 ÷ £132,163 = 1.3: 1 2011 = £211,726 ÷ £146,280 = 1.45: 1 2012 = £251,526 ÷ £213,835 = 1.2: 1 2013 = £256,814 ÷ £212,749 = 1.2:1 2014 = £329,879 ÷ £285,651 = 1.2: 1 Quick ratio = (Current Assets – Inventory) ÷ Current Liabilities 2010 = (£170,750 - £74,569) ÷ £132,163 = 0.73: 1 2011 = (£211,726 - £84,490) ÷ £146,280 = 0.87: 1 2012 = (£251,526 - £130,355) ÷ £213,835 = 0.57: 1 2013 = (£256,814 - £146,569) ÷ £212,749 = 0.52: 1 2014 = (£329,879 - £186,116) ÷ £285,651 = 0.5: 1 The current ratio averages at 1.3 for all the four years being analyzed. The ratio reduced from about 1.4 to a flat rate of 1.2 during the period between 2010 and 2014. This ratio indicates that for every one pound in current liability, JD has about one pound and twenty cents in current assets hence it can pay its current liabilities from the liquidation of its current assets. Therefore, JD is in a secure financial position (Peterson & Fabozzi, 2012, p 38).  Since the quick ratio averages at 0.64, JD’s ability to satisfy its short-term obligations using its most liquid assets is satisfactory. This means that JD can meet its short-term objectives in adverse conditions as long as the collection of receivables does not slow down. Cash Generation JD has a very stable cash flow, and this has been maintained over the four year period. The table below compares some of the aspects of the cash flow statement as this will indicate the company’s commendable cash generation. 2010 2011 2012 2013 2014 Operating Activities 75,616 75,695 68,907 34,728 73,195 Investing Activities 29,284 40,695 65,151 35,620 64,195 Financing Activities 7,773 9,850 26,690 13,624 12,895 Cash and Equivalents 38,559 25,448 (25,934) (14,516) 25,825 Amount at Beginning 23,538 62,097 87,545 61,611 46,228 Amount at End 62,097 87,545 61,611 46,228 72,043 From this table above, it is evident that JD has a stable cash generation system since the amounts at the end of every fiscal period have increased from the amount in the base year. The only period where the trend changed was in the fiscal year between 2012 and 2013. This change can be attributed to the conversion of cash and cash equivalents to fixed assets as indicated by the decrease in this element of the cash flow statement. The conversion of cash and cash equivalents to non-current assets reduces the amount of cash available even though it does not affect the operations of the company (Weygandt et al. 2010, p 112). References BRECHNER, R. A. 2012. Contemporary mathematics for business and consumers. Australia, South-Westen/Cengage Learning. FRIDSON, M. S., & ALVAREZ, F. 2011. Financial statement analysis a practitioners guide, fourth edition. Hoboken, N.J., John Wiley & Sons. HELFERT, E. A. 2002. Techniques of financial analysis. Boston, Mass, Irwin McGraw-Hill. JD Sports Fashion Plc, 2012 Annual Report and Accounts [Online]. Available from: http://www.jdplc.com/investor-relations.aspx [accessed 14 April 2015] JD Sports Fashion Plc, 2014. Annual Report and Accounts [Online] Available from: http://www.jdplc.com/investor-relations.aspx. [accessed 14 April 2015] LEE, A. C., et.al., 2009. Financial analysis, planning & forecasting: theory and application. Singapore, World Scientific. PEHLIVAN, C. N. 2011. Financial Analysis and Valuation of INDITEX A Business Valuation Report and Theoretical Study. München, GRIN Verlag GmbH. http://nbn-resolving.de/urn:nbn:de:101:1-20111010968. PETERSON, P., & FABOZZI, F. J. 2012. Analysis of financial statements. New York, Wiley WEYGANDT, J. J., et.al., 2010. Managerial accounting: tools for business decision making. Hoboken, NJ, Wiley. Read More
Cite this document
  • APA
  • MLA
  • CHICAGO
(Evaluation report of the JD sports fashion plc Essay, n.d.)
Evaluation report of the JD sports fashion plc Essay. https://studentshare.org/finance-accounting/1869875-evaluation-report-of-the-jd-sports-fashion-plc
(Evaluation Report of the JD Sports Fashion Plc Essay)
Evaluation Report of the JD Sports Fashion Plc Essay. https://studentshare.org/finance-accounting/1869875-evaluation-report-of-the-jd-sports-fashion-plc.
“Evaluation Report of the JD Sports Fashion Plc Essay”. https://studentshare.org/finance-accounting/1869875-evaluation-report-of-the-jd-sports-fashion-plc.
  • Cited: 0 times

CHECK THESE SAMPLES OF JD Sports Fashion Financial Analysis

The Business and Financial Performance of an Organisation over a Three Year Period

216) predicted the future of online pop-ups to be a part of the retail fashion industry particularly applicable to women between the age bracket of 16 to 35.... Secondly, this is a modern way of doing business in the fashion clothing industry, because most retailers are selling mostly through department stores opened in many countries, while ASOS focuses more on online fashion retailing.... The evaluation of the Business and Financial performance of a business will allow me to look at their financial statements in detail....
29 Pages (7250 words) Dissertation

Key Performance Indicators

       ‘jd sports' is another retail company running in UK.... From 1981, in Oxford Street, the company started their business and clothing, footwear, sports items and accessories are the main products.... Social Accountability ... ntroduction ... ince the emergence of economic crisis, the concept of Corporate Social Responsibility (CSR) and social accountability has emerged as an important consideration amongst the corporate member and regulators around the world....
7 Pages (1750 words) Assignment

Profitability Indicator Ratios: Profit Margin Analysis

A brief historical account jd sports fashion plc was established as the premier and cutting edge retailer of fashionable branded casual wear.... In the financial year 2002, jd sports acquired nearly 200 stores and the highlight among them the acquisition of first sport, a renowned sport retailer.... jd sports have made substantial investment in brands, business, multi-channel and other infrastructure to improve and enhance the financial outlook of the company....
32 Pages (8000 words) Assignment

Port of Brisbane Corporation

The Port of Brisbane Corporation is the most rapidly developing participant in the Australian port management industry.... Currently, the Port of Brisbane is the largest general cargo port in the region of Queensland with more than 2,600 ships exchanging over 26 million tons of cargo over the Port's wharves annually....
9 Pages (2250 words) Essay

Revenue Growth of the JD Sports Company

n summary, jd sports generates and increases its.... he cost controls at jd sports seem managed and properly monitored.... This shows, apparently, a strong cost controlling mechanism working at jd sports.... This further illuminates the tight direct cost control system of jd sports which maintains the levels of earnings and expenses as much as possible.... For comparison, Marks & Spencer's financial statements are used at various places within the report. ...
9 Pages (2250 words) Coursework

External and Internal Retail Industry of the UK

D sports fashion plc.... hree companies are selected for the analyses which are J D Sport fashion plc.... The research question is to be answered by considering three main retail companies operating in the country which are J D Sport fashion plc, Sports Direct International PLC and Next Plc.... Sports Direct International plc.... and Next plc.... Next plc.... ports Direct International plc....
11 Pages (2750 words) Essay

Consumer Integrated Marketing Communications Campaign

This paper "Consumer Integrated Marketing Communications Campaign" aims to create a model that visualises the steps for a consumer campaign, showing what factors influence each step.... Relevant pieces of literature are consulted in order to come up with a model.... .... ... ... The segment's behaviour regarding the decision to purchase the brand is an important consideration in all the aspects of communicating the brand's positioning....
10 Pages (2500 words) Case Study

Plc Performance in the UK and Europe

The paper "plc Performance in the UK and Europe" presents that next plc is a U.... billion (Next plc, 2015a).... The current paper is an effort dedicated to the strategic evaluation of Next plc.... The main objective of the current paper is to analyze the profitability and sales-related strategies of Next plc in Europe and the U.... The current paper briefly analyses the various reasons for Next plc to be financially successful....
6 Pages (1500 words) Term Paper
sponsored ads
We use cookies to create the best experience for you. Keep on browsing if you are OK with that, or find out how to manage cookies.
Contact Us