StudentShare
Contact Us
Sign In / Sign Up for FREE
Search
Go to advanced search...
Free

Financial Performance, Profit Margin, and Gross Profit Margin of Sainsbury and Tesco - Coursework Example

Cite this document
Summary
Sainsbury and Tesco are leading companies in the retail sector of the UK. The report will analyse and compare the financial performance of the two companies between 2013 and 2013…
Download full paper File format: .doc, available for editing
GRAB THE BEST PAPER95.5% of users find it useful
Financial Performance, Profit Margin, and Gross Profit Margin of Sainsbury and Tesco
Read Text Preview

Extract of sample "Financial Performance, Profit Margin, and Gross Profit Margin of Sainsbury and Tesco"

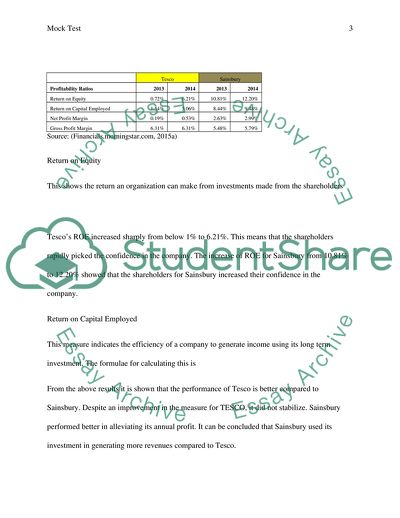
Mock Test By Mock Test Question Introduction The aim of this section is to assess and evaluate the financial performance of Sainsbury and Tesco. Sainsbury and Tesco are leading companies in the retail sector of the UK. The report will analyse and compare the financial performance of the two companies between 2013 and 2013. The evaluation is based on the ratio analysis which includes the liquidity ratio, the gearing ratio, profitability ratio, and cash flow ratios. The profitability ratio compares the two companies based on the gross profit margin, ROCE, ROE, and net profit margin. From the analysis it was evident that Sainsbury performs better than Tesco. Additionally, the liquidity ratio entails the quick ratio and current ratio From the analysis it is evident that Tesco performs much better than Sainsbury based on asset transformation and having enough assets to offset their liabilities. The cash flow ratios entail the adequacy of their cash flows and profit. From the results it is suggested that Sainsbury is in a better form than Tesco. The company has a higher capacity of meeting its daily obligation and the ability in generating profit in terms of cash, unlike Tesco. From the analysis it is quite evident that the operations and business of Sainsbury is efficient and effective compared to Tesco between 2013 and 2014. Profitability Ratios This ratio shows the profitability stance of the two companies. This section will cover the net profit margin, ROCE, and Gross Profit Margin. As shown in the table below   Tesco Sainsbury Profitability Ratios 2013 2014 2013 2014 Return on Equity 0.72% 6.21% 10.81% 12.20% Return on Capital Employed 1.54% 5.06% 8.44% 9.48% Net Profit Margin 0.19% 0.53% 2.63% 2.99% Gross Profit Margin 6.31% 6.31% 5.48% 5.79% Source: (Financials.morningstar.com, 2015a) Return on Equity This shows the return an organization can make from investments made from the shareholders Tesco’s ROE increased sharply from below 1% to 6.21%. This means that the shareholders rapidly picked the confidence in the company. The increase of ROE for Sainsbury from 10.81% to 12.20% showed that the shareholders for Sainsbury increased their confidence in the company. Return on Capital Employed This measure indicates the efficiency of a company to generate income using its long term investment. The formulae for calculating this is From the above results it is shown that the performance of Tesco is better compared to Sainsbury. Despite an improvement in the measure for TESCO, it did not stabilize. Sainsbury performed better in alleviating its annual profit. It can be concluded that Sainsbury used its investment in generating more revenues compared to Tesco. Operating Profit Margin The measure indicates how much money a company earns from the sales it makes. The formula for calculating this is From the above results it is shown that the net profit margin of Sainsbury was higher than Tesco’s. This can therefore be concluded that Sainsbury performs better that Tesco when it comes to generation of income between 2013 and 2014. Gross Profit Margin This indicates the earning after deducting costs during the production of goods and services. The formula for gross profit margin is Based on the gross profit margin, Sainsbury recorded a better performance. Although Tesco has a higher margin, it is evident that its margin remained stagnant. Sainsbury’s margin was lower but in an ascending trend. Therefore, Sainsbury performed better compared to Tesco between 2013 and 2014. Liquidity Ratio This is a measure indicating the ability of a firm to offset its short term liabilities. The two types of ratios used in this include the acid test ratio and current ratio. Table two shows the liquidity ratio of Tesco and Sainsbury   Tesco Sainsbury Liquidity Ratios 2013 2014 2013 2014 Current Ratio 65.66% 67.37% 61.44% 65.02% Quick/Acid Ratio 45.94% 50.89% 29.76% 49.65% Source: (Markets.ft.com, 2015) The current ratio shows the ability of a company to converts its short term assets to cash. The formulae for generating this is From the above results it is evident that Tesco had a higher performance compared to Sainsbury between 2013 and 2014. Equally, there was an increase in Sainsbury current ration meaning that the company has the ability of transforming its current assets into cash. Therefore, the two companies performed better in converting their current assets into cash, but Tesco performed much better. Acid Test Ratio This is a measure that stipulates if a company has sufficient assets in covering their short liabilities without disposing of their inventories. The formula for getting this is From the table above, it is evident that Tesco performs best compared to Sainsbury meaning that Sainsbury has less short term asset to cover their liabilities. Efficiency Ratio This is a ratio that is important in making companies understand their efficiency in asset utilization (Gibson & Frishkoff, 2009). Additionally, it explains how the company manages some of its assets. Some of the efficiency ratios include the asset turnover days and the inventory turnover days. The inventory turnover and asset turnover for the two companies is as shown below   Tesco Sainsbury Efficiency Ratios 2013 2014 2013 2014 Inventory Turnover 16.55% 16.27% 22.88% 22.65% Asset Turnover 1.28% 1.27% 1.86% 1.64% Source: (Financials.morningstar.com, 2015b) Inventory Turnover This indicator is measured based on the number of days. It explains the time taken for the company to convert some of its inventories into revenues. The lesser days a company takes in transforming into sales the better its performance. The formula for calculating the inventory turnover is It is shown that between 2013 and 2014, the Tesco was able to transform the inventories into cash between 17 and 15 days. On the other hand, Sainsbury was able to convert its inventories to cash between 22 and 23 days. Therefore, Tesco performed better compared to Sainsbury. Average Trade Payables settlement = (2013 Trade Payables+2014 Trade Payables)/2)/Cost of sales *365 This is an indicator defining how a company is able to deploy some of its assets. If a company registers a higher ratio, then the company performs best. This is because it denotes the ability of a company to generate more income. From the above table, it shows that Sainsbury has a higher asset turnover between 2013 and 2014, compared to Tesco. Average Trade receivables settlement The formula for coming up with the ratio is From the calculations it is evident that the average trade receivables settlement for Sainsbury is higher compared to Tesco. This means that Sainsbury is more likely to be a going concern business in the future compared to Tesco. Gearing Ratios This is a ratio that measures a company’s financial leverage. It signifies the rate at which the activities of a firm are financed by owner’s capital against the funds of the creditors. Therefore, when a firm has a higher gearing ratio, the riskier it is since the firm has the ability to offset its debt despite the sale’s bad record. The two ratios considered in this are interest cover and gearing ratio.   Tesco Sainsbury Gearing Ratios 2013 2014 2013 2014 Gearing Ratios 62% 71% 53% 59% Interest Cover 6.91 6.92 6.78 6..76 Source: (Markets.ft.com, 2015) Gearing Ratio This measure is calculated by From the above table, it is evident that Sainsbury recorded a lower gearing ratio in the last two years compared to Tesco. This means that Tesco is riskier compared to Sainsbury. Sainsbury is in the best position based on their financial leverage. Interest Cover Interest cover measures the amount of operating profit that is available to offset the interest payable. When the operating profit is lower, the shareholders and the lender are at high risk. The formula for calculating the interest cover is The results from the calculation show that Sainsbury’s interest cover was lower during the two years compared to Tesco. There was a crucial remark that the interest cover for Tesco was twice as high compared to previous years. Tesco finds it difficult to maintain the percentage. Sainsbury on the other hand found it easy, making the company to be in the best position. Overall Financial Performance In conclusion, the performance of Sainsbury outweighed he performance of Tesco except on matters of liquidity. Sainsbury has an outstanding position based on their profitability effectiveness. Additionally, the efficiency ratio for Sainsbury is higher compared to Tesco’s. Also, Sainsbury has a better position to pay their suppliers based on the gearing ratio. Horizontal Analysis Horizontal Analysis   Sainsbury     Tesco     Balance Sheet 2014 2013 Difference % change 2014 2013 Difference % Change Total Current Asset 4362 1901 2461 1.2945818 13085 12465 620 0.0497393 Total Assets 16540 12695 3845 0.3028751 50164 50129 35 0.0006982 Total Current Liabilities 6795 3115 3680 1.1813804 21399 18985 2414 0.127153 Deferred Income Tax 227 277 -50 -0.1805054 594 1006 -412 -0.4095427 Total Liabilities 10537 6858 3679 0.5364538 35449 33486 1963 0.0586215 Total Equity 6003 5837 166 0.0284393 14715 16643 -1928 -0.1158445 Total Liability and Shareholders’ equity 16540 12695 3845 0.3028751 50164 50129 35 0.0006982 Income Statement                 Total Revenue 63557 63406 151 0.0023815 23949 23303 646 0.0277218 Total Operating Expense 60926 61024 -98 -0.0016059 22940 22421 519 0.0231479 Operating Income 2631 2382 249 0.104534 1009 882 127 0.1439909 Net Income 974 28 946 33.785714 716 602 114 0.1893688 Cash Flow                 Total Cash from Operations 939 981 -42 -0.0428135 2878 2818 60 0.0212917 Capital Expenditures -929 -1093 164 -0.1500457 -2881 -2987 106 -0.0354871 Total Cash from Investing 426 -862 1288 -1.4941995 -2854 -278 -2576 9.2661871 Dividends Paid -320 -308 -12 0.038961 -1189 -1184 -5 0.004223 Cash From Financing -290 -354 64 -0.180791 56 -2365 2421 -1.0236786 Net Change in Cash 1075 -235 1310 -5.5744681 -25 201 -226 -1.1243781 In the year 2013 and 2014, it is evident from the above changes that the performance of the Sainsbury outperformed that of Tesco. The above report is important because it allows the shareholders to make a better decision via comparative assessment of financial statement between the two companies. Based on their competitors, they use this information to analyse on market entry to expand their market share. Additionally, the two companies can use the information to discover some critical strategies behind their poor performance. Subsequently, the companies can make evaluations and assessment whether to provide loans to the two companies (Muro, 2008). The companies have met the objective of International Financial and Regulation Standards especially Sainsbury (Robinson, 2009). This is because the financial statement that the company provides in their website meets the demand of public interest. Based on the first objective of the foundation, Sainsbury has developed a financial structure in the interest of the public. Sainsbury has set out set of understandable and globally recognised standards of financial reporting according to the articulated principles. The information is updated and understandable to help the investors in making concrete investment decisions. Question 2 a) i) Statement of Financial Performance Statement of Financial Performance as at 31st December 2014 Total Revenue   Sales £ 900,000.00 Dividend £ 4,500.00 Less   Cost of Goods Sold £ 57,000.00 Gross Profit £ 847,500.00     Less   Expenses   Administrative Cost £ 24,000.00 Purchases £ 730,500.00 Accumulated Depreciations £ 135,000.00 Total Depreciation £ 48,000.00 Total Expenses £ 937,500.00     Net Profit -£ 90,000.00 ii) Statement of Financial Position [ Scarlett Ltd] Statement of financial position as at 31st December 2014             2014       Pounds   Assets       Non-Current Assets       Property, Plant & Equipment   £ 660,500.00   Goodwill   £ -   Intangible Assets   £ -       £ 660,500.00           Current Assets       Inventories   £ 32,000.00   Trade Receivables   £ 68,000.00   Cash and cash equivalents   £ 48,500.00       £ 148,500.00   Total Assets   £ 809,000.00           Equity and Liabilities               Equity       Share Capital   £ 450,000.00   Retained Earnings   £ 69,000.00   Revaluation Reserve   £ -   Total Equity   £ 519,000.00           Non-current liabilities       Long-term borrowings   £ -           Current Liabilities       Trade and other payables   £ 53,000.00   Short-term borrowings   £ -   Current portion of long-term borrowings   £ -   Current tax payable   £ 15,000.00   Total current liabilities   £ 68,000.00   Total liabilities   £ 68,000.00   Total equity and liabilities   £ 587,000.00   b) Trial balance records balances from ledger accounts on specific dates. Trial balance forms the first step in preparing financial statements. The preparation of the records is done when an accounting period ends and helps to draft financial statements. The expenses and assets of a firm appear on the debit side while the income, capital, and liabilities appear on the credit side. The records found in the trial balance formthe basis of preparing financial statements. The closing balances are dependent if the account is related to the balance sheets (equity, liabilities, and assets) and income statement (income and expenses). The ledger accounts for the balance sheet are closed by carrying forward to the next accounting period. Trial balance ensures there is a corresponding debit and credit record based on the concept of double entry. Additionally, trial balance ensures that the balances are extracted from the accounting ledgers and helps in rectifying and identifying the errors. Conversely, trial balance only ascertains that the credit and debit balances are balanced. The totals for the credit and debit balance might agree despite having errors. For instance, an erratic debit entry can be offset by a wrong credit entry. Additionally, trial balance gives no evidence that some of the transactions are not on records. Question 3 a) From the company’s cash flow statement, AB plc has the ability to earn 144 m pounds from its day to day business activity. The operating cash flow of 144 pounds uncovers the true profitability of AB plc. The net cash used in investing activities is -78million pounds. This is not a good statistics for the company because it is negative (Palepu, Healy & Bernard, 2000). The operating cash flows reports the changes on the cash that the company invests compared to the static amount. Additionally, the company tends to record a negative figure from cash flows gotten from financing activities. Some of the lucrative activities that the company benefits from include issuing of ordinary shares and increase in the cash equivalents which records a positive figure of 90 and 6 pounds respectively. b) Cash flow statements give information concerning the inflows and outflows of the cash for a given stakeholders in a given period of the year. They are important because of the following reasons. For a car manufacturing company, a cash flow statement will help to clearly identify various sources from which the company can generate cash inflows and where they have risen from for a given particular period of time. It will also determine the processes that have utilized this cash and why it was important to use the cash on these processes. The cash flow is very important to the management, planning and maintaining matches between the cash outflows and inflows of the company. In general, the cash flow statement will go a long way in showing the efficiency of the car manufacturing company in generating cash inflows from operations in which it undertakes regularly. For a milk processing company, cash flow statements frequently report the cash amounts that are used in a given period of time and the long terms investment activities that they undertake, for example, purchase of fixed assets. The cash flow statement will also help the milk plants to report the cash amounts that are received in a given period of time through different financial activities like raising long-term loans, debentures and issuing of shares. Cash flows will also go a long way in ensuring the appraisal of different capital investment schedules which will determine their viability and profitability. Question 4 a) Break Even Points 1st Budget 2nd Budget b) Percentage Change in Profit c) Forecasting and budgeting are very crucial aspects for a business to survive and grow in the dynamic business environment. From the two budgets above, the first budget is ideal and suitable for the firm. This is because it has a less number of units that need to be sold to attain a break-even point. From its analysis, it is based on several assumptions concerning the conditions of the external market and its internal performance. The first budget wills helps a company controls its cash flows and realizes its expense after a short period. d) There are five important methods that are often used to evaluate whether a project is feasible or not. These methods are simple rate of return (SRR), Benefit cost ratio (BCR), Payback period (PBP), internal rate of return (IRR) and Net present value (NPV) which is also known as Net present worth (NPW). The simple rate return and the payback period are the undiscounted measures while the other three are the discounted forms of measures for a project that is worth investing in. These methods are calculated by using figures approximated for a project and when a given threshold is reached for a given project, the project becomes suited for investing. If these thresholds are not reached, the project is discarded. Question 5 i. Marginal cost Profit=TR-TC TR=PQ Price= ((10-5) + (75000-50000))/1000=25 TR= 25*4000=100000 Profit= 100000-25000=75000 ii. Full cost Profit=TR-TC TR=PQ Price= ((10-5) + (75000-50000) =25005 TR= 25005*4000=100020000 Profit= 100002000-25005=99,999.4995 iii. Marginal cost + Fixed Fee (of fixed costs +10%) Price= 25+25000=25005 TR= 25005*4000= 100020000 Profit= 100020000-25000=99, 9995,000 b) i) Marginal Cost The total Tax for the transfer is 15%+ 25%= 40% Before Tax Profit= 100000-25000=75000 After tax =75000*60% =45000 ii) Fixed Cost The total Tax for the transfer is 15%+ 25%= 40% Before Tax Profit= 100002000-25005=99,999.4995 After tax =99,999.4995* 60% =59999 iii Marginal Cost + Fixed Cost The total Tax for the transfer is 15%+ 25%= 40% Before Tax Profit= 100020000-25000=99, 999.50 After tax =99999.5 * 0.60 =59999.7 b. The tax authorities need to respond to the transfer price that is set by KT-Royal Group by imposing very strict fines, mandatory document, increased exchange of information and conducting intensive audits. Therefore, the tax authorities need to increase obligations for compliance (Rodgers, 2008). Additionally, KT Royal Group needs to keep at per with the developments of Transfer Pricing. References Bragg, S. 2000. Financial analysis. New York: Wiley. Financials.morningstar.com,. 2015a. Growth, Profitability, and Financial Ratios for Sainsbury J PLC SBRY from Morningstar.com. Retrieved 11 January 2015, from http://financials.morningstar.com/ratioss/r.html?t=SBRY®ion=gbr&culture=en-US Financials.morningstar.com,. 2015b. Growth, Profitability, and Financial Ratios for Tesco PLC ADR TSCDY from Morningstar.com. Retrieved 11 January 2015, from http://financials.morningstar.com/ratios/r.html?t=TSCDY Gibson, C., & Frishkoff, P. 2009. Financial statement analysis. Boston: CBI Pub. Co. Markets.ft.com,. 2015. Tesco PLC, TSCO:LSE financials - FT.com. Retrieved 11 January 2015, from http://markets.ft.com/research/Markets/Tearsheets/Financials?s=TSCO:LSE Muro, V. 2008. Handbook of financial analysis for corporate managers. New York: AMACOM. Palepu, K., Healy, P., & Bernard, V. 2000. Business analysis & valuation. Cincinnati, Ohio: South-Western College Pub. Robinson, T. 2009. International financial statement analysis. Hoboken, N.J.: John Wiley & Sons. Rodgers, P. 2008. Financial analysis. Oxford: CIMA. Read More
Cite this document
  • APA
  • MLA
  • CHICAGO
(Mock Test Coursework Example | Topics and Well Written Essays - 2000 words, n.d.)
Mock Test Coursework Example | Topics and Well Written Essays - 2000 words. https://studentshare.org/finance-accounting/1855968-mock-test
(Mock Test Coursework Example | Topics and Well Written Essays - 2000 Words)
Mock Test Coursework Example | Topics and Well Written Essays - 2000 Words. https://studentshare.org/finance-accounting/1855968-mock-test.
“Mock Test Coursework Example | Topics and Well Written Essays - 2000 Words”. https://studentshare.org/finance-accounting/1855968-mock-test.
  • Cited: 0 times

CHECK THESE SAMPLES OF Financial Performance, Profit Margin, and Gross Profit Margin of Sainsbury and Tesco

Emirates Airlines Cabin Crew Strategic Development System for Effective Staff Motivational Management

INTRODUCTION Business are changing with every passing day and businesses that show the flexibility to adapt these changes maintain the survival while businesses that show rigidness against this changing environment are vanished despite their level of strong business muscles.... ... ... ... This claim can be clearly witness from the changes in aviation industry that has constantly been adapting to the changing dynamics of business that is related to it or not....
40 Pages (10000 words) Essay

Tips to Do Good in Examinations

Additionally, preparing a Mock Test for each other may help.... Fourth, test oneself.... When reviewing, students should test themselves if they are retaining what they read.... Questioning each other will test mastery of what was studied individually....
3 Pages (750 words) Essay

Nursing Roles in a Diverse Culture

The author of the paper "Nursing Roles in a Diverse Culture" is of the view that culture is a set of beliefs and values that mold a person's behavior.... It is highly related to individualism.... A profession like nursing demands interaction with people from different cultures and traditions.... ...
5 Pages (1250 words) Essay

ANOVA Statistics in Psychology

In order to do so, it is possible to choose two or three mnemonic devices and ask different groups of students to use one device each while studying for a Mock Test.... For this study, the type of mnemonic device used would be the independent variable and the scores (performance) on the Mock Test would be the dependent variable.... What are the differences between a two sample t-test and ANOVA hypothesis testing?... While a two sample t-test attempts to verify if the difference seen in the means of two groups is significant, Drill Questions: Statistics Part In ANOVA, what does F mean?...
2 Pages (500 words) Essay

Training and Assessment

The other way of evaluating is through the Mock Test, where peers are acting as customers and the learning participant has to resolve the problems that each one comes up with.... The assignment "Training and Assessment" focuses on the aspects of various areas of training.... The set questions help the instructor to determine the learning taken place in the participants in terms of knowledge and skill acquisition, problem-solving ability, application in real-life situations, and creativity....
6 Pages (1500 words) Assignment

The City To Surf Fun Run

The paper gives detailed information that City to Surf Fun and Run is an annual road running event held in Sydney, Australia.... It was first initiated in the year 1971 by The Sun newspaper with inspiration from Bay to Breakers event in San Francisco.... ... ... ... This paper tells that the run is scheduled on second Sunday of every August (City 2 Surf a)....
11 Pages (2750 words) Case Study

Celebrities Endorsement to a Brand Promotion

The current project "Celebrities' Endorsement to a Brand Promotion?... primarily aims at discussing to what extent the potential masses are influenced by celebrities, how they stimulate their purchasing decision and how media is used for the celebrity endorsement.... ... ... ... Celebrity endorsement is a communication channel in which a celebrity acts as a spokesperson of the brand....
33 Pages (8250 words) Dissertation

McRobbies and Friths Cock Rock and Teenybop in Rock Music

The paper "McRobbies' and Frith's Cock Rock and Teenybop in Rock Music" tells us about development popular rock music.... it was in the 1950s.... Rock is perceived to be the basis of social and moral degradation according to many.... While others considered this as creativity, other claim it was the beginning of the demise the virtual walls that hold in moral uprightness and standards....
6 Pages (1500 words) Essay
sponsored ads
We use cookies to create the best experience for you. Keep on browsing if you are OK with that, or find out how to manage cookies.
Contact Us