StudentShare
Contact Us
Sign In / Sign Up for FREE
Search
Go to advanced search...
Free

Interpretation of Financial Statements: Next Plc and Ted Baker Plc - Case Study Example

Cite this document
Summary
The "Interpretation of Financial Statements: Next Plc and Ted Baker Plc" paper contains the financial statements which provide important financial information about business operations. With the help of this information, one can compute financial ratios relating to liquidity, profitability, gearing. …
Download full paper File format: .doc, available for editing
GRAB THE BEST PAPER96.1% of users find it useful
Interpretation of Financial Statements: Next Plc and Ted Baker Plc
Read Text Preview

Extract of sample "Interpretation of Financial Statements: Next Plc and Ted Baker Plc"

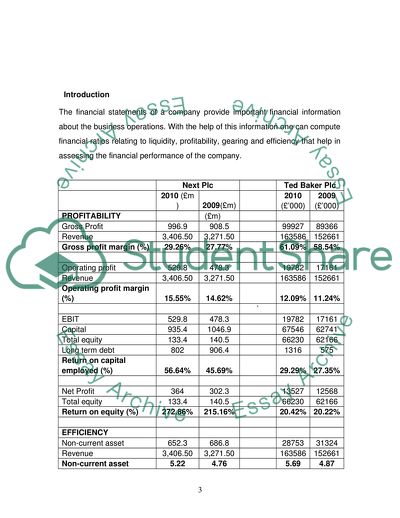
Interpretation of Financial ments Table of Contents Interpretation of Financial ments Table of Contents 2 Introduction 3 Financial analysis of Next Plc (NXT) & Ted Baker Plc (TED) 5 Recommendation 9 Reference 10 Bibliography 12 Introduction The financial statements of a company provide important financial information about the business operations. With the help of this information one can compute financial ratios relating to liquidity, profitability, gearing and efficiency that help in assessing the financial performance of the company.   Next Plc   Ted Baker Plc   2010 (£m) 2009(£m)   2010 (£’000) 2009 (£’000) PROFITABILITY  (£m)       Gross Profit 996.9 908.5   99927 89366 Revenue 3,406.50 3,271.50   163586 152661 Gross profit margin (%) 29.26% 27.77%   61.09% 58.54%             Operating profit 529.8 478.3   19782 17161 Revenue 3,406.50 3,271.50   163586 152661 Operating profit margin (%) 15.55% 14.62%   12.09% 11.24%       `     EBIT 529.8 478.3   19782 17161 Capital 935.4 1046.9   67546 62741 Total equity 133.4 140.5   66230 62166 Long term debt 802 906.4   1316 575 Return on capital employed (%) 56.64% 45.69%   29.29% 27.35%             Net Profit 364 302.3   13527 12568 Total equity 133.4 140.5   66230 62166 Return on equity (%) 272.86% 215.16%   20.42% 20.22%             EFFICIENCY           Non-current asset 652.3 686.8   28753 31324 Revenue 3,406.50 3,271.50   163586 152661 Non-current asset turnover 5.22 4.76   5.69 4.87             Inventory 309 318.7   33450 37315 Cost of sales 2,409.60 2,363.00   63659 63295 Inventory turnover 7.80 7.41   1.90 1.70             Revenue 3406.5 3271.5   163586 152661 Accounts Receivable 616.6 622.7   19698 20466 Trade receivables collection period 66.07 69.47   43.95 48.93             Cost of sales 2409.6 2363   63659 63295 Trade payables payment period 550.3 490.5   24779 29806 Trade payables payment period 83.36 75.76   142.07 171.88             LIQUIDITY           Current Assets 1,041.20 1,073.60   67387 65024 Current Liabilities 758.1 713.5   28594 33607 Current Ratio 1.37 1.50   2.36 1.93             Quick Assets 732.20 754.90   33937 27709 Quick Liabilities 753.4 667.2   28594 33607 Acid-test ratio 0.97 1.13   1.19 0.82             Cash and short term deposits 107 47.8   13698 4660 Current Liabilities 758.1 713.5   28594 33607 Cash ratio 0.14 0.07   0.48 0.14             GEARING           Total equity 133.4 140.5   66230 62166 Long term debt 802 906.4   1316 575 Long-term debt to equity 6.01 6.45   0.02 0.01             EBIT 529.8 478.3   19782 17161 Interest expense 25.3 50.8   374 307 Interest cover 20.94 9.42   52.89 55.90             INVESTMENT           Price 2,053.00 1,177.00   652.5 25.8 EPS 188.50 156.00   32.6 29.6 P/E ratio 10.89 7.54   20.02 0.87             DPS 66 55   16.65 17.15 EPS 188.5 156   32.6 29.6 Dividend payout 0.35 0.35   0.51 0.58             EPS 188.5 156   32.6 29.6 DPS 66 55   16.65 17.15 Dividend cover 2.86 2.84   1.96 1.73             DPS 66 55   16.65 17.15 Price 2,053.00 1,177.00   652.5 25.8 Dividend yield 3.21% 4.67%   2.55% 66.47% (Next Plc, 2010; Ted Baker, 2010). Financial analysis of Next Plc (NXT) & Ted Baker Plc (TED) Profitability- For the financial year 2010 the gross profit margin of both the companies has increased as compared to the last year. Ted Baker reported a gross profit margin of 58% in 2009 and this increased to 61% in the following year whereas Next Plc reported a margin of 27% in 2009 and it increased to 29% in the immediate year. The gross profit margin of the former is more than double that of latter; this implies that the management of Ted Baker has exercised efficient control over the operating costs. However the operating profit margin of Next Plc is marginally higher than Ted Baker Plc. For 2010 the former reported an operating profit margin of 15% as compared to12% by Ted Baker Plc. This suggests that the management of Next Plc has succeeded in controlling the administrative expenses thereby pushing up this margin. The investors are more interested on the return that the company is able to generate for its investors. Based on this parameter Next Plc has outperformed Ted Baker Plc as ROCE reported by Next is 56% and this has improved over the last year’s percentage of 45%. This is nearly twice the ROCE of 29% reported by Ted Baker Plc. From this it can be inferred that the earnings generated by Next Plc is sufficient for paying off the debt and equity holders. In terms of ROE also Next Plc has beaten Ted Baker with the former reporting a ROE of 272% for 2010 as compared to 20% by Ted Baker. This is mainly because the equity base of Next Plc is quite low. Efficiency- The non-current asset turnover ratio of Ted Baker for 2010 is 5.69. This has improved over the last year figure of 4.87. Next Plc reported this ratio at 5.22 for 2010. Both the companies have reduced their investment in the non-current assets in 2010. Despite this the revenue of the company has moved up over the last year. This is a good sign as it implies that the company management is utilizing the asset base efficiently (Walker, 2008, p.186). The inventory turnover ratio of Ted Baker Plc is 1.90. This has improved, albeit marginally, from 1.70 in the previous year. Compared to it this ratio is significantly high for Next Plc. In 2010 Next Plc reported an inventory turnover ratio of 7.80. A high ratio suggests that the company is able to convert its inventories into sales quite fast resulting in low levels of unsold stock. A low ratio in the case of Ted Baker suggests that the company has high levels of unsold stock. This is not good as it implies that a significant amount of company’s funds remains tied up in the form of inventory (Posthumus, et al., 2000. p.10). Trade Receivables collection period represents the time taken by the company in realising money from credit sales. A long period is not favourable as it implies poor customer selection resulting in late payments. This impacts the interest outflow of the company (Investopedia-b, 2010). The collection period for Next Plc is 66 days for 2010, marking a slight improvement from the previous year. Ted Baker Plc has a lesser collection period at 43 days suggesting good customer selection and quick pay-off of loans. Similarly the trade payable period gives an indication of the time taken by the company in paying off its creditors. Next Plc reported a payable period of 83 days as compared to 142 days by Ted Baker Plc. This means that the former is able to clear its dues in a lesser time frame. It is a good sign as this improves the market image of the company. Buoyed by the fast payment track record the investors may be attracted to lend the company at lower rates. Liquidity- Current ratio and quick ratio are important indicators of the liquidity strength of the company. Ted Baker reported a current ratio of 2.36 whereas for Next Plc this ratio is less than two at 1.37. This indicates that the former is better placed in taking care of the short term obligations. The Quick ratio of Ted Baker is also high at 1.19 as compared to 0.97 of Next Plc. Both these ratios are important indicators of liquidity strength but when it comes to measuring the ability of the company to meet its immediate liabilities then the cash ratio serves as an important measurement tool. A cash ratio of 1:1 is an ideal measure of liquidity (Bragg, 2007, p.91). However the cash ratio of both the companies is less than this benchmark. Ted Baker reported a cash ratio of 0.48 which is more than thrice the cash ratio of 0.14 reported by Next Plc. Therefore in terms of liquidity strength the former is far ahead of Next Plc. Gearing- The gearing position of a company indicates the composition of debt and equity in the capital base. Generally, the companies’ desire for high levels of gearing as the cost of debt is cheap as compared to raising equity. Moreover, the issue of debt also entitles the company to interest tax shields. The long term debt equity ratio of Ted Baker Plc is 0.02 for 2010. This is roughly a fraction when compared with Next Plc. The latter reported a debt-equity ratio of 6.45 in 2009. In 2010 this ratio has been reported as 6.01. From the above ratios it is clear that the leverage position of Next Plc is very high. The company relies more on debt for funding is operations. This has helped the company in the form of high ROE on account of low equity base and higher tax shields. But high levels of debt exposure can be detrimental to the financial health of the company. Contrary to Next Plc, Ted Baker has an insignificant level of debt in the capital mix as the company relies more on equity. Excessive reliance on equity is also not very favourable as a large number of outstanding shares dilute the earnings of the company. This has been true in the case of Ted Baker as well as evident from the ROE and low EPS position. Though the companies prefer to use more of debt in the capital base it is important to measure to what extent the earnings of the company can meet its interest obligations. This can be done by computing the interest coverage ratio. For Ted Baker this ratio is significantly high at 52 and 55 for 2010 and 2009 respectively and for Next Plc this is 20 and 9.42 for 2010 and 2009 respectively. Next Plc has managed to improve its interest paying potential over the last year as evident from the rise in its interest cover (Pietersz-b, 2005-2010). Investment- Price-earning ratio (P/E) indicates the amount that the investor is willing to pay for each pound of earnings generated by the company. A high P/E ratio implies that the investors are confident about the future growth prospects of the company and vice-versa. This ratio is high for Ted Baker with the company reporting a P/E ratio of 20.02 in 2010. P/E ratio of Next Plc is nearly half of that of Ted Baker at 10.89. This suggests that the investors are more confident about the performance of Ted Baker Plc. This has prompted them to shell out more amounts of pounds to purchase a share of the company thereby, raising its P/E ratio (London Stock Exchange plc. 2011; Reuters, 2011). . The dividend payout ratio of a company shows how much of the company earnings are being distributed among the shareholders. Ted Baker reported this ratio at 0.51 in 2010. This means that the company is distributing more than fifty percent of its earnings among its shareholders. Previously, this ratio was higher at 0.58. Next Plc has consistently maintained a dividend payout ratio of 0.35 in both the years under consideration. This means that the company is retaining more amounts of business earnings in the form of ‘retained earnings’. Dividend cover implies to what extent EPS of the company is capable of sustaining the dividend payments. A high cover implies that the company can maintain the same level of dividends even when there is a fall in the profits (Pietersz-a, 2005-2010). Next Plc reported a dividend cover of 2.86 in 2010 as compared to 1.96 by Ted Baker Plc. This implies that even in times of falling profits the company may not immediately reduce the dividend payments i.e. the DPS of the company will remain intact even in times of falling profits. For Ted Baker Plc this is marginally less at 1.96 mainly on account of low EPS. Dividend yield measures how much return an investor gets in the form of dividend receipts based on the amount invested in the company’s equity (Investopedia-a, 2010). The dividend yield of Next Plc is 3.21% as compared to 2.55% of Ted Baker Plc. This shows that an investor will get higher dividend returns if he or she invests in Next Plc. In other words the investors will be lured towards Next Plc as the company will offer high cash flows per pound of investment made in the company. Recommendation The financial analysis of the company shows that investing in both the companies has its own set of pros and cons. While the return generated by Next Plc is much higher as compared to Ted Baker Plc, the liquidity strength of the latter is much stronger as compared to the former. Similarly, the leverage position of Next Plc is very high which can expose it to financial hazards, on the other hand, the capital mix of Ted Baker Plc has limited debt component but the high equity base has diluted the earnings of the company. So it can be said that investing in both the companies has its own set of advantages as well as limitations. However when considered in terms of ‘risk’ investment in Ted Baker Plc is comparatively less risky. Its returns may not be as high as Next Plc but the company has generated positive ROE over the last two years and also has a higher dividend payout ratio. Therefore considering the risk-averse nature of Reiner, investment in Ted Baker Plc is recommended. The company has a good market reputation and the low levels of debt and high liquidity will ensure that the company never faces any problem in generating funds for expansion. Reference Bragg, M.S. 2007. Business ratios and formulas: a comprehensive guide. John Wiley and Sons. Investopedia-a. 2010. Dividend Yield. Available at: http://www.investopedia.com/terms/d/dividendyield.asp [Accessed on January 13, 2011]. Investopedia-b. 2010. Average Collection Period. Available at: http://www.investopedia.com/terms/a/average_collection_period.asp [Accessed on January 13, 2011]. London Stock Exchange plc. 2011. Summary. NEXT PLC. Available at: http://www.londonstockexchange.com/exchange/prices-and-markets/stocks/summary/company-summary.html?fourWayKey=GB0032089863GBGBXSET1 [Accessed on January 13, 2011]. Next Plc. 2010. Annual Report and Accounts. Available at: http://www.nextplc.co.uk/nextplc/financialinfo/reportsresults/2009/jan10/jan10-c.pdf [Accessed on January 13, 2011]. Pietersz, G-a. 2005-2010. Dividend cover. Moneyterms.co.uk. Available at: http://moneyterms.co.uk/dividend_cover/ [Accessed on January 13, 2011]. Pietersz-G-b. 2005-2010. Interest cover. Moneyterms.co.uk. Available at: http://moneyterms.co.uk/interest_cover/ [Accessed on January 13, 2011]. Posthumus, C.L. Basson, N. Olivier, P. 2000. Principles of Financial Management. Juta and Company Ltd. Reuters. 2011. Financials. Ted Baker PLC. Available at: http://in.reuters.com/finance/stocks/financialHighlights?symbol=TED.L [Accessed on January 13, 2011]. Ted Baker. 2010. Report and Accounts. Available at: http://ww7.investorrelations.co.uk/tedbaker/uploads/annual_reports/ReportandAccounts09_10Final.pdf [Accessed on January 13, 2011]. Walker, J. 2008. Accounting in a Nutshell: Accounting for the Non-Specialist. Butterworth-Heinemann. Bibliography Biz/ed. No Date. Return on Capital Employed Ratio. Company Info. Available at: http://www.bized.co.uk/compfact/ratios/ror3.htm Hall, I. Jones, R. Raffo, C. 2007. Business Studies. Pearson Education. Investopedia. 2011. Interest Coverage Ratio. Available at: http://www.investopedia.com/terms/i/interestcoverageratio.asp Yahoo Finance-a. 2011. Historical Prices. TED BAKER. Available at: http://in.finance.yahoo.com/q/hp?s=TED.L&a=00&b=26&c=2009&d=00&e=31&f=2009&g=d Yahoo Finance-b. 2011. Historical Prices. Next PLC. Available at: http://in.finance.yahoo.com/q/hp?s=NXT.L&a=00&b=24&c=2009&d=00&e=31&f=2009&g=d Read More
Cite this document
  • APA
  • MLA
  • CHICAGO
(Interpretation of Financial Statements: Next Plc and Ted Baker Plc Case Study - 1, n.d.)
Interpretation of Financial Statements: Next Plc and Ted Baker Plc Case Study - 1. https://studentshare.org/finance-accounting/1747985-interpretation-of-financial-statements
(Interpretation of Financial Statements: Next Plc and Ted Baker Plc Case Study - 1)
Interpretation of Financial Statements: Next Plc and Ted Baker Plc Case Study - 1. https://studentshare.org/finance-accounting/1747985-interpretation-of-financial-statements.
“Interpretation of Financial Statements: Next Plc and Ted Baker Plc Case Study - 1”. https://studentshare.org/finance-accounting/1747985-interpretation-of-financial-statements.
  • Cited: 0 times

CHECK THESE SAMPLES OF Interpretation of Financial Statements: Next Plc and Ted Baker Plc

The Impact of Third Party Logistic on the Supply Chain Process in The Case Of Tesco Plc

The unique approach, with which the companies adopt the distribution and supply management currently, has been the guarantor of its success.... According to Chopra and Meindl, companies in any sector, whether it is retailing or manufacturing adopt the modern and sophisticated methods of operation (2003)....
68 Pages (17000 words) Essay

A contextualised analysis of MORRISON (WM) SUPERMARKETS PLC

hellip; A contextualised analysis of Morrison (WM) Supermarkets plc Overview of the Company ... Morrison WM Supermarkets plc, a publicly traded company, is a supermarket chain which offers a wide range of goods including branded ones and its own labelled products.... Morrison WM Supermarkets plc was founded in 1899 by William Morrison.... Morrison WM Supermarkets plc was founded in 1899 by William Morrison....
17 Pages (4250 words) Coursework

Interpretation of Financial Statements

This essay “Interpreting Financial Statements” focuses on financial analysis of the bottom of the examples of next plc and ted baker plc.... However, the operating profit margin of Next Plc is marginally higher than ted baker plc.... For 2010 the former reported an operating profit margin of 15% as compared to12% by ted baker plc.... Based on this parameter Next Plc has outperformed ted baker plc as ROCE reported by Next is 56% and this has improved over the last year's percentage of 45%....
8 Pages (2000 words) Essay

Roehampton University and Renishaw plc: Accounting for Organisations

Another factor is the government intervention since the university is registered under the trust the rules and regulation may change over the period of time as mentioned the financial statements are produced according to the guidance of the Charity Commission.... Renishaw's performance has been evaluated with the help of key ratios and other information provided in the financial statements, while the Roehampton University is a non-profit organization the purpose of whose operations is not the generation of the profit, but it exists for the benefit of the masses....
8 Pages (2000 words) Essay

Mergers and Acquisitions

The study will analyse the financial statements of randomly selected companies before and after merger so as to reveal the true impact from such merger or acquisition.... Consequences of M&A 45 Chapter 6: Conclusion 46 Chapter 7: Recommendations 48 References 53 Appendices 57 Table 1 – financial statements of Lehman Brothers Holdings Inc.... (Before Merger) 57 Table 2 – financial statements of Barclays Plc (Before Merger) 58 Table 3 – financial statements after Merger and Acquisition 59 Chapter 1: Introduction In today's world the primary objective of a firm is to survive the cut-throat competition and one way to do that is to make more profits and add value to shareholders' wealth....
38 Pages (9500 words) Dissertation

The Investment Banking Industry

For example, if a USA based company wishes to sell its shares in a European stock exchange such as the London Stock Exchange the company does not have to prepare a set of financial statements based on IFRS standards to qualify to sell shares in the European stock market.... The paper 'The Investment Banking Industry' presents the financial statements of a company which are essential tools used by investment bankers in the decision-making process.... This proposal studies the effect of the different financial frameworks on the information contained within the financial statements....
39 Pages (9750 words) Term Paper

Persuasive Communication class - online discussion

These two genre of music has been widely misinterpreted and given a negative connotation by those who do not appreciate the culture that is… Rap and hip hop music are often associated with the Black people who are their major promoters and patronizers.... Most of the people who abhor these types of music are those who are still engulfed by racial discrimination, yet refuse to accept it....
2 Pages (500 words) Personal Statement

Vision and Mission of Julphar Pharmaceuticals

he objective of IAS 1 is to provide the organizations with the basis for presentation of general-purpose financial statements.... It is to ensure the comparability of the financial statements of the previous periods and the financial statements of the other entities.... IAS 1 is applicable to general-purpose financial statements that are prepared in accordance with the international Financial Reporting Standards.... eneral-purpose financial statements are prepared in order to provide information about the financial performance, financial position and cash flow of the entity that is useful to a wide range of users for the purpose of making economic decisions (IAS 1, 2015)....
8 Pages (2000 words) Essay
sponsored ads
We use cookies to create the best experience for you. Keep on browsing if you are OK with that, or find out how to manage cookies.
Contact Us