StudentShare
Contact Us
Sign In / Sign Up for FREE
Search
Go to advanced search...
Free

A contextualised analysis of MORRISON (WM) SUPERMARKETS PLC - Coursework Example

Cite this document
Summary
he food retailing market in the United Kingdom is very competitive. Food retailers have expanded their business activities in many ways. The total grocery market has grown from £93.3 billion in 1998 to £146.3 billion in 2008…
Download full paper File format: .doc, available for editing
GRAB THE BEST PAPER95.3% of users find it useful
A contextualised analysis of MORRISON (WM) SUPERMARKETS PLC
Read Text Preview

Extract of sample "A contextualised analysis of MORRISON (WM) SUPERMARKETS PLC"

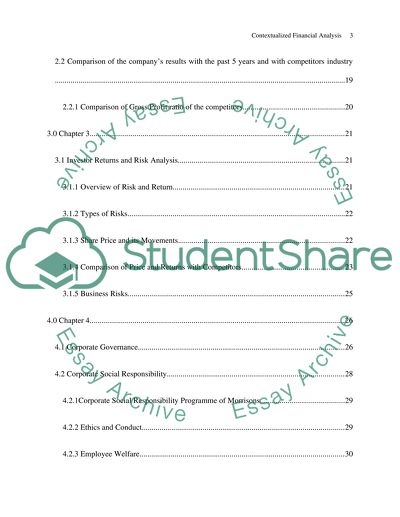
? A contextualised analysis of Morrison (WM) Supermarkets PLC Table of Contents A contextualised analysis of Morrison (WM) Supermarkets PLC Table of Contents 2 1.0 Chapter 1 5 1.1 Overview of the Company 5 2.0 Chapter 2 8 2.1 Financial Analysis 8 2.1.1 Financial Statement Analysis 8 2.1.2 Ratio Analysis 9 2.1.3 Profitability Ratios 10 2.1.4 Liquidity Ratios 12 2.1.5 Efficiency Ratios 14 2.1.6 Solvency Ratios 15 2.1.7 Conclusions 17 2.2 Comparison of the company’s results with the past 5 years and with competitors industry 17 2.2.1 Comparison of Gross Profit ratio of the competitors 19 3.0 Chapter 3 20 3.1 Investor Returns and Risk Analysis 20 3.1.1 Overview of Risk and Return 20 3.1.2 Types of Risks 21 3.1.3 Share Price and its Movements 21 3.1.4 Comparison of Price and Returns with Competitors 22 3.1.5 Business Risks 23 4.0 Chapter 4 25 4.1 Corporate Governance 25 4.2 Corporate Social Responsibility 27 4.2.1Corporate Social Responsibility Programme of Morrisons 27 4.2.2 Ethics and Conduct 28 4.2.3 Employee Welfare 28 4.2.4 Farming 28 4.2.5 Raw Material Sourcing 28 4.2.6 Animal Welfare 29 4.2.7 Fair Working Conditions 29 4.2.8 Food Waste Prevention Programmes 29 4.2.9 Recycling and charging for bags 29 4.2.10 Reducing Operational Carbon Emissions 30 4.2.11 Supporting Local Communities 30 5.0 Chapter 5 30 5.1 Future Prospects 30 5.1.1 Liquidity 31 5.1.2 Efficiency Ratios 31 5.1.3 Solvency 31 5.1.4 Market Performance 31 Works Cited 32 Appendix -1 34 Appendix-2 37 42 1.0 Chapter 1 1.1 Overview of the Company The food retailing market in the United Kingdom is very competitive (Competition Commission, 2000). Food retailers have expanded their business activities in many ways. The total grocery market has grown from ?93.3 billion in 1998 to ?146.3 billion in 2008. In the United Kingdom there are a total of 92,796 grocery stores which are broadly classified into the following four categories namely Convenience stores, Traditional retail, Hypermarkets, Supermarkets and Superstore and Online Channel. Among these, hypermarkets, supermarkets and superstores are the largest in the UK (Li, 2008). Morrison WM Supermarkets PLC, a publicly traded company, is a supermarket chain which offers a wide range of goods including branded ones and its own labelled products. They are the fourth largest food retailer in the United Kingdom by sales with 439 stores across Britain and an annual turnover of ?16 billion. The main speciality of this chain of supermarkets is its high quality fresh food at great prices. Morrison WM Supermarkets PLC was founded in 1899 by William Morrison. The company has developed from a single egg and butter stall in Bradford and has turned into one of the best food retailers in the United Kingdom. Starting from a small stall in Bradford in 1899, a new produce depot was opened in 1976. The company took over Whelan Discount Stores and started operating in Lancashire for the first time in 1978. The first Morrisons distribution centre was opened in 1988 followed by the opening of second distribution centre in 1997. It was in February 2004 the company went national by opening a store in Scotland. Morrisons became the fourth largest retailer in the UK in March 2006 by opening UK’s first BioEthanol E85 filling pumps. The company has 700 tractors and 1700 trailers distributing to the stores across the country and it is now the largest supplier of apprenticeships in the United Kingdom. The following are deemed to be the four important reasons why they occupy a unique position in the grocery market: 1. Quality: They ensure control quality by owning their own production facilities. 2. Insight: They know what they are buying and where it comes from. 3. Value: They buy direct and pass savings on to the customer. 4. Flexibility: They get their food in store faster and react to the market more quickly. (Morrisons, 2011a) The company’s overall turnover is 17,663, 000 GBP, net income is 690,000 GBP, total assets is worth 9,859,000 GBP and the number of employees is 131,207, number of recorded shareholders is 86 and the number of recorded subsidiaries is 79. There are other leading companies in the same industry namely Asda Stores Limited, J. Sainsbury PLC and Tesco PLC. The company has a number of subsidiaries such as Farmers Boy Limited, Holsa Limited, Neerock Limited, Lifestyle Wholesale Distribution Limited, Kiddicare Properties Limited, WM Morrison produce Limited etc. The major activities of these subsidiaries are manufacturing and the distribution of fresh food products, insurance services, polythene bag manufacturing, produce packaging, fresh meat processing and market trading. (Fame) The company deals in a variety of food categories such as grocery, fresh, beers, wines and spirits, market street, frozen, health and beauty, household and baby. Under the category of Market Street, there are other sub categories namely Cafe, Family Butcher, Fishmonger, Greengrocer, The Bakery and The Cake Shop. (Morrisons, 2011a) In Market Street, the company offers a convenient shopping with the skills and experience so that customers get fresh food the way they like it. The company employs highly skilled and experienced people in the supermarket. Customers are given intense help regarding any recipe ideas, advices on what’s in season and so on. Since they are capable of responding quickly to the changes in demand, they can eliminate unnecessary waste. The company bakes its own bread in-store every day so even when they run out of stock; they can bake whenever they want. It has also proved its excellence in the field of petrol and has petrol stations which include Morrisons Miles Card and Business Fuel Card. Morrisons have become famous for the fresh food they provide. Today they have a total of 439 stores nationally having 56 stores in Scotland, 85 stores in the North, 85 stores in the Midlands, 75 stores in the South East, 73 stores in the South Central and 65 stores in the South West. One of the main competitors of the company is Tesco Stores Limited, an international grocery retail chain which was founded in 1919 by Jack Cohen and this is the largest retailer in the United Kingdom. Their main products include foods, fruits, vegetables, beverages, family fashion, textile goods, electrical household goods, furniture, sports equipment, garden furniture, CDs and books. The major reason for the success of the company is its quick response to the changing environment (Li, 2008). Its turnover now is 40,149,000 GBP with a net income of 1,756,000 GBP and 261,313 employees (Fame). Asda Stores Limited, another major competitor of Morrisons Supermarkets PLC, have a turnover of 21,661,000 GBP with a net income of 368,000 GBP and 176,453 employees which make them to be the second largest supermarket chain in the United Kingdom. J Sainsbury PLC, another sturdy competitor of Morrisons was founded in the year 1869 and is the third largest supermarket chain in the United Kingdom. This chain has a turnover of 22,294,000 GBP with a net income of 598,000 GBP and 101,900 employees. All the 3 grocery chains had their own marketing strategies which enabled them to be successful in being at the top of the supermarket chains. Likewise, Morrisons also have and had its own specialities which helped them to be one of the largest retailers among the top four in all respects. Morrisons accomplished this through the acquisition of Lancashire based supermarket Whelans in 1978 and Safeway in March 2004. Unlike the competitors Sainsbury and Tesco, the company does not have loyalty card offer, instead of which they offer discount prices. Competition among the four grocery giants is very intense and it can be fairly understood from the following statistics. The market share of the four companies in 2004 was as follows: Tesco: 28.3% ASDA: 16.7% Sainsbury: 15.5% Morrison/Safeway: 13.2% Total: 73.7% The remaining 26.3% was shared by other smaller players in the industry. The total market in 2004 was 119.8 billion GBP. The percentage share of the four major companies can be seen from Figure-1. Figure-1 Market Share of the Four Major Players in the Retail Industry. Source: Observer December 05, 2004 (J. Sainsbury plc and the UK food retail industry). Figure-2 From the above graph it is clearly understood that UK grocery market size has steadily boosted but there are variations in the market growth. That is, there is an increase of 3.3% of retail market size in the years 1998-1999 but a slight decline in the growth of the market. The maximum growth is achieved in the years 2000-2001 as it is seen in the above graph. Hence, the conclusion is just because there is an increase in the market size every year does not mean that there is actually growth taking place. There are many factors which have to be taken into consideration when the growth is measured or analysed. That can be the factors like increase/ decrease in demand and supply, international transactions, deflation etc. 2.0 Chapter 2 2.1 Financial Analysis 2.1.1 Financial Statement Analysis Financial statement analysis is concerned with the interpretation of the results reported in published financial statements of a company with a view to both forecasting future trends and assessing the past performance. Such analysis provides the necessary information to various stakeholders including investors, creditors, and employees to understand the organization from their points of view, and make decisions. Financial analysis and interpretation relies on projecting the trends over time, comparison with various indices within the organization being assessed, and comparison with the performance of other similar organizations. Such analysis depends on a number of parameters and approaches, including the report of the auditors, accounting policies employed and revised, and ratio analysis. Ratio analysis is an important part of such analysis. 2.1.2 Ratio Analysis A ratio is a mathematical relation between one quantity and another (Pamela Peterson Drake). Financial ratios show the relationship between various financial values in such a manner as to highlight the performance of the organization from particular perspectives. The major objectives of ratio analysis are to understand a business much more thoroughly by evaluating its financial statements, to facilitate comparison of business performance for years and most importantly to infer the results of these comparisons. Calculation of small number of ratios helps to build up a good picture of the performance and the position of the company. These are very easy to calculate but difficult to interpret (Mclaney & Atrill, 2010). Ratios can be broadly classified into the following categories: 1. Profitability ratios 2. Liquidity ratios 3. Efficiency ratios 4. Long term solvency ratios Profitability ratios are used to compare the profits and returns that the business generates. Four important ratios used in assessing profitability of an organization are gross profit margin ratio, net profit margin ratio, return on capital employed ratio and return on equity. Liquidity ratios are used to find out the assets that are most readily converted into cash to meet short term obligations of a company and thus indicate short-term financial risk (Financial analysts journal, 1987). Current ratio and acid test ratio are two of the most important ratios used for making assessments of a company’s liquidity position. Efficiency ratios are used to measure how efficiently the assets of the company are used. Some of the measures employed in this type of ratios are inventory days, accounts receivable collection period and accounts payable payment period. These are used to measure the time period for which inventory is held, the average amount of inventory held in relation to other parameters such as sales, the time it takes to collect outstanding dues, and the time it takes to make payments to creditors. Long term solvency ratios are used to determine how well a company can meet its long term obligations. Gearing ratios and interest cover ratio are the two main ratios that come under this category. Ratios are used for many purposes. The most important of these is to abridge difficult financial statements or accounting information to a simple format. As mentioned earlier, ratios are very helpful in comparing the business performance between firms. Comparisons help a company to overcome its shortcomings and make improvements which favourably affect the company in terms of revenue. Ratios are helpful in predicting the future and the financial failure of a business. Financial failure means a business which is adversely affected by its inability to meet its financial obligations. Everything in this universe has its own advantages and limitations. Ratios are no exception and have their own limitations. One important thing which has to be kept in mind is that ratios are calculated based on the financial statements and so the results are dependent on the quality of these financial statements. They help to emphasize the strengths and weaknesses of a business but they cannot elucidate why those strengths and weaknesses exist. Ratios lack standard definitions, there can be misinterpretation of results due to accounting policies and conventions and historic costs do not reveal the actual result. There are no hard and fast rules about the absolute values of the ratios, as these will depend on several factors that might be specific to the industry or region. Ratio analysis can be used to compare trends over periods and values with those of competitors. The following sections analyse the trends under each category of ratios, and presents a comparison with the industry at the end. A number of important ratios have been calculated for Morrisons over the period 2008-2012 using Ms Excel. The results are shown in Appendix-1. The following sections present an analysis of these ratios. 2.1.3 Profitability Ratios Profitability ratios show how effectively the firm is being run and provide an indication of its financial health. Investors are likely to be most interested in these ratios, as they would indicate the type of returns that they are likely to get from their investments. Creditors are also indirectly interested in these ratios, although to a much smaller extent, because good profitability will increase their confidence in the firm and indicate high probability of recovering their dues. Employees should be interested in profitability because, in the short term, their earnings might be related to them, and in the long term, the stability of their jobs might be influenced by the profitability of the firm. All these groups are interested in profitability in relation to some other parameter such as capital employed rather than with the absolute figures of profitability. For this reason, profitability ratios become particularly significant. (Shim & Siegel, 2007, p. 28) Commonly computed profitability ratios are gross profit margin, net profit margin, and return on investments, which has two parts, namely, return on total assets and return on owners’ equity. Gross profit margin shows the percentage of the sales turnover remaining with the firm after it has paid for the goods it has purchased. Net profit margin shows the relationship of the net profit to the sales turnover, and is an indicator of the profit generated per Pound of sales revenue. The return on assets indicates the efficiency with which the firm has employed its assets in generating revenue. Return on equity is the return generated on shareholders’ investment and is of direct interest to equity owners of the company. Gross Profit Margin = Gross profit/ Net sales Net Profit Margin = Net Profit/ Net Sales Return on Assets = Net Profit/ Total Assets Return on Equity = Net Profit/ Stockholders’ equity The profitability ratios of Morrisons for the five year period 2008-2012 are shown in Table-1 and Figure-3. Profitability ratios 2008 2009 2010 2011 2012 Return on Assets 8.24% 6.42% 7.80% 7.89% 8.08% Return on Equity 12.65% 10.18% 12.08% 11.66% 12.78% Gross margin 6.31% 6.28% 6.89% 6.97% 6.89% Net margin 4.27% 3.17% 3.88% 3.84% 3.91% Table-1 Profitability Rations of Morrisons during the period 2008-2012 Figure-3 Profitability Ratio Trends Although returns on equity and assets and net profit margin have shown a dip in 2009, the long term trend is a flat one. This shows that there is no growth in profitability of Morrisons, making it less attractive to investors. The return on equity in absolute terms is much higher than risk-free return and appears adequate to meet the cost of capital. However, its attractiveness can only be assessed in comparison with other firms in the industry. For a new investor, this will have to be compared with the market price. These have been done in a subsequent section. 2.1.4 Liquidity Ratios There are a few key investor ratios which are extremely significant for a company to take into consideration because it helps an investor to fetch information for decision making. One of the main ratios is current ratio which measures the liquidity of the company, or its ability to meet the company’s short term obligations. (The Retail Owners Institute, n.d.). Liquidity ratios are of greatest significance to short-term lenders. (Riahi-Belkaoui, 1998, p. 8) They are also significant to employees so that they can expect to get their salary paid on time. To investors the ratio is important because a good liquidity position helps an organization to get favourable terms and improve its profitability. Two of the most commonly used liquidity ratios are current ratio and quick ratio. In addition, the cash ratio is also calculated to get a better picture of the liquidity position. Current ratio is the ratio of current assets to current liabilities. Current ratio = Current assets/ Current liabilities Quick ratio is the ratio of current assets less inventories to current liabilities Quick ratio = (Current assets – inventories)/Current liabilities Cash ratio is the ratio of cash and cash equivalents, including marketable securities, to current liabilities. Cash ratio = Cash and cash equivalents/Current liabilities. The three ratios for Morrisons Plc for the five year period 2008-2012 are shown in Table-2. Figure-4 shows the trends in graphical form. Liquidity Ratios 2008 2009 2010 2011 2012 Current ratio 0.4906 0.5262 0.5074 0.5455 0.5740 Quick ratio 0.3152 0.2821 0.2393 0.2397 0.2445 Cash ratio 0.0912 0.1616 0.1138 0.1093 0.1046 Table-2 Liquidity ratios of Morrison for the period 2008-2012 Figure-4 Liquidity Ratio Trends Current ratio measures the extent to which current liabilities are covered by current assets, the margin of safety available to protect the reduction in the value of current assets when they are disposed of, and the availability of reserve funds to meet emergency requirements and sudden demand. Quick ratio also performs the same function but without inventories. In other words, it checks the extent to which the company is dependent on its inventories to met current liabilities. Cash ratio measures the extent to which the most liquid current asset – cash- is available for meeting current liabilities. In the case of Morrisons, all three ratios are below 1. In simple terms, here, the current liabilities are higher than the current assets which imply that the company might have problems in meeting their short term obligations. This can affect the business operations and profitability of the company. The Liquidity-Profitability Principle states that there is a trade-off between liquidity and profitability; gaining more of one means giving up some of the other (impact of liquidity journal). Companies with a very low level of current assets will have problems with the business operations in the long run and if the current assets are too much then it implies that the funds are not being efficiently employed, leading to possible reduction in profits and returns on investments an equity (Horne and Wachowicz, 2000). Apart from looking at the absolute values of the liquidity ratios, it is useful and customary to examine the trends. The trends can be seen conveniently from Figure-3. The current ratio shows an increasing trend, while the quick ratio shows a declining trend. The cash ratio has initially increase and then fallen to the original level, and has thereafter maintained a flat trend. The increasing current ratio is an encouraging sign. Although the current ratio is quite low, the increasing trend shows that the management of Morrisons is taking steps to correct the problem, and has been meeting with success. The declining trend in the case of the quick ratio, however, shows that the dependence on inventories is increasing. Apart from industry specific factors, a number of other factors may be responsible for low values of current ratio in absolute terms. One reason for decline in the current ratio may be an equal numeric increase in debt and current assets such as the effect from purchasing inventory. Likewise, an equal decrease would result from an increased current ratio. Hence, current ratio can change hastily within a short period of time (Fleming, 1986). Another possible reason for the decline would be all the current assets and liabilities do not have to be current. That is, almost all the current liabilities are payable within a short period of time, say a month, but it can take months to convert certain current assets to cash. This obviously leads the company to make default in payments or in the case of converting assets into cash. Another problem that Morrisons may be facing now could be overtrading. Overtrading arises when a business is operating at a level of activity that cannot be supported by the level of finance the company has. In that case current ratio will be lower than normally expected. Overtrading results from lack of liquidity. 2.1.5 Efficiency Ratios Efficiency ratios, also known as activity ratios, show the speed with which various current assets are turned over and determine how quickly these assets are converted into cash. These ratios give an idea of the real liquidity of the firm and also impact the profitability. Hence they are important to all stakeholders including creditors and investors. Commonly employed efficiency ratios are Receivable turnover, Inventory turnover, Accounts payable turnover, and Total asset turnover. Receivable turnover = Net credit sales/Accounts Receivable Inventory turnover = Cost of goods sold/Average inventory This ratio is better when it is higher. The ratio varies between 23.5 and 33.25, signifying that an average ?1 invested in stock will turn into 23.5 to 33.25 times in sales. This ratio implies that the company has sound sales and better liquidity. It can also indicate that the company has inadequacy in the level of inventory that may lead to a loss in the business ( ccd consultants, 2010). Accounts payable turnover = Cost of goods sold/Accounts payable Total asset turnover = Net sales/Total assets (Shim & Siegel, 2007, pp. 24-26) The above ratios for Morrisons during the period 2008-2012 are shown in Table-3 and Figure-5. Efficiency/Turnover Ratios 2008 2009 2010 2011 2012 Asset turnover 1.70 1.77 1.76 1.80 1.79 Inventory turnover #REF! 33.25 26.79 25.24 23.54 Debtors turnover 20.92 59.30 76.67 61.49 55.20 Table-3 Efficiency Ratios of Morrisons during the period 2008-2012 Figure-5 Efficiency Ratio Trends 2.1.6 Solvency Ratios Solvency is the ability of the firm to meet its long term financial obligations, including principal and interest payments. Leverage/Capital structure ratios are employed to assess the long-term solvency of the firm. (Riahi-Belkaoui, 1998, p. 10) Three important and commonly used ratios for assessing the solvency of a company are debt-assets ratio, debt-equity ratio and interest coverage. These ratios are of greatest significance to long term lenders and bond holders. Other stakeholders such as investors and employees are also affected by the long term solvency position. (Riahi-Belkaoui, 1998, p. 10) Debt-equity ratio is the ratio of total debt to the total owners’ equity of the organization. Debt-assets ratio is the ratio of total debt to total assets held by the company, and interest coverage is the ratio of profit before interest and taxes to the interest/financial charges that are payable. Debt-equity ratio= Total Liabilities / Total Owner’s equity Debt-assets ratio = Long-term Debt/Total Assets Employed Interest Coverage = EBIT/Interest Charges (Riahi-Belkaoui, 1998, p. 10) Solvency ratios for Morrisons during the period 2008-2012 are shown in Table-4 and Figure-6. Solvency ratios 2008 2009 2010 2011 2012 Debt-Assets ratio 0.4267 0.4505 0.4350 0.4076 0.4526 Debt-Equity ratio 0.3209 0.3721 0.3352 0.3031 0.4000 Interest Coverage #VALUE! 41.94 18.51 30.13 37.42 Table-4 Solvency Ratios of Morrisons during 2008-2012 Figure-6 Solvency Ratio Trends for Morrisons 2008-2012 Debt-equity ratio is a very important measure of solvency, as it is related to the ability to meet interest and principal payments when they fall due. A very high proportion of debt in the capital structure has the potential to result in difficulties of interest payments and repayment of principal amounts when business conditions turn adverse. A high debt content also runs the risk of running out of cash during adverse business conditions. (Shim & Siegel, 2007, p. 27) Though there are problems arising with higher ratio, there are benefits for the company as well. That is, the company can retain control over the business with limited capital investment by having a preference on debts over the equity (efinance mgt). Debt capital is cheaper and increases the overall returns to equity owners when conditions are good. Consequently, a firm is faced with the task of determining the debt content that would optimally serve its interests. A low debt-equity signifies lower long-term risk. However, the most desirable ratio for a firm depends on a number of factors such as access to debt capital, stability of earnings, and the ratios maintained by similar companies in the industry. Debt-assets ratio has similar effects on the solvency and profitability of the firm as the debt-equity ratio. Since this ratio directly compares the available assets for servicing the debt in case of serious problems such as liquidation of the firm, a low debt asset ratio represents greater safety to long-term lenders, and would be preferred by them. (Shim & Siegel, 2007, p. 27) Interest coverage is a safety margin that shows the extent to which the firm can absorb downward pressures on margin without defaulting on interest payments. A high interest coverage ratio is naturally preferable to creditors of the company. (Shim & Siegel, 2007, p. 27) While showing a fluctuating trend over the five year period, the figures show a slight increase in the debt on an overall basis and a slight decrease in interest coverage. Although these figures need not ring alarm bells, the trend is definitely adverse. 2.1.7 Conclusions In short, the company’s current performance based on the latest available published accounts is neither good nor bad. All the ratios have their own merits and limitations. It would be good if the company could focus more on its liquidity by maintaining current amount of assets so that it doesn’t affect the company adversely. The company should also focus in making the debt and equity in a balanced position so that the company can have a steady profit. In terms of inventory the company performs well. The reasons for selecting the above mentioned four ratios are that they are all critical, particularly to the focus group of employees. Liquidity is very important for a company to pay off its creditors and debts. If the liquidity position is bad, then the credibility is lost with the suppliers which adversely affect the company. After liquidity, the financial strength is what matters in a business, because it inspires confidence in investors and creditors and helps the firm to raise fresh capital. It helps the business to retain its position in the market which helps in boosting sales. Activity ratios are important to all stakeholders and show the efficiency with which the company is being run. All these ratios are important to employees. 2.2 Comparison of the company’s results with the past 5 years and with competitors industry The most recent interim results for the half year to 29 July 2012 Source: News Release dated 6th September, 2012, Wm Morrison Supermarkets PLC The company’s performance was unswerving with recent years. The total turnover during this year is 8.9 bn which shows an increase of 2.3% when compared to last year. The underlying profit increased to ?445 m where there is an increase of 1%. The report also states that earnings per share have increased by 10% which in turn increased underlying profit. The company made an operating cash flow of ?833m which is 23% higher than the previous year which shows a good enhancement in working capital of the company. The company’s debt grew this year to ?1680m due to the development of equity retirement programme. Moreover, the company maintains a strong balance sheet which is financed by a number of bonds and credit facilities. During the period the company extended its credit facilities which will be available till 2016. The company increased the funds available to the company in July 2012 and extended the maturity profile of the company’s borrowings through the issue of ?400 m sterling bond to institutional investors which is repayable in 2026. 2.2.1 Comparison of Gross Profit ratio of the competitors 3.0 Chapter 3 3.1 Investor Returns and Risk Analysis 3.1.1 Overview of Risk and Return Return is the basic motivating force and the principal reward in any investment process. Returns may be defined in terms of realized return (that is, the return which has been earned) and expected return (that is, the return which the investor anticipates to earn over some future investment period). The expected return is a predicted or estimated return and may or may not occur. The realized returns in the past allow an investor to estimate cash inflows in terms of dividends, interest, bonus, capital gains, etc., available to the holder of the investment. The return can be measured as the total gain or loss to the holder over a given period of time and may be defined as a percentage return on the initial amount invested. With reference to investment in equity shares, return is consisting of the dividends and the capital gain or loss at the time of sale of these shares.(Omisore et al,2008) Risk in investment analysis, is the unpredictability of future returns from an investment. The concept of risk may be defined as the possibility that the actual return may not be same as expected. In other words, risk refers to the chance that the actual outcome (return) from an investment will differ from an expected outcome. With reference to a firm, risk may be defined as the possibility that the actual outcome of a financial decision may not be same as estimated. The risk may be considered as a chance of variation in return. Investments having greater chances of variations are considered more risky than those with lesser chances of variations. No investor can predict with certainty whether the income from an investment will increase or decrease and by how much. Statistical measures can be used to make precise measurement of risk about the estimated returns, to gauge the extent to which the expected return and actual return are likely to differ. There is another measure of risk known as ? which measures the risk of one security/ portfolio relative to market risk. The market risk is represented by fluctuation in the market benchmark, that is, market index. Shares whose ? factor is more than 1 are considered risky. It may be noted that ? is a measure of systematic risk which cannot be diversified away. The total risk of an investment consists of two components: diversifiable (unsystematic) risk and non- diversifiable (systematic) risk. The relationship between total risk, diversifiable risk, and non-diversifiable risk can be expressed by the following equation:Total risk = Diversifiable risk + Non diversifiable risk (Omisore et al,2008). As can be seen from the above, risk is the product of two elements – likelihood and impact. Any risk will be significant only when both the likelihood and impact are reasonably high. Risks that are unlikely to happen or likely to have negligible impact are not real risks. (Frame, 2003, p. 7) Higher level of unpredictability of returns or events signifies greater risk because there is a higher chance of results varying from the expected ones. 3.1.2 Types of Risks Risks can be of different types. Apart from financial risk, an organization might be exposed to various business risks, economic risks, and political risks. While analyzing the risks in the case of Morrisons, (or any other publicly traded company) the financial and business risks faced by the company, as well as the investment risks faced by the investor, need to be considered. Both these risks are closely associated with the returns, and are separately considered in the following sections. Investor Risk and Returns Investor risk and returns are based on the market price of the share, the total returns, dividend yields, and the volatility of the share price. 3.1.3 Share Price and its Movements The price of Morrisons share as on February 1, 2012 was ?297.5. The movement in the price of the share on an annual basis during the period 2008-2012, along with the EPS reported for each year and the computed value of the Price-Earnings ratio are shown in Table-5. The prices shown are as at the first day of the following year (1st February), and if that was a holiday, the next working day. GBP millions 2008 2009 2010 2011 2012 EPS (Pence) 20.79 17.39 22.8 23.93 26.68 Dividends 4.8 5.8 8.2 9.6 10.7 Market Price 297.5 258.25 298.5 276.8 290 Price/Earnings 1430.98 1485.05 1309.21 1156.71 1086.96 Dividend Yield 0.02% 0.02% 0.03% 0.03% 0.04% Table-5 Market, Price, Earnings per Share, and P/E ratio of Morrisons The most glaring observation that comes out from Table-5 is the extremely high Price-Earnings ratio, which has been maintained at a high level over a period of five years. The implication for the investors is an extremely low return on their investment in the share. A Price-Earnings ratio above 1000 implies that the share of earnings of each investor at the prevailing price represents less than 0.1%. However, the investor does not get the entire earnings of the company, since a part of it is retained and invested in the business. What the investor in the company gets is the dividend distributed. Dividend yield is the ratio of the dividends declared to the market price of the share, and represents the actual return earned by investors on their investment (assuming they purchase the shares at the latest price). The dividend yields of Morrisons shares for the five years 2008-2012 can be seen from Table-5. It can be seen that the dividend yield varies from 0.02% in 2008 to 0.04% in 2012. Although the dividend yield has shown a modest increase over the years, it continues to be very low. The risk-free rate in the U.K., represented by the Bank of England’s benchmark rate is 0.5%, which is an all time low figure. (Trading Economics, 2012) The dividend yield of Morrisons is far below the risk-free rate, which itself is at an all time low. Obviously, the investor in Morrisons share is getting a return that is far below normal expectations or that of the cost of capital, considering the risk associated with the share. The only reason an investor would accept such a low return is an expectation of future appreciation in the value of the share. However, a look at the share prices over the five year period has actually dropped from 297.5 in 2008 to 290 in 2012, and has been fluctuating above and below these values in the intervening years. The high price could only be justified on the grounds of exceptional future projections, but this also seems unlikely, given the market conditions and past growth record. The stock price variations on a monthly basis are shown in Appendix-2. Also shown in the appendix are the monthly variations in the FTSE index. Based on these variations, the beta of the stock is found to be 0.0703. This shows that the variation is the price of Morrison share is extremely low compared to the variation in the benchmark index. This makes the share a low risk investment. To a certain extent this could justify the high price and low returns. However a return that is substantially lower than the risk-free return cannot be justified on grounds of low beta alone. 3.1.4 Comparison of Price and Returns with Competitors The performance of Morrisons in terms of selected valuation measures as against two of its main competitors are shown in Table-6 Valuation Measures Morrisons Sainsbury Tesco Trailing P/E (ttm, intraday): 975.28 1,040.12 966.42 Price/Sales (ttm): 36.88 27.82 39.8 Price/Book (mrq): 125.57 115.11 148.46 Profit Margin (ttm): 3.88% 2.71% 4.17% Return on Assets (ttm): 6.36% 4.61% 4.24% Return on Equity (ttm): 13.03% 11.05% 16.26% Diluted EPS (ttm): 0.27 0.32 0.34 Qtrly Earnings Growth (yoy): 0.90% 6.00% -6.80% Total Debt/Equity (mrq): 37.69 52.33 72.14 Current Ratio (mrq): 0.57 0.63 0.7 Book Value Per Share (mrq): 2.12 2.93 2.17 Table-6 Comparison of Morrisons Performance with Main Competitors in terms of selected measures Although the P/E ratio in the case of Morrison is very high and the dividend yield is very low, the performance of its competitors is not much better. In fact, Morrison’s P/E ratio of 975.28 is only slightly higher than that of Tesco (966.42), and much lower than that of Sainsbury (1040.12) Apart from P/E ratio, even the other indices show that Morison is either better placed than its competitors or just about average. As far as profitability is concerned, return on assets is the highest in the case of Morrison, while the profit margin and return on equity are average. Morrison has the lowest debt/equity ratio of 37.69 as against 52.33 for Sainsbury and 72.14 for Tesco. The current ratio of 0.57 is lower than those of both Sainsbury (0.63) and Tesco (0.7) Thus except for liquidity, Morrison compares favourably with its competitors in other parameters. 3.1.5 Business Risks Business interruption is a major risk where infrastructure plays a pivotal part in such a risk to arise. In order to operate effectively, the company’s distribution and system infrastructure are important and having unfortunate incidents could affect trading in the long run. A solution to this is proper recovery plans. Risk in the form of business strategy where, Morrisons having group and stakeholders, need to manage strategic risks together and if this strategy is not communicated properly, the business will suffer. Such risks are looked upon by giving the importance of making decisions to the senior executives and CEO. The Group would also have nominated a Board and engages with stakeholders, shareholders, employees and other groups to ensure its success. Risks are even prominent in providing quality of training and development to colleagues of the Group. To mitigate this, the Group has stood atop other competitors in regard of better employment policies, remuneration and benefit packages. Another risk is in protecting valuable resources and objectives like Environment, Society and Business which comes under CSR. Failing to give due importance can damage reputation and lose the trust of prospective stakeholders. Management Board, Corporate Compliance and Responsibility Committee help to avoid such risks by having evaluation and verification systems integrated into the operational activities within the business. Another risk is funding, where uncertainties produced by fluctuations in interest and foreign exchange can relate the Group’s inability to finance its trading activities. Policies and procedures authorized by the Board in accordance with the Treasury committee control the Group’s treasury operations to predict and control the efficient use of funds. Some of the significant business risks faced by Morrison, and the steps taken to mitigate them are shown below. 3.1.5.1 Business Risks Business interruption: Systems and infrastructure are fundamental to the operation of Morrisons stores. Any interruption to these can cause business interruptions and loss of profits. Strategy: There is a risk involved in the formulation of strategy for Morrisons. Strategy forms the basis on which other actions are initiated. Faulty strategy can result in serious losses. Employee engagement and retention: Selecting the right type of employees and retaining them are keys to the success of Morrisons. Having the wrong persons or failing to retain the right people can result in significant losses. Property: Morrisons needs the right property to ensure healthy growth. Failure to identify or procure such property might result in loss of opportunities. Product quality and safety: These are fundamental to the business of the company and any major problems in these areas can result in long term loss of image and business. Financial risks: These include availability of funds and the normal financial risk associated with exchange and interest rates. 3.1.5.2 Mitigation Business Interruption: Morrisons have developed recovery plans and created a remote disaster recovery site to deal with the eventuality of system failure Strategy: Morrisons engages in regular communication and discussion of strategy with a wide range of stakeholders. Employee engagement and retention: Competitive compensation packages are offered along with good working conditions and opportunities for growth and career development. Employee training programmes are conducted regularly to ensure high competence levels and conducive attitudes. Property: The risks in this area are mitigated by having a formal property strategy and an effective capital approval process. Product quality and safety: Strict standards conforming to ISO 22000 are in place to ensure that safety and quality particularly of food items manufactured are of the highest standards. Financial risks: These are addressed in accordance with clearly defined policies and procedures and are overseen by the audit committee of the board of directors. (Morrisons, 2011a) 4.0 Chapter 4 4.1 Corporate Governance Marc Goergen and Luc Renneboog define corporate governance as, “the combination of mechanisms which ensure that the management runs the firm for the benefit of one or several stakeholders. Such stakeholders may cover shareholders, creditors, suppliers, clients, employees and other parties with whom the firm conducts its business.” (Goergen, 2012) WM Morrisons Supermarkets PLC comprises of a Non- Executive Chairman, two Executive Directors and four Non- Executive Directors in the board. The division of authority and responsibilities are very clear between the Chairman and the Chief Executive where the Chairman is responsible for supervising the duties and performance of the Chief Executive and the Executive Directors are supervised by the Chief Executive. The duties of the Chairman and chief executive are separate. To ensure this, the company’s code specifies that the same person cannot hold both the posts. The Chairman has a formal appointment letter mentioning his duties and roles in accordance with the company. (Morrisons, 2012c). The role of the board is clearly defined and in order to perform this role, the board meets on a regular basis. There are normally eight scheduled meetings per annum. In addition, the board may also meet to consider any special issues or emergency situations. The day-to-day operations are delegated to the management board and capital expenditure matters are delegated to the investment board within clearly defined parameters. The treasury committee has been delegated the authority for day-to-day treasury an associated matters. Routine administrative matters are delegated to the Company Secretary. The annual report will contain details of the board members, details of meetings held and other maters that throw light on the manner in which the board is functioning. (Morrisons, 2012c) The board’s efficiency and effectiveness were tested in the light of three criteria including the board’s ability to achieve its objectives, its ability to work together and its ability to maximise its use of time. Hence, the conclusion was the board proved its effectiveness and strength in the following six areas namely, its approach to strategy, knowledge of stakeholder views, growth of internal control and the management of risks, remuneration, positive culture and involvement and it’s blending of formal and informal meetings throughout the year. However, there were two important issues after the review which would affect the company’s future, being preparation for a change in the organisation and the advance to executive succession planning. In order to make sure that the board has enough knowledge in the group’s management there have been many training programmes which the board received. To name a few, the board has received training on the topics such as health and safety compliance, food safety compliance, the Bribery Act and the Group’s compliance procedures, changes to the Takeover Code, the UK Listing Rules and the Code, competition compliance and merger control, a governance and technical update on the role of the Audit Committee and the operations of financial markets. The training programme will prolong to get regular updates on corporate governance, legal and accounting issues and development programmes. There are four main committees of the board namely Audit, Remuneration, Nomination and CCR committees. Remuneration plays an important role as far as a company is concerned. The main aim of the company’s remuneration committee is to promote a very strong performance as well as creating value for the shareholders on a long term basis. The main intention behind this is to make remuneration policies against the market with a comprehensible remuneration structure so as to enable the company to attract and maintain the key talents for the future success of the company. The following is the remuneration structure of Executive Director at Wm Morrison Supermarkets PLC: Base salary Annual bonus plan. This is based on the profit before tax, strategic scorecard and personal objectives Long term incentive plan delivered in shares, based 75% on earnings per share and 25% on sales over three years. The company places a vast deal of importance on performance-based pay and incentives are provided on the basis of creation of shareholder value. Short term incentives are given on the basis of profit before tax, strategic scorecard and personal objectives. Hence, the combination of total remuneration package and the employment of drawing out performance targets make sure that there is a clear coalition between performance and pay. The company selected and appointed PricewaterhouseCoopers to endow with external advice on executive remuneration from October 2011 onwards. In short, the company’s remuneration committee is very much keen on the environmental, social and governance concerns and the committee makes sure that the remuneration package does not encourage inappropriate behaviour. This package includes benefits such as transportation costs, health provision and, in some cases, a telephone allowance as well. The Executive Directors and entitled for an allowance towards the cost of independent financial advice and receives the company’s staff discount which is not taxable. 4.2 Corporate Social Responsibility Corporate Social Responsibility (CSR) is a concept that is gaining wide currency and is being actively pursued and practised by an increasing number of progressive organizations all over the world. Although there is no universally accepted definition of CSR, it is generally accepted that it refers to the integration of social and environmental concerns of an organization into its culture, values and strategy. There are statutory regulations that govern the minimum CSR requirements of an organization. However, a good CSR programme should go beyond these and should include community involvement, philanthropy, and human rights and human resources management. (Industry Canada, 2012) Corporate Social Responsibility is no longer a luxury or a fad that companies may choose to ignore. It is a way of proactively building reputational capital by being aware of the needs of society and responding to them in an ethical, fair and transparent manner. CSR when practised in this manner provides strategic advantage to the organization. CSR is a modern approach to building reputation and credibility and developing relationships based on mutual interest and trust. (Jackson, 2004, pp. 3-19) A well conceived CSR is also a means of keeping an organization away from questionable practices and unethical behaviour. (Sims, 2003, p. 8) The stakeholders of the company from a CSR point of view include employees, consumers, residents of the locations in which the community operates (including manufacturing and selling), and the governments of the countries in which the company has its operations. (Conley & Williams, 2005) There are several advantages that accrue to an organization from the practice of CSR. Employee commitment and accountability is one such major advantage that arises from the proper practice of CSR. Commitment and accountability cannot be enforced; they have to arise voluntarily through the conviction of the employees about the values of the organization and identification with its culture. CSR provides such an enabling culture that could foster employee commitment and accountability. (Zaineb, 2010) A survey by Hewitt Associates, Canada, revealed that CSR positively influenced employee engagement. The participants in the survey included 50 best employers in Canada. (Swartz, 2012) This is significant in the light of employee engagement being recognized as a risk and critical factor by Morrisons for its success. Enlightened customers are also increasingly demanding social commitment from the companies that they buy from. (Industry Canada, 2012) 4.2.1Corporate Social Responsibility Programme of Morrisons Morrisons has a Corporate Social Responsibility programme that conforms to most of the above criteria. As part of its commitment to society, Morrisons expressly states that business success is measured not merely in monetary terms but in the recognition that resource management and being a positive influence on society are central to long term and sustainable success. Corporate Social Responsibility is a formal and well organized activity at Morrisons. Management of core commitments is handled by the group directors. Ongoing management of CSR is led by the corporate services division. Engagement with key stakeholders, including customers, investors, employees, suppliers, communities, and government and non-government agencies, is an essential part of the CSR programme at Morrisons. The CSR initiatives at Morrisons span a wide range of concerns that include nutritional development, responsible sourcing, sustainable farming, animal welfare, community development, and employee development. (Morrisons, 2011a) Morrisons has won a number of awards in 2011-12, many of which reflect its corporate responsibility and commitment to society. These include awards for “Best Produce Retailer of the Year”, “Employer of the Year”, “Best UK Company for Organizational Learning”, “Fresh Meat, Game and Poultry”, “Business Leader of the Year”, and “Best Scottish Store”. Morrisons has also been reaccredited for carbon trust standard. 4.2.2 Ethics and Conduct Morrisons believes in strong ethical and moral values. Employees (known as “colleagues” within the organization) are treated equally irrespective of gender, sexual orientation, religion or belief, marital status, age, race, and disability. Part time employees are not treated less favourably, and the company actively promotes diversity. Morrisons does not tolerate corruption and bribery on the part of any of its employees for whatever reason. The company has a whistleblower system, under which it encourages employees to bring any immoral or unethical behaviour on the part of anyone to the notice of the management. 4.2.3 Employee Welfare Morrisons has policies that ensure employee wellbeing and encourages two-way communication between employees and management. Special attention is paid to the health and safety of employees at and off work. Physical activity is encouraged, and facilities for such activity are provided. 4.2.4 Farming The policy of Morrisons in respect of farming is to minimize the environmental effects and provide natural food that is healthy and rich in nutrients. Another area of focus is the development of sustainable farming, which includes animal welfare, biodiversity, and reducing the environmental impacts of farming. 4.2.5 Raw Material Sourcing Morrisons makes decisions about sourcing with much care. The company believes in supporting sustainable supply chains, and procures, as far as possible, from local suppliers. As far s food items are concerned, the approach is to procure fresh meat and farm produce direct from the farmers. The company also carefully manages the use of pesticides by its suppliers so s to minimize harmful effects. 4.2.6 Animal Welfare Morrisons concentrated on improving its chicken and egg production system in 2011. The UK based housed chickens were moved to better welfare conditions, where they received better environmental enrichment, such as natural light, bales, pecking objects and perches. The birds are also more closely monitored for specific indicators. Another initiative in this respect was the ‘Nature Nest’ programme, which aims at improving the conditions for the birds and also enhancing the local environment at the same time. A survey of 110Dairy farms was undertaken to identify methods by which greenhouse gas emission could be reduced. Morrisons has made some important discoveries, which is likely to further improve the environment and reduce he carbon footprint. Morrisons is in the process of educating its supplier farmers about these findings and how better environmental practices actually also improve process efficiency. 4.2.7 Fair Working Conditions Morrisons is committed to promoting fair employment practices not only in its own offices and production centres but also in its entire supply chain. To achieve this, Morrisons has drawn up a code, which is agreed to by all its suppliers. Morrisons audits its suppliers against the agreed code, focusing on high risk areas such as emerging markets, poor application of local laws and high labour turnover areas. By focusing on mutual benefits, Morrisons has been able to achieve a high rate of success, and has found that almost 100% of the audited suppliers comply with the code. 4.2.8 Food Waste Prevention Programmes Morrisons has several schemes to minimize food waste. It works with community based organizational networks to distribute surplus food that is nearing the end of its shelf life. In these cases the company offers free food to disadvantaged people. It also sells food at a discount through partnerships with local chains. Incidentally this also benefits the suppliers who are saved the cost of disposing of the goods. 4.2.9 Recycling and charging for bags These are initiatives aimed at reducing environmental impacts of operations. Recycling facilities are now available in a large number of convenient locations for customers to use. Recycled materials such as old clothing go towards helping the less fortunate sections of society through partnerships with social organizations such as the Salvation Army and Save the Children. 4.2.10 Reducing Operational Carbon Emissions Recognizing the issue of climate change as one of the greatest challenges t the international community, Morrisons has committed itself to contributing the most that it can towards the objective of carbon emission reductions. Accordingly, it announced an ambitious programme in 2010 and has started working towards it. The programme covers all its operational arms including stores, manufacturing operations, and logistics. 4.2.11 Supporting Local Communities Morrisons partners with local schools, charities and community groups to drive a positive community spirit. Apart from contributing to local charitable activities and helping in fundraising for deserving causes, this includes educating the local population in a variety of matters. To sum up, Morrisons has been taking a number of initiatives aimed at improving the society and environment and conducting business in a responsible manner. (Morrisons, 2012,”Corporate Responsibility Review 2011-12”) 5.0 Chapter 5 5.1 Future Prospects From the above analysis, it is clear that Morrisons offers an attractive option to almost all its stakeholders. Investors can look forward to healthy long term growth, although the present return on their investment is not too attractive because of the high market price. Creditors can safely lend to Morrisons and can be assured of the safety of their principal and dependability of interest payments. However, the company is most attractive from the point of view of employees. Employees can look forward to career progress, dependability and stability of employment, good working conditions, and existence of strong ethical and moral values and commitment to social causes, making it a fulfilling place to work in. Consequently, the focus of the above analysis has been on the employees. What does the future look like for Morrisons? The financial position of the company and the performance in the past can be used as a guide to find an answer of what lies in store for the company in the years ahead. A look at various indictors considered for the above analysis shows that the trends in respect of most indicators have been positive for most of the five-year period, but the long-term trends have been either flat or slightly declining. A closer examination of the figures reveals that the decline, if any, is restricted to one or two years. This seems to indicate that this is a temporary phenomenon, which Morrisons can overcome in the coming years. The outlook in respect of each of the four parameters, namely liquidity, profitability, solvency and efficiency, is discussed in the following sections. 5.1.1 Liquidity The current ratio has been showing a steady improvement over the last five years, and it can be expected to further improve in the future. Although quick ratio has shown some decline over the period, this is likely to improve, and in any case it is less critical than the current ratio. On the whole, liquidity can be expected to improve to reasonably comfortable levels. Based on past trends, the current ratio should improve to around 0.7 in about two years 5.1.2 Efficiency Ratios The absolute figures of efficiency ratios have been good in the past. The declining trend in the latest years is a cause for concern. However, given the steep rise in the earlier years in all efficiency ratios, asset management in the future is likely to continue to be good. In any case, efficiency of asset management is unlikely to become a cause for concern. 5.1.3 Solvency Debt ratios have been showing an improving trend and the company is likely to have a comfortable solvency position in the future. 5.1.4 Market Performance The share is overvalued in the market based on its returns, book value, and growth. However, this seems to be the case with the industry as a whole. The shares of the competitors of Morrisons are also overvalued. On balance, the future represents a safe but not too attractive option for an investor. The safe liquidity and solvency positions of the company, however, indicate that it is a good prospect from the point of view of creditors. The company is most attractive from the perspective on an employee, as it is likely to provide stable employment, presents opportunities for growth, and is likely to provide a fulfilling employment experience. Works Cited 1. C.C.D. Consultants (2010) Inventory Turnover Ratio Interpretation. [Online]. Available at: http:// www.ccdconsultants.com/documentation/financial-ratios/inventory-turnover-ratio-interpretation.html [Accessed: 25 October 2012]. 2. Cengage (2002) J. Sainsbury plc and the UK food retail industry. [Online] Hampshire, Cengage Learning EMEA Ltd. Available from: http://cws.cengage.co.uk/thompson5/students/sainscase.pdf [Accessed 4 December, 2012] 3. Conley, J. M., & Williams, C. A. (2005). Engage, Embed, and Embellish: Theory versus Practice in the Corporate Social Responsibility Movement. Journal of Corporation Law, 31(1), 1+. 4. Fame2.bvdep.com (2007) Fame - Report. [online] Available at: https://fame2.bvdep.com/version-2012822/Report.serv?_CID=33&context=L7UQ7YSADPR8U66 [Accessed: 17 Sep 2012]. 5. Finance Management (n.d.) Financial Analysis [Online] Available from: http://www.efinancemanagement.com/financial-analysis/89-debt-to-equity-ratio [Accessed: 12 October 2012]. 6. Frame, J. D. (2003). Managing Risk in Organizations: A Guide for Managers. San Francisco, Jossey-Bass. 7. Fleming, M. (1986). The Current Ratio Revisited. Business Horizons/ May-June. 8. Goergen, M. (2012). International Corporate Governance. New York, Pearson. 9. Gibson, C. (1987). How Chartered Financial Analysts View Financial Ratios. Financial Analysts Journal. May/June 1987, Vol. 43, No.3, 74-76 10. Horne, J. and W,John. (2000). Fundamentals of Financial Management and PH Finance Center CD. Prentice Hall: Eleventh Edition. 11. IGD (2012). The institute of Grocery Distribution and IGD Services Limited [Online]. Available at: http://www.igd.com/index.asp?id=0 [Accessed: 27 October 2012]. 12. Industry Canada (5 March 2012) Corporate Social Responsibility. [online] Available from: http://www.ic.gc.ca/eic/site/csr-rse.nsf/eng/rs00129.html [Accessed December 6, 2012] 13. Li, E. (2008) Supermarket Chains and Grocery Market in the UK. [Online] Shanghai, China Europe International Business School. Available from: http://www.ceibs.edu/bmt/images/20100319/23714.pdf [Accessed 4 December 2012] 14. Martinelli, E. and Sparks, L. (2012) Food retailers and financial services in the UK: A Co-opetitive perspective. British Food Journal, 105 (9), p.577-590. 15. Mclaney, E and Atrill, P. (2010). Accounting An Introduction. England, Pearson Education Limited. 16. Morris, Derek (2000), Supermarkets: A Report on the Supply of Groceries from Multiple Stores in the United Kingdom: Presented to Parliament bu the Secretary of State for Trade and Industryby Command of Her Majesty October 2000, Norwich, The Stationery Office. 17. M Morrisons (2011a) Annual Report and Financial Statements. [Online] London, WM Morrisons Plc. Available from: http://www.morrisons.co.uk/corporate/2011/annualreport/# [Accessed 4 December, 2012] 18. Morrison Supermarkets PLC. (2011b). Annual report and financial statements- Making Food More Affordable. 19. Morrisons (2012a) Corporate Responsibility Review 2011/12. [online] Available from: http://www.morrisons.co.uk/Documents/Morrisons_CR_Review_5MB.pdf. [Accessed 7 December 2012] 20. Morrisons (2012b) The Bakery - Morrisons. [online] London, WM Morrisons Plc. Available from: http://www.morrisons.co.uk/Market-Street/The-Bakery/ [Accessed: 21 Oct 2012] 21. Morrisons (2012c) Corporate Governance Compliance Statement.[online] WM Morrisons Plc. Available from: http://www.morrisons.co.uk/Documents/Compliance%20statement%20draft%20with%20new%20corporate%20governance%20code%20July%202012%20web%20version.pdf [Accessed 6 December 2012] 22. The Retail Owners Institute. (n.d.) Key Financial Ratios for Retailers [Online]. Available at: http://www.RetailerOwner.com [Accessed: 20 October 2012]. (Details) 23. Riahi-Belkaoui, A. (1998). Financial Analysis and the Predictability of Important Economic Events. Westport, CT, Quorum Books. 24. Saleem,Q. and Rehman,R. (2011). Impact of liquidity ratios on profitability (Case of oil and gas companies of Pakistan). Interdisciplinary Journal of Research in Business, pp. 95-98. 25. Shim, J. K., & Siegel, J. G. (2007). Schaum's Outline of Financial Management. New York. McGraw-Hill. 26. Sims, R. R. (2003). Ethics and Corporate Social Responsibility: Why Giants Fall. Westport, CT, Praeger. 27. Swartz, Mark (2012) Corporate Social Responsibility Promotes Employee Engagement. Monster. [online] Available from: http://hiring.monster.ca/hr/hr-best-practices/workforce-management/employee-retention-strategies/corporate-social-responsibility-canada.aspx [Accessed December 6, 2012] 28. Trading Economics (2012) Economics [online] Available from: http://www.tradingeconomics.com/ [Accessed 5 December 2012] 29. Zaineb, Asma (July 20, 2010) How to Make Employees Accountable. ComLab. [online] Available from: http://blog.commlabindia.com/elearning/employee-accountability [Accessed December 6, 2012] Appendix -1 GBP millions 2008 2009 2010 2011 2012 Sales 12,969 14,528 15,410 16,479 Read More
Cite this document
  • APA
  • MLA
  • CHICAGO
(“A contextualised analysis of MORRISON (WM) SUPERMARKETS PLC Coursework”, n.d.)
A contextualised analysis of MORRISON (WM) SUPERMARKETS PLC Coursework. Retrieved from https://studentshare.org/finance-accounting/1402903-contexualised-analysis-of-wm-morrison-supermarkets
(A Contextualised Analysis of MORRISON (WM) SUPERMARKETS PLC Coursework)
A Contextualised Analysis of MORRISON (WM) SUPERMARKETS PLC Coursework. https://studentshare.org/finance-accounting/1402903-contexualised-analysis-of-wm-morrison-supermarkets.
“A Contextualised Analysis of MORRISON (WM) SUPERMARKETS PLC Coursework”, n.d. https://studentshare.org/finance-accounting/1402903-contexualised-analysis-of-wm-morrison-supermarkets.
  • Cited: 0 times

CHECK THESE SAMPLES OF A contextualised analysis of MORRISON (WM) SUPERMARKETS PLC

The Strategies Employed by Morrisons Supermarkets

hellip; The SWOT analysis of morrison Supermarket reveals the actual forces it is facing both internally as well as externally.... Contents Executive Summary 4 Contents 5 Introduction 6 Analysis and Critical evaluation of morrison's Supermarkets 6 Analysis of Strategic Direction of morrison'... Morrisons supermarkets CW1 -Summary Morrison Supermarket is presently UK's fourth biggest retail super market.... The morrison faces many threats from its surrounding environments like Price wars....
9 Pages (2250 words) Essay

Wm Morrison Supermarkets Plc

Wm Morrison supermarkets plc is the fourth largest chain of supermarkets in the United Kingdom.... Wm Morrison supermarkets plc - Company Profile Snapshot, (http://wrightreports.... Wm Morrison supermarkets plc branded advanced profit before tax in fiscal 2009, after it wheedled consumers with freshened and rebranded stores.... The company is one among the major four supermarkets and has a share of 11.... Wm Morrison supermarkets LLC (Morrison) one of U....
12 Pages (3000 words) Case Study

Morrisons Supermarket a Company Investigation

Reportedly, listed as Wm Morrison supermarkets, it is considered the fourth largest chain of supermarkets in the UK.... rdquo; Morrison's supermarkets  are backed up by hundreds of special offers each time (Morrison's, 2006 and Wikipedia, 2006) from discounts to "buy one take one" topped by the wide range of goods offered from their own label "Bettabuy" and "Farmer Boy" to branded ones such as the overtaken and now-defunct Safeway (BBC News, 2005) upmarket group products called "The Best....
6 Pages (1500 words) Case Study

Full internal and external environmental analysis of Morrisons

William Morrison Supermarket plc, UK's fourth largest food retailer, is one of the most competitive companies in the British food retailing industry.... The Stakeholder's Analysis is applied to the William Morrison plc group.... In Britain, the supermarkets are defined as stores with at least 2,000 square feet having three or more checkout counters.... These modern supermarkets stock merchandise comprising of food groups and regular household items....
18 Pages (4500 words) Essay

Equity Analysis of Morrison Supermarkets Plc

Share price, with particular regard to the recent company's competitive positioning in a fast changing environment, where the competitive positioning and the price-based… oning can be seen as some of the main elements that affect Morrison's capacity to maintain adequate profitability levels and generate value for the shareholders as well. A special attention will be dedicated also to the evaluation of share price from one side in light of the ore capabilities of morrison supermarkets from an analytical perspective, and on the other side in light of the macroeconomic conditions in the markets and industry in which the company itself conducts its operational activities....
11 Pages (2750 words) Essay

Financial Analysis Of J Sainsbury PLC And Morrison PLC

Despite the fact that interest coverage of morrison's is much better than Sainsbury, it does not affect the decision to invest in Sainsbury.... The paper "Financial analysis of J Sainsbury PLC And Morrison PLC" detailed compares for investment two chosen companies: Morrisons and J Sainsbury.... Different trends and ratio analysis have been used to compare the two options which are detailed as follows....
4 Pages (1000 words) Essay

The SWOT and the PESTLE Analysis of Morrison Plc

In this regard, the SWOT analysis of morrison reflects that more than 500 stores only in the United Kingdom remain the strength for the company as this chain of stores enables the company to access to the customers and generate sales.... The report will evaluate the current strategic marketing of morrison.... The results reflect that more than 500 stores of morrison are its strength and weak discount policy has been the biggest weakness for the company....
12 Pages (3000 words) Essay

Business Continuity Management

It provides a critical analysis of the operating environment and stakeholder, examines the critical activities of the supermarket.... It provides a critical analysis of the operating environment and stakeholder, examines the critical activities of the supermarket, and evaluates the maximum tolerable period of disruption.... The company, which is commonly known as Morrisons, is listed under the London Stock Exchange (Wm Morrison Supermarket plc 2004)....
10 Pages (2500 words) Case Study
sponsored ads
We use cookies to create the best experience for you. Keep on browsing if you are OK with that, or find out how to manage cookies.
Contact Us