StudentShare
Contact Us
Sign In / Sign Up for FREE
Search
Go to advanced search...
Free

Financial Situation of the Yule Catto and Company PLC - Case Study Example

Cite this document
Summary
In the current case study "Financial Situation of the Yule Catto and Company PLC" it is claimed that as a part of the chemical industry the company operate long with its subsidiaries under its three major divisions - Polymer, Pharma and Impact Chemical…
Download full paper File format: .doc, available for editing
GRAB THE BEST PAPER98.2% of users find it useful
Financial Situation of the Yule Catto and Company PLC
Read Text Preview

Extract of sample "Financial Situation of the Yule Catto and Company PLC"

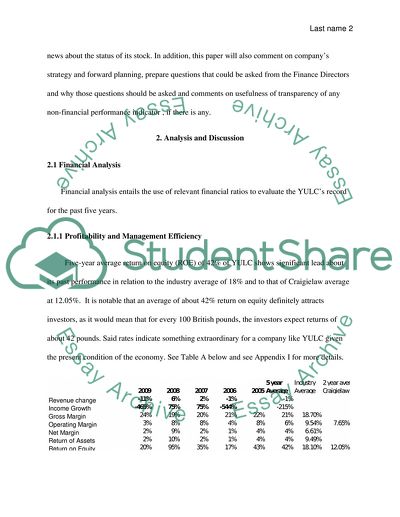
1. Introduction Yule Catto & Company PLC (or “YULC”), as a part of the chemical industry (Reuters.com, 2010) operate long with its subsidiaries under its three major divisions --- Polymer, Pharma and Impact Chemical. The first division supplies water-based polymers to as used in constructions, adhesives, paper industries and textile while the second division develops and manufactures active chemical ingredients as well as fine chemical intermediate for big pharma, generic and biotech sectors of the science life industry. As distinguished from the first two, the third division consists of a number of individual speciality chemical business entities. YULC’s sale of its Oxford Chemical Limited is part of its lasts development in 2009.1 This paper seeks to analyze the stock of YULC whether the company is worth investing into by examining the company’s financial ratios of performance, liquidity, solvency position, market ratios and dividends for the past five years. Comparisons with Craigielaw plc and industry averages will also be made to enhance analysis. This paper will relate with the analysts’ estimate and projection on the company’s stock and what they are saying about company and any relevant news about the status of its stock. In addition, this paper will also comment on company’s strategy and forward planning, prepare questions that could be asked from the Finance Directors and why those questions should be asked and comments on usefulness of transparency of any non-financial performance indicator , if there is any. 2. Analysis and Discussion 2.1 Financial Analysis Financial analysis entails the use of relevant financial ratios to evaluate the YULC’s record for the past five years. 2.1.1 Profitability and Management Efficiency Five-year average return on equity (ROE) of 42% of YULC shows significant lead about its past performance in relation to the industry average of 18% and to that of Craigielaw average at 12.05%. It is notable that an average of about 42% return on equity definitely attracts investors, as it would mean that for every 100 British pounds, the investors expect returns of about 42 pounds. Said rates indicate something extraordinary for a company like YULC given the present condition of the economy. See Table A below and see Appendix I for more details. Table A- Summary of profitability and efficiency ratios.2 Measuring profitability based return on equity that uses net profit and dividing the same by the total stockholders’ equity should give a convincing argument for decision makers. Compared to an average rate of 0.50% Bank of England base rate if money was invested in a bank, ROE would make a net advantage almost mind boggling as ROE is more than fifty times. Thus, for investors to let the opportunity escape them would be almost be unbelievable. The 0.50% is the UK base rate of the Bank of England3 could represent the risk-free-rate investment in the UK and could be used as the minimum bank rate for comparison purposes. Profitability should be interestingly with viewed the company management’s efficiency. To measure the latter, this paper uses return on assets (ROA). YULC’s ROA for five-year average, the rate of 4% for the company is lower than the industry average of 9.49%. Although ROA is claimed to indicate a profitability measure, the same may also tell how efficient management the company had in terms of profits in relation assets employed in business. ROE alternatively measures how much management compensates resources invested by stockholders. By comparing the two ratios, it appears that YULC is still profitable but is less efficient than industry. ROE and ROA difference in evaluations may be further studied in the company’s average net operating margin and net profit margin. The resulting operating profit margins for the last five years averaged at 6% as against that of Craigielaw average at 7.65 and of industry average of 9.54%, hence the issue must go down to net profit margin. Further proceeding with the analysis starting with operating margin that represents the margin after deducting cost of sales or services and operating expenses, some values need to be added or deducted to get to net profit margin. These other items may include interest income, interest expense and other non-operating items. The resulting lower net profit margin than industry settles the issue by confirming better profitability but lower efficiency.4 Said profitability ratios such as return to equity, operating profit margin and net profit margin however show only the capacity of the company from a historical perspective. To determine whether past profitability and liquidity would continue is another question but it can be argued that the company could more probably repeat what happened in the past than when there are no previous data to show track record. Such is a plus factor in influencing the prices of its stock as a final barometer on how the company is expected to benefits its stockholders. 2.1.2 Liquidity YULC’s liquidity is its ability to meet a company is currently maturing obligations.5 It can be measured using the current ratio and the quick asset ratio. In the case of the company, the following information in Table B below summarizes some of the information. See Appendix I for more details. Table B- Summary of liquidity and solvency ratios.6 YULC’s current ratio uses it total current assets and divided the same by its total current liabilities while its quick assets ratio is almost the same except the need to reduce the current assets by deducting the inventory, prepaid expenses and other current assets to produce the quick assets as numerator. Since the denominator is the same in quick asset ratio or acid test ratio, the latter is more strict measure of liquidity. Quick assets then include only cash, marketable securities, and accounts receivable.7 As applied now to YULC, its computed current ratio is 0.95 as against Craigielaw average of 1.13 and industry average of 1.55. Quick ratio of the company on the other was reflected at 0.67 as against as against Craigielaw average of 0.73 and industry average of 1.08. Both ratios for the company are lower than industry averages, indicating poorer liquidity. Generally, a current ratio of at least 1.0 can be still considered liquid as current liabilities is still matched by current assets of a company but since both of said ratios are below 1.0, YULC may be almost categorized as less liquid and its current assets are not enough or that it may have working capital problem. Since its current ratio of 0.95 is very near the cut-off rate of 1.0 as generally used, YULC may just be considered as still generally. See Table B above in relation to Appendix I. 2.1.3 Solvency Solvency measures YULC’s long-term capacity to keep up it stability over the long term. Using the debt to equity ratio to measure same, by dividing the total debt of the company divided to its total equity, solvency should inform investors that the company need to survive over a long period to recover long-term investments. The debt to equity ratio of YULC is 12.94 as against as against Craigielaw average of 0.34 and industry average of 0.39. The solvency ratio makes it almost 30 times more than the industry average and this means the value the company investments from stockholder is weaker for the company as against its competitors. As an evidence of a highly leverage capital structure for YULC, its high debt to equity ratio would paint the company as dangerously able to make further expansions in the future without falling to be further riskier than present competitors were. It means suffering from a significant level of difficulty able to manage its long terms risk that its profitability may not be enough to provide funds to pay currently maturing obligations and to provide good amount of dividends annually to investors. 2.2 Market ratios YULC’s market ratios paint how well the stocks of the company are valued by the stockholders. As management tries to maximize the wealth of stockholders8, there must be a way to measure the same including measures of attaining the objective. How valuable are the stocks of the company in relation to its earnings and its book values of the company should be important to investors. Table C below summarizes the market ratios for the company as against is competitors in the industry. Table C- Summary of Market or Valuation Ratios9 In terms of P/E ratio, the YULC is definitely better at 64.37 for the latest twelve-month as against industry average of 2.77 or more than 20 times. The very high valuation ratios of YULC mean that investors are willing to risk more in buying the company’s stocks than competitors. As mind boggling as the ROE advantage compared with industry, the abnormally high P/E implies the company must be performing superbly both in terms of profit and wealth-maximization objective attainment. Two remarkable ratios actually support each other since profitable financial performance should generally result to higher stock performance. In relation to high P/E, analysts recommend a buy decision rather than sell.10 2.3 Dividends It is interesting to note that the company can also satisfy the need of stockholder for their dividends. The decision of YULC to provide dividends for the past years indicated might prove its commitment to provide what is expected by its stockholders better than competitors do.11 Given however the highly leverage capital structure of the company, its giving of high dividends to stockholders may further cause the company to be more risky. Latest dividend yield shows the company to be giving more to stockholders than competitors. 12 It has higher dividend yield than industry based on the latest annual report and on five-year average as may be noticed below. 2.4 Comment on strategy and forward planning by the company. YULC Chairman Peter Wood stated that the company expects western economies to grow slowly for several years with global growth expected to be generally driven from emerging markets.13 The claim to expect growth from emerging market may be considered in order but this might be doubtful as the company sales growth is comparably lower than the industry when the economy was not doing well. The chairman also claims that the company’s business model is well adapted to this scenario by claiming that with almost half of the company's revenues generated in Asia and other high growth developing economies.14 There seems to be a problem with the claim for growth on emerging industries. The company is very highly leveraged and to address expanding revenues, it would need big investments, which the company may hardly put without putting the company more risky. It can be argued that if other companies in the industry have done something good during the last five years, why had the company not done as well in increasing revenues and profit. The chairman further asserted that the company has robust market sectors, a health new product.15 This claim appears not fully supported with what happened in the last five years with low growth revenues. Claims for significantly strengthened balance sheet is also not supported given that the company is still highly leverage. 2.5 Possible questions to the Finance Director This researcher would like to ask Finance Director why would management still promises dividend in the coming years when it has a very high leverage position. This question is asked because it would appear unfair to creditors of the company to promise the agents dividends when creditor may be at more disadvantage position since the company may eventually get bankrupt if is high leverage position is not corrected in the light of declining revenues on the average and low net profit margin. This researcher would like also to ask why revenues and incomes have been dismally growing for the past five years when the financial crisis has just started not earlier than 2007. Is there something wrong with the marketing strategy of the company? What made other companies in the industry performed better in terms of revenue growth for the last five years? These questions require responsive answers since a company although has the objective of maximizing wealth, it must also show proof of its capacity to serve its it customers. If customers will not avail or products and services of the company and yet the stock price of the company is behaving abnormally high, this could be a sign that a bubble is in the making and it would soon burst. The final question would be is the company just serving the interest of the stockholders at the expense of other stakeholders? This would mean demanding corporate responsibility based on financial analysis made on the company. 2.6 Comment on usefulness and transparency of information about non-financial indicators, if any. The company claims to have made some innovations for its products based on it research and development efforts. The company announced its having invested in technology named Synthomer's Pioneering Technology on self-crosslinking latex.16 Since the technology appears to have invested heavily on research and development in terms of additional scientist new research laboratories equipped with modern equipment and the related laboratory applications for customer support and applications development. The company was announcing the same to its customers or other stakeholders by putting the information on its annual report for 2009 for the purpose of transparency and advertising. Information serves its purpose if it will help decision makers. The company may indeed be making important decision, which will be material in accomplishing its financial and non-financial objectives. To be transparent means to tell one’s stakeholders what is happening and to be responsible for the consequences for that information. It may not however have to overdo transparency as it could result to revealing one’s secrets and losing the expected or existing competitive advantage as result innovations made in its operations or product development. 3. Conclusion Given YULC’s very high profitability, such may appear to be good reason of investing with the stocks of YULC. Its generally has lower than industry average efficiency and liquidity may be eventually improved by such very high profitability. This may course also help the company in eventually reducing its highly leverage position. Given also the higher P/E ratio of the company and higher market to book values than industry average, YULC could be inferred to have a good future. However, finance theory argues that the higher the return the higher the risk.17 Thus, the high P/E and the high ROE deserve a closer look. YULC’s stock price is very high in relation to revenue growth and income growth. Thus investing by buying YULC stocks may not be perfectly appropriate at this time when increase in profits and stock price is not supported by increasing revenues. A cautionary holding of not so big stock investment would sound more prudent to allow a possibility of overvaluation of its stock to go back to its justifiable level given the negative average growth in revenues. The average ROE may be very high even against industry averages but the high rate is cause the low equity in relation to net income rather than an income growth and revenue growth. Between a choice to buy or sell YULC’s stocks selling should be given more weight than buying since the improvement in financial leverage for the last five years and appearing as incremental improvement should not be automatically considered as a sign of fiscal discipline that may justify its high price earnings ratio and beta level higher than the industry. Revenue and net income growth should be controlling. This paper strongly recommends to a conservative investor choose to sell its stockholdings from the company while the stock prices are high in the light of the abnormally high P/E of the company for the most recent twelve trailing months. This recommendation contradicts the earlier analyst’s recommendation to hold and/or buy the stocks of the company, as these analysts appear to forecast that the prices would go up in the future. This researcher finds the company’s stock to be overvalued and the very ROE given the negative growth in earnings and revenues would eventually seek it rightful level down to its intrinsic or more realistic value. Considering that in 2009 revenues already declined and the average growth rate in revenues for the past five years was in fact, below zero, there is basis strong basis for caution. The high beta and high-leverage position of the company could support recommendation for rather selling stocks of YULC now. Given also the minimal liquidity position, the case of YULC may just be a bubble that is bound to burst soon. It is better to be cautious than being sorry later. Joining the bandwagon is the easiest thing to do. The fundamental analysis should be convincing to decision makers that the economy can only sustain growth, which should be translated in realistic prices. When many markets are down due to crisis, being part of those who want to have earnings is the most easy thing to do. However, to be wise and cautious is the most responsible thing to do. Appendix 1 – Summary of Financial Data and Ratios18 Works Cited “Analyst Recommendation” 2010. Reuters, 15 November 2010 http://www.reuters.com/finance/stocks/analyst?symbol=YULC.L “Annual Reports for 2009, 2007 and 2005”. 2010. Yule Catto. 15 November 2010 < http://www.yulecatto.com/yulecatto/site.nsf/page!openform&page=investorpublications> “Bank of England Base rate” (2010). Housepricecrash.co.uk., 15 November 2010 http://www.housepricecrash.co.uk/base-rates.php Brigham and Houston. Fundamentals of Financial Management, Thomson South-Western, London, 2002 Craigielaw plc computed ratios –as given “Company Profile of Yule Catto”. (2010). Reuters. 15 November 2010 Read More
Cite this document
  • APA
  • MLA
  • CHICAGO
(Financial Situation of the Yule Catto and Company PLC Case Study, n.d.)
Financial Situation of the Yule Catto and Company PLC Case Study. Retrieved from https://studentshare.org/finance-accounting/1744936-analysis-of-published-financial-information
(Financial Situation of the Yule Catto and Company PLC Case Study)
Financial Situation of the Yule Catto and Company PLC Case Study. https://studentshare.org/finance-accounting/1744936-analysis-of-published-financial-information.
“Financial Situation of the Yule Catto and Company PLC Case Study”, n.d. https://studentshare.org/finance-accounting/1744936-analysis-of-published-financial-information.
  • Cited: 0 times

CHECK THESE SAMPLES OF Financial Situation of the Yule Catto and Company PLC

Pacific Precision Financial Situation

Net working capital (NWC) is a measure of the company's efficiency in utilizing its financing to cover its current and immediate obligation.... It should be noted that during 2002, the company's days of NWC is recorded at 86.... It should be noted that the company has aggressively changed its strategy by pursuing the expansion of its product line.... Even though the business organization has managed to generate sales from the introduction of bar code devices, the company is also forced to sacrifice its collection period, thereby making it resort to short term financing to cover its current liabilities. Pacific Precision's increasing NWC can be examined by looking at the components of this financial measure....
3 Pages (750 words) Essay

Ratio Analysis: Investing in the Company

6% (Tesco plc, “Group income statement”, 2009).... In the following essay “Ratio Analysis: Investing in the company” the author analyzes an important tool for assessing the financial performance of a company.... This can be used for comparing its performance with the past and for inter-company comparison.... hellip; The author states that for the financial year ending February 2009, the current ratio of the company is 0....
2 Pages (500 words) Essay

Financial Statements for Blacksea PLC

The management of the company uses it for their internal review, long term planning and corrective actions as necessary.... Fixed assets, also called long term investments of the company in land, plant, building, equipment, fixtures, furniture etc.... It is nature of the business that decides whether the company will have more capital employed in the current assets or in the fixed assets.... So goes with liabilities of the company....
6 Pages (1500 words) Assignment

Employee training at B&Q Plc

This paper “EMPLOYEE TRAINING AT B&Q plc” aims at discussing Mentoring and Vestibule Training as two of the training methods that are used at B&Q plc.... There has been a various change in the employment policy at B&Q plc.... About a decade ago, many business analysts criticized B&Q plc.... As for the case of B&Q plc.... hellip; The writer concluded since the company decided to adopt a mixed age policy in employing their staff mentoring has been effective in making sure that the junior employees can learn from the senior employees who are more experienced....
8 Pages (2000 words) Essay

Gross Profit Margin of the Orange Company

This gross profit is desirable since it shows that the company's financial health is good.... The maintenance of the margin in 2014 shows the consistency of the company in its good performance.... The decrease of the margin in the two-year period is a The company's return on equity ratio was 25% in 2014 and 8.... The return on equity ratio measures the company's performance in earning return to its shareholders.... Despite the company having a low ratio in 2015, it had significant high performance in 2014 by having a fair return to its shareholders....
8 Pages (2000 words) Coursework

Financial Management in the Jovi plc Company

This paper 'Financial Management in the Jovi plc Company" focuses on the fact that the Financial Management deals with areas like determining Financial needs, selecting the sources of funds, financial analysis, and interpretation, Cost Volume Profit Analysis, Capital Budgeting.... Company Jovi plc is more concerned about the utilization of money in the most effective way.... The problem company Jovi plc is facing in the financial area is that there is no proper cash flow, which in turn leading to no funds for further investment as well as to pay a dividend....
7 Pages (1750 words) Case Study

The Investment of FUSE Plc

The paper “The Investment of FUSE plc” focuses on the investment criteria set by FUSE plc.... These are the present values of its equity and its debts; as a result, the debt-equity ratio would work out to £4966 million divided by £4200 million pounds or a debt/equity ratio of 1:4 FUSE plc has now proposed to finance its investment in Pakistan in terms of equity by raising a rights issue and in terms of debt by securing an unsecured bank loan but without raising its debt/equity ratio significantly....
10 Pages (2500 words) Case Study

Sources of Capital in Duke Plc

This study “Sources of Capital in Duke plc.... hellip; The author states that Duke plc.... For large multi-national organizations like Duke plc.... uke plc.... rdquo; is about all the sources of capital available to the company to finance its long-term projects.... arious sources of long-term financing of a company can be broadly classified into debt funds and equity funds.... All the different types of capital employed by the company constitute the capital structure of the company....
10 Pages (2500 words) Assignment
sponsored ads
We use cookies to create the best experience for you. Keep on browsing if you are OK with that, or find out how to manage cookies.
Contact Us