StudentShare
Contact Us
Sign In / Sign Up for FREE
Search
Go to advanced search...
Free

Gross Profit Margin of the Orange Company - Coursework Example

Cite this document
Summary
The paper "Gross Profit Margin of the Orange Company" discusses that the report is very essential to the company’s employees whether they are the company’s stakeholders or not. The employees need to know how the company is performing since they are part of the company themselves. …
Download full paper File format: .doc, available for editing
GRAB THE BEST PAPER94.7% of users find it useful
Gross Profit Margin of the Orange Company
Read Text Preview

Extract of sample "Gross Profit Margin of the Orange Company"

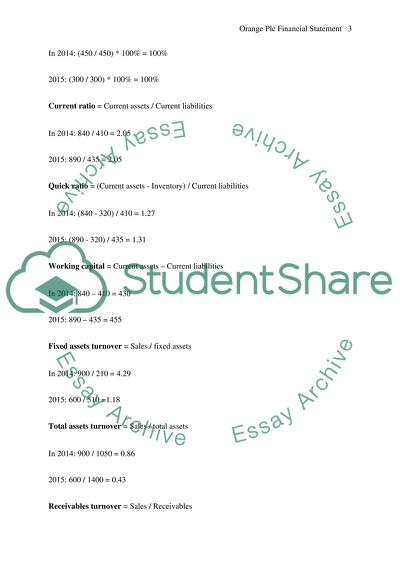
Orange Plc Financial ment By + Financial Ratios Workings: Gross profit margin = (Gross profit / Sales) * 100% In 2014: (450 / 900) * 100% = 50% 2015: (300 / 600) * 100% = 50% Net Profit margin = (Net profit / sales) * 100% In 2014: (110 / 900) * 100% = 12.22% 2015: (45 / 600) * 100% = 7.5% Return on assets = (Net profit / Total assets) * 100% In 2014: (110 / 1050) * 100% = 10.48% 2015: (45 / 1400) * 100% = 3.21% Return on Capital employed = (Net profit / Equity) * 100% In 2014: (110 / 440) * 100% = 25% 2015: (45 / 515) * 100% = 8.74% Return on capital employed = (net profit before tax / shareholder funds) * 100% In 2014: (210 / 440) * 100% = 47.73% 2015: (100 / 515) * 100% = 19.42% Mark up ratio = (gross profit / cost of goods) * 100% In 2014: (450 / 450) * 100% = 100% 2015: (300 / 300) * 100% = 100% Current ratio = Current assets / Current liabilities In 2014: 840 / 410 = 2.05 2015: 890 / 435 = 2.05 Quick ratio = (Current assets - Inventory) / Current liabilities In 2014: (840 - 320) / 410 = 1.27 2015: (890 - 320) / 435 = 1.31 Working capital = Current assets – Current liabilities In 2014: 840 – 410 = 430 2015: 890 – 435 = 455 Fixed assets turnover = Sales / fixed assets In 2014: 900 / 210 = 4.29 2015: 600 / 510 =1.18 Total assets turnover = Sales / total assets In 2014: 900 / 1050 = 0.86 2015: 600 / 1400 = 0.43 Receivables turnover = Sales / Receivables In 2014: 900 / 280 = 3.21 2015: 600 / 510 = 1.18 Inventory turnover = Cost of Goods / Inventory In 2014: 450 / 320 = 1.41 2015: 300 / 320 = 0.94 Trade creditor payment period = (trade credit / credit sales) * 100% In 2015: (300 / 300) * 365 = 365 days 2014: (200 / 450) * 365 = 162 days Trade creditor collection period = (trade debitors / credit sales) * 365 days In 2015: (510 / 600) * 365 days = 310 days 2014: (280 / 900) * 365 days = 114 days Debt ratio = total liabilities / total assets In 2014: 610 / 1050 = 0.58 2015: 885 / 1400 = 0.65 Debt equity ratio = Non-current liabilities / Equity In 2014: 200 / 440 = 0.45 2015: 450 / 515 = 0.87 Profitability Ratios Orange Company had a gross profit margin of 50% in both the two financial periods. This gross profit is desirable since it shows that the company’s financial health is good. The maintenance of the margin in 2014 shows the consistency of the Company in its good performance. The net profit margin measures the company’s performance in generating profits from all the activities it has carried out in a given financial period. These activities include both operational and non-operational activities. The decrease of the margin in the two-year period is a negative indicator towards the decline of the company’s performance. The company’s return on equity ratio was 25% in 2014 and 8.74% in 2015. The return on equity ratio measures the company’s performance in earning return to its shareholders. Despite the company having a low ratio in 2015, it had significant high performance in 2014 by having a fair return to its shareholders. The return on assets was 3.21% in 2015 and 10.48% in 2014. The return on assets ratio measures the company’s performance in generating sufficient profits from its total assets. The company had a low ratio in 2015 desspite the high ratio it had in 2014. This showed a tremendous decline in the company’s performance. The maintenance of a 100% mark up between the two years was a desirable aspect of the company performance. There was a decline in the return on capital employed between the two years using the the two different methods of computing. This trend is undesirable and should be changed since it shows a decline in the company’s performance. Liquidity Ratios The company’s current ratio was 2.05 in both 2014 and 2015. This ratio measures the company’s liquidity by determining the extent in which the company’s current assets can offset its current liabilities. The company maintains a current ratio that is above in both the two financial years implying that the company’s liquidity position is at a fair place since it can easily offset its current obligations with its current assets. The maintenance of this ratio is thus a positive indicator of the company’s liquidity position. The company’s quick ratio was 1.27% in 2014 and 1.31% in 2015. The quick ratio measures the company’s liquidity in a similar way like how the current ratio does but it does excludes the inventory from the current assets. There is exclusion of inventory from the current assets since it is not easily converted into cash like the other current assets. This means basing the company’s liquidity on inventory is inaccurate. The company has slightly increased its liquidity position due to the increase in this ratio between the two years. The company’s working capital was 455 in 2015 and 430 in 2014. The working capital measures a company’s liquidity by determining the extent in which the current assets exceed the current liabilities. The greater the difference between the current assets and the current liabilities the better since it shows that the companies can offset its current obligations with its current assets at ease. The increase in this figure between the two years is highly desirable (Bull, 2008). Efficiency Ratios The company has fixed assets turnover was 1.18 in 2015 and 4.29 in 2014. This ratio shows the amount of revenue earned by the company for every sterling pound of fixed assets. It therefore measures management’s efficiency in utilizing the fixed assets. The decrease in this ratio between the two years shows an incredible decline in management’s efficiency in utilizing the company’s fixed assets. The company’s total assets turnover was 0.43 in 2015 and 0.86 in 2014. This ratio indicates the amount of revenue earned by the company for every sterling pound of total assets. It is a measure of the management’s efficiency in total assets utilization. Decrease of this ratio over the two year is an indication of the decline in management’s efficiency in utilizing the total assets to make sufficient revenue. The company’s receivable turnover was 1.18 in 2015 and 3.21 in 2014. The receivables turnover measures the management’s efficiency in collecting the debts from the company’s debtors. A high receivables turnover ratio is an indication that the company is very efficient in collecting its debt thus a sign of good performance. The decrease of this ratio between the two years shows a decline of management efficiency. The company had an inventory turnover ratio of 0.94 in 2015 and 1.41 in 2014. The inventory turnover ratio measures the number of times a company’s inventory is used in a given financial period. It therefore shows the management’s efficiency in utilizing the company inventory. The decrease of this ratio between the two years is a decline in the company’s performance since it is an indication of a decrease in efficiency (Robinson, 2009). There has been an increase in the trade credit payment period between the two years. This ratio determines the management’s efficiency in paying its creditors. The increase of the credit period shows the company is having problems meeting its obligations. On the other hand it might act positively towards the company’s liquidity position by increasing the size of its working capital. The trade debtor period has increased between the two year period. This shows a decline in management’s efficiency in collecting its debts. Investor Ratios The company’s debt ratio was 0.65 in 2015 and 0.58 in 2014. This ratio determines a company’s leverage by comparing its total liabilities and its total assets. The company’s leverage is at a good level since the ratio is way below one showing that the company can cover its debts comfortably with its assets in case of liquidation. An increase in this ratio such as the one witnessed between the two years shows an increase in the company’s performance in increasing the debt level. The company had a debt to equity ratio of 0.87 in 2015 and 0.45 in 2014. This ratio shows the extent in which a company prefers debt to equity in financing its operations. The increase of this ratio over the two-year period is undesirable to an investor since it shows that the company relies more in debt than the previous period (Rodgers, 2008). Management’s Report The company’s performance has decreased significantly from the previous year. The management is responsible for the decline. There is need for management to improve efficiency to improve the company’s performance. The maintenance of the gross profit margin at 50% from the previous period is a sign of improvement in performance. This is because the company did that despite having decreased its revenue. The management should invest in marketing and advertising the company’s products to maintain the high gross profit margin. The company’s management should strive to increase its sales in a bid to increase the operation profit margin from its currently low level. The decrease of the ratio was undesirable and therefore management need to find out what might have caused the decrease and find ways to increase the ratio. The decrease of the net profit margin was similarly undesirable. The company’s management should focus on the activities that would strive to increase of this ratio. The company should also increase the return on equity it decreased between the two years. This increase attracts many potential investors to channel their funds into the company with the aim of getting a good return. It is therefore management’s duty to increase the ratio. The decrease of the return on assets ratio indicated the company’s ill performance. The management was very inefficient in generating sufficient profit despite an increase in total assets. To achieve a high ratio the management’s needs to remove the ineffective assets from the company. According to the current ratio and quick ratio, the company’s liquidity position increased showing an improvement in performance. The management should maintain this level of liquidity by ensuring that the current liabilities do not exceed the current assets. The company’s working capital increased to between the two years. The management can improve this situation further by collecting its debts quickly while delaying payments to its creditors taking care not get fines. The efficiency ratios indicated a decline in performance by the company’s management. This trend should be stoped and overturned to enhance the growth of the company in performance. There was an indication of an increase in the company’s debt by the investor ratios. The management should try reducing this debt level since high debt levels discourages investors (Buffett and Clark, 2008). The company’s debt reduced by 140 million sterling pounds due to the increase in investments. The company increased its operation capacity to facilitate an increase in production which resulted in the company having a 50% increase in revenue. The company also had to spend plenty of cash in marketing and advertising its products to increase the sales. The investor ratio indicates a reduction of the company’s debt over the two years. The company used part of the money to pay off its debt. Annual Report An annual report is a document that a company publishes yearly to show all the activities it has taken part during the year. The document’s key role is to show the company’s financial performance. In a bid to show the company’s performance, the annual report contains the company’s statement of financial position, the income statement, and the statement of cash flows. The annual report contains the financial statements of a company’s current financial period plus several previous periods’ financial statements to facilitate comparison of the financial performance of the company over the financial periods. The annual report has different segments. these segments covers the following topics; general corporate information, accounting policies, balance sheet, cash flow statement, profit and loss account, notes to the financial statements, chairpersons statements, director’s report and the auditor’s report (Fridson and Alvarez, 2002). Annual report users An annual report is very useful to various stakeholders of a company as it contains a company’s financial information. The report is very essential to the company’s employees whether they are the company’s stakeholders or not. The employees need to know how the company is performing since they are part of the company themselves. They need to take responsibility of the performance of the company. The annual report is also vital to a company’s investors. Investors need to know a company’s performance to know if their investments are viable or not. The company’s performance is therefore vital for them in order to make decisions. A company’s customers and suppliers also find use in a company’s annual report. They need to know the financial performance of a company that they are transacting with to prove the capacity of the company in meeting its obligations. Lastly, the community around the place where a company carries its operations use the company’s annual report to view the policies the company puts in place. Most of these policies are the policies that affect the company such as environmental policies (Tennent, 2008). References Buffett, M. and Clark, D. 2008. Warren Buffett and the interpretation of financial statements. New York: Scribner. Bull, R. 2008. Financial ratios. Oxford: CIMA. Fridson, M. and Alvarez, F. 2002. Financial statement analysis. New York: John Wiley & Sons. Robinson, T. 2009. International financial statement analysis. Hoboken, N.J.: John Wiley & Sons. Rodgers, P. 2008. Financial analysis. Oxford: CIMA. Tennent, J. 2008. Guide to financial management. London: Profile Books Read More
Cite this document
  • APA
  • MLA
  • CHICAGO
(“Orange plc Financial Statement Coursework Example | Topics and Well Written Essays - 2000 words”, n.d.)
Orange plc Financial Statement Coursework Example | Topics and Well Written Essays - 2000 words. Retrieved from https://studentshare.org/finance-accounting/1694895-orange-plc-financial-statement
(Orange Plc Financial Statement Coursework Example | Topics and Well Written Essays - 2000 Words)
Orange Plc Financial Statement Coursework Example | Topics and Well Written Essays - 2000 Words. https://studentshare.org/finance-accounting/1694895-orange-plc-financial-statement.
“Orange Plc Financial Statement Coursework Example | Topics and Well Written Essays - 2000 Words”, n.d. https://studentshare.org/finance-accounting/1694895-orange-plc-financial-statement.
  • Cited: 0 times

CHECK THESE SAMPLES OF Gross Profit Margin of the Orange Company

Financial Statement Analysis - BAE Systems and Lockhead Martin

6 Net profit margin (NPM)= (Net profit/net sales)*100 5.... 8 Net profit margin (NPM)= (Net profit/net sales)*100 6.... 7 profit margin 5.... 7 gross profit Margins (GPM) = (Net gross profit / Net Sales) x 100 7.... 1 gross profit Margins (GPM) = (Net gross profit / Net Sales) x 100 67.... A systematic approach is brought through the calculated ratios where liquidity, solvency and profitability index are summarized and recommendation made on the best performing company....
7 Pages (1750 words) Research Paper

Changes in Net Profit Margin and Gross Profit Margin

xxxx @2013 Q1- Possible explanations for changes in net profit margin and gross profit margin Financial ratios are used in analyzing the performance of an entity and its trend over time.... The net profit margin and gross profit margin are used in analyzing the profitability of an entity.... The gross profit margin is calculated as gross profit as a percentage of sales.... According to Pamela and Frank (2010), an increase in gross profit margin from one period to another can be caused by one of the following factors: a) Increase in sales volume which in turn affect sales and the cost of sales b) Increase in sales price which affect sales revenue c) Reduction in the cost of production which affects cost of goods sold....
4 Pages (1000 words) Essay

C-V-P equation.Contribution margin

They can cut on their variable costs by having a look at the contribution margins of their company and their products.... ractice 16-3 Linearity of Variable Costs within the Relevant RangeThe company has assembled the following data about its variable costs:Level of ActivityTotal Variable Cost1,000 units$ 25,0002,000 units46,0003,000 units69,0004,000 units92,0005,000 units100,000The company is currently producing 3,300 units.... According to these data, what is the relevant range over which the company can assume that the variable cost per unit is constantIn this case, the...
5 Pages (1250 words) Essay

Accounting Ratio Analysis for Hysan Development Company Limited

First is the direct cost or called cost of sales or revenues is deducted first from revenues to arrive at gross profit.... From gross profit, operating income will be derived after deducting further selling and administrative expenses will be deducted to arrive at operating income.... After producing the various categories of income --- gross profit, operating income, and net income, each result can be related by dividing each by the total revenues to determine how the company is performing....
9 Pages (2250 words) Essay

Financial Ratios of Coca-Cola and PepsiCo

The analysis will then proceed to determine the better company for investment based on the analysis developed.... The storyline of the company started in May of 1886 and has since developed and established the company among the largest in the world presently.... According to the most current data, coca cola is the leading soft drinks company around the globe in terms of size and the subsequent market performance.... The company also enjoys one of the most valuable brands around the world....
6 Pages (1500 words) Assignment

Gross Profit Margin

Deeper analysis: A high fall in the profit margin of the years 2008-2009 was as a result of a drop in the operating income.... The paper "gross profit margin" is a wonderful example of a report on finance and accounting.... 8% Year 2010-2011 2009-2010 2008-2009 2007-2008 gross profit margin 0.... 8% gross profit margin is the difference between income and expenses (revenues and costs) before deducting other costs.... The paper "gross profit margin" is a wonderful example of a report on finance and accounting....
12 Pages (3000 words) Report

Liquidity and Profitability

The financial performances of the company over the last three years, 2012-2014 are studied with the focus being given to its profitability and liquidity performances.... The financial analyst of Walmart is done through the use of ratio analysis and the report is concluded by giving suitable recommendations to improve the financial performances of the company over the next few years.... Theoretical background According to the work of Ehrhardt and Brigham (2013), financial analysis or financial statement analysis is used to analyze the financial position of a company by considering its stability, viability, and profitability in the market (Ehrhardt and Brigham, 2013)....
15 Pages (3750 words) Research Paper

Financial Analysis of Arabtec Company

The paper "Financial Analysis of Arabtec company" is a reasonable example of a Finance & Accounting case study.... The paper "Financial Analysis of Arabtec company" is a reasonable example of a Finance & Accounting case study.... The paper "Financial Analysis of Arabtec company" is a reasonable example of a Finance & Accounting case study.... his report captures the analysis of Arabtec company's financial statements.... It entails the analysis of the company's income statement, balance sheet, and cash flow statement about the 2011 reporting period....
8 Pages (2000 words) Case Study
sponsored ads
We use cookies to create the best experience for you. Keep on browsing if you are OK with that, or find out how to manage cookies.
Contact Us