StudentShare
Contact Us
Sign In / Sign Up for FREE
Search
Go to advanced search...
Free

Gross Profit Margin - Report Example

Cite this document
Summary
The paper "Gross Profit Margin" describes that the operating cycle increased in 2011 due to the increase in due to opening of more branches in other parts of the world. This meant that there was an increase in raw materials, wages, and other expenditures…
Download full paper File format: .doc, available for editing
GRAB THE BEST PAPER97.3% of users find it useful
Gross Profit Margin
Read Text Preview

Extract of sample "Gross Profit Margin"

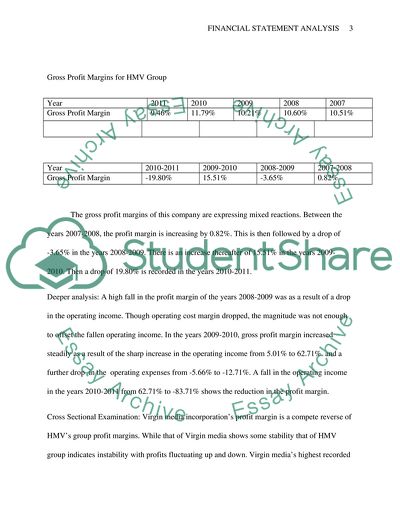
FINANCIAL MENT ANALYSIS Gross Profit Margin Virgin Media Inc. Year 2009 2008 2007 Gross ProfitMargin (GP/TO) 59.78% 59.36% 58.28% 56.39% 55.08% Year 2010-2011 2009-2010 2008-2009 2007-2008 Gross Profit Margin 0.70% 1.86% 3.35% 2.38% Gross profit margin is the difference between income and expenses (revenues and costs) before deducting other costs. The purpose of this margin is to examine the value of increase in sales hence acting as a guide in pricing and promotion decision. Virgin media incorporation’s gross profit margin is increasing over the years. The percentage change between the years of 2007 and 2011 is 4.7%. There is a high profit margin percentage between the years 2008 and 2009 which is followed with a decrease in percentage in the years after with 2010 registering 1.86% while 2011 recording only 0.70% increase. Deeper analysis: In the years 2008 – 2009, a reduction in operating expense margin explains the 3.35% increase. In the year 2009-2010, a decrease of about 1.86%, this is possibly due to increased operating expenses. All the four years are registering an increasing profit margin because the operating expenses are reducing from year to year with a gain in operating income. Gross Profit Margins for HMV Group Year 2011 2010 2009 2008 2007 Gross Profit Margin 9.46% 11.79% 10.21% 10.60% 10.51% Year 2010-2011 2009-2010 2008-2009 2007-2008 Gross Profit Margin -19.80% 15.51% -3.65% 0.82% The gross profit margins of this company are expressing mixed reactions. Between the years 2007-2008, the profit margin is increasing by 0.82%. This is then followed by a drop of -3.65% in the years 2008-2009. There is an increase thereafter of 15.51% in the years 2009-2010. Then a drop of 19.80% is recorded in the years 2010-2011. Deeper analysis: A high fall in the profit margin of the years 2008-2009 was as a result of a drop in the operating income. Though operating cost margin dropped, the magnitude was not enough to offset the fallen operating income. In the years 2009-2010, gross profit margin increased steadily as a result of the sharp increase in the operating income from 5.01% to 62.71% and a further drop in the operating expenses from -5.66% to -12.71%. A fall in the operating income in the years 2010-2011 from 62.71% to -83.71% shows the reduction in the profit margin. Cross Sectional Examination: Virgin media incorporation’s profit margin is a compete reverse of HMV’s group profit margins. While that of Virgin media shows some stability that of HMV group indicates instability with profits fluctuating up and down. Virgin media’s highest recorded gross profit margin ever recorded is 59.78% while that of HMV group is 11.79%. The lowest recorded gross profit margin in Virgin media is 55.08% while that of HMV group is -19.80%. This shows that the two firms are operating at different playing grounds. Operating Expense Margin Operating expenses are costs incurred in the course of running a business. Thus operating expenses margin is the ratio between accumulated operating expenses and the gross income of a company. It is used to show management’s performance. Virgin Media Inc. Operating Expense Margin Year 2011 2010 2009 2008 2007 Operating Expense Margin 46.03% 49.69% 53.44% 53.39% 53.97% Year 2010-2011 2009-2010 2008-2009 2007-2008 Operating Expense Margin -7.36% -7.02% 0.09% -1.06% The operating expenses have been fluctuating to a maximum of 0.09% and to a minimum of -7.36% for the five year period from 2007-2011. Deeper analysis: Operating expenses increased in the year 2008-2009 by 0.09% because of the reduction in the operating income. The steady reduction in the operating expenses between the years 2008-2011 may be attributes to a continuous increase in operating income of the company. HMV Group. Operating expense margin Year 2011 2010 2009 2008 2007 Operating Expense margin 6.99% 5.96% 6.82% 7.23% 7.53% Year 2010-2011 2009-2010 2008-2009 2007-2008 Operating Expense Margin 17.37% -12.71% -5.66% -3.90% The operating expenses have been reducing from the year 2007 to the year 2010 from -3.90% to 12.71%. This is followed by an increase in the year 2011 from -12.71% to 17.37%. Deeper analysis: the operating expenses have been reducing as a result of the increasing operating income from the 2007 to the year 2010. A reduction in the operating income in the year 2011 from 62.71% to -83.71% explains the increase in the operating costs from -12.71% to 17.37%. In this company the operating costs are inversely proportional to operating income. Cross Sectional: Virgin media incorporation operating expenses margin is more than that of HMV group from the years 2007-2011. in both companies the operating expense margins have fluctuated with HMV group registering the highest rate of fluctuation for example in 2009-2010, Virgin operating expenses reduced by 7% while HMV operating expenses reduced by almost 12%. For Virgin media operating expenses have been reducing from the year 2009 whereas HMV its operating expenses have been reducing but started picking up in the year 2011 with about 17% increase. Operating Income Margin Operating income is the income left all operating costs has been settled. Operating income margin is useful to a business as it helps in gauging its health or performance. Virgin media incorporation Year 2011 2010 2009 2008 2007 Operating Income Margin (OI/TO) 10.84% 3.93% 2.24% -10.63% 0.39% Year 2010-2011 2009-2010 2008-2009 2007-2008 Operating Income margin 176.04% 75.46% -121.06% ##### The operating income margin has been increasing gradually from -121.06% to 176.04% between the years 2009 and 2011. Deeper analysis: in the year 2008 the operating income expenses reduced to about -121% and this may be attributed to the increase in operating expenses which rose from -1.06% to 0.09%. Between the years 2009-2011, there was a sharp increase in the operating income shooting from a low of -121.06% to a maximum of 176.04%. HMV Group Operating Income Margin Year 2011 2010 2009 2008 2007 Operating Income Margin (OI/TO) 0.91% 5.60% 3.44% 3.28% 1.64% Year 2010-2011 2009-2010 2008-2009 2007-2008 Operating Income Margin -83.71% 62.71% 5.01% 99.51% The operating expenses margin has been fluctuating from a minimum of -83.71% in 2010-2011 to a maximum of 99.51%. Deeper analysis: In the years 2010-2011 there was a decrease of about -83.71% in the operating income which may be explained by the rising operating expenses in the same period. Cross sectional: Virgin media has more operating income than HMV group from 2008 to 2011. The operating income of Virgin media has been gradually increasing unlike that of HMV group which has been fluctuating. Asset Turnover This is a ratio that is used to measure or determine how well a company uses its assets to generate revenue or income. To get this ratio sales are divided by net operating assets. Virgin Media Incorporation Asset Turnover Year 2011 2010 2009 2008 2007 Asset Turnover TO/NOA 0.616 0.532 0.491 0.471 0.482 Year 2010-2011 2009-2010 2008-2009 2007-2008 Asset Turnover 15.69% 8.39% 4.21% -2.32% The asset turnover ratio has been increasing steadily from a low of -2.32% in the years 2007-2008 to a high of 15.69% in the years 2010-2011. The highest increase was 15.69% in the years 2010-2011. Deeper analysis: a gradual increase in the operating income from -121.06% to 176.04% clearly explains the steadily increasing asset turnover. HMV group asset turnover Year 2011 2010 2009 2008 2007 Asset Turnover (TO/NOA) 8.520 6.573 12.447 19.882 8.644 Year 2010-2011 2009-2010 2008-2009 2007-2008 Asset Turnover 29.62% -47.19% -37.40% 130.00% The asset turnover ratio has been fluctuating with a minimum of -47.19% and a maximum of 130.00%. 2008-2009 recorded the highest fluctuation dropping from 130% to -37.40% this is then followed by the sharp rise from -47.19% to 29.62%. Deeper analysis: the changes in the percentages are affected by the operating income margins. Higher operating income is an indication that there is a high asset turnover. Cross sectional: HMV group’s asset turnover is more than ten times that of Virgin media incorporation’s, for example, in the year 2011 HMV group’s was 8.520 times while Virgin’s was 0.616% times. The asset turnover in Virgin is on gradual increase whereas in HMV group the turnover is not steady if is fluctuating. Tax Margin This shows the tax accruals in relation to the company’s total revenue. Tax is based on the income of the company, the higher the income the higher the taxes payable. Virgin media incorporation tax margin Year 2011 2010 2009 2008 2007 Tax margin tax on OI/TO 0.023 0.015 0.000 -0.001 0.000 Year 2010-2011 2009-2010 2008-2009 2007-2008 Tax margin 51.57% 9971.46% -118.46% 3927.51% Tax margins over the five years are displaying mixed reactions. For example in the years 2009-2010 the tax percentage is extremely high with 9971.46% while in 2008-2009 the percentages are extremely low with -118.46%. The tax margins are fluctuating over time. Deeper analysis: the tax margins are changing over time with a very large difference. This difference may be linked with the drastic changes in operating income percentages. In 2009 there were no tax margins as the percentages remained low but from here a slight increase changes the tax margin percentages with great figures. 2009-2010 recorded the highest percentages in tax margin. HMV group tax margins Year 2011 2010 2009 2008 2007 Tax margin tax on OI/TO 0.015 0.016 0.010 0.009 0.004 Year 2010-2011 2009-2010 2008-2009 2007-2008 Tax margin -8.90% 67.47% 3.96% 134.37% The tax margins are fluctuating with the highest being 134.37% and the lowest as -8.90%. Deeper analysis: from the tables it can be observed that tax effect is highly volatile as any small change affect it percentages at a larger value. Operating income is also playing a part in the tax values as tax depends on the income. Cross sectional: in both companies tax margin is fluctuating. Virgin media displays a high fluctuation rate as compared to HMV group. Operating income is affecting tax margins in both companies. Net Burrowing Costs Virgin Media Inc. This refers to the net financial expenses divided by the net financial obligation. The company can only qualify to have financial obligation if the financial liabilities are more than the financial assets. year 2011 2010 2009 2008 2007 Net burrowing cost NFE/NFO -0.048 -0.047 -0.075 -0.078 -0.088 year 2010-2011 2009-2010 2008-2009 2007-2008 Net burrowing cost 1.32% -36.38% -4.60% -11.30% Analysis: there has been increasing net burrowing cost. 2011 had the minimum while 2007 had the highest. Deeper analysis: there has been rise in net burrowing due to increase in the net financial obligation. HMV group Year 2011 2010 2009 2008 2007 Net burrowing cost NFE/NFO 0.022 -0.036 -0.079 -0.192 -0.033 Year 2010-2011 2009-2010 2008-2009 2007-2008 Net burrowing cost -161.02% -53.99% -58.97% 484.50% Analysis: there has been an increase in net burrowing cost from 2007 to 2011. Deeper analysis: there is an increase due to the relative increase in the net financial obligation. Cross-section: the net burrowing cost for HMV is more than that of Virgin Media. This is due to the increase in financial liabilities in HMV as compared to that of Virgin Media. Capitalization Virgin media Inc Year 2011 2010 2009 2008 2007 Capitalization(NOA/Common Shareholder Equity) 10.149 5.760 5.005 3.977 3.006 Year 2010-2011 2009-2010 2008-2009 2007-2008 capitalization 76.20% 15.09% 25.85% 32.31% Refers to stock price, which is multiplied by the number of the company’s outstanding shares. This actually represents the real price one could have purchased the whole company. This is just an estimate but the purchasing of the company can distort the whole market price. Thus, stocks are usually divided into classes while basing on their capitalization. The smallest companies usually have a market capitalization of between $0.5 -$2.0 billion. Furthermore, capitalization can also refer to sum total of the corporation’s stock and the long term debt together with the retained earnings. Analysis The market capitalization has been steadily increasing over the years. The highest capitalization was registered between 2010 to 2011. It registered an increase of 76%. On the other hand, the company registered the lowest capitalization between 2009 to 2010. Deeper analysis: the company registered the highest capitalization in 2011 due to the increased accumulation of long term debt. Furthermore, the corporate stock might have increased over the years up to some substantial amounts. On the other hand the decrease in market capitalization of the company might have as a result of achieving a low operating asset of $7.9 billion. HMV group Year 2011 2010 2009 2008 2007 Capitalization (NOA/Common shareholder Equity) -2.389 1.961 1.578 1.604 -14.765 Year 2010-2011 2009-2010 2008-2009 2007-2008 capitalization -221.86% 24.23% -1.59% -110.86% The market capitalization has been showing unpredictable trends. The corporate recorded a negative capitalization of -110.86% in between 2007-2008. It now recorded the highest percentage of capitalization of -221.86% between 2010-2011. Despite this, the corporate registered a positive capitalization of $1.961 in 2010. Deeper analysis: the corporate had the highest positive capitalization $-2.389 million dollars. This is due to the low achieved operating liability of $386.60. in addition, it registered the lowest revenue. Cross-sectional: the current market capitalization of Virgin media is higher as compared to HMV Group. Virgin Media registered a capitalization of $10.495 in 2011 while HMV registered a negative capitalization of $-2.389 in the same year. The highest capitalization of HMV was recorded in 2010 at $1.961. Financial Leverage Virgin Media Inc Year 2011 2010 2009 2008 2007 Financial Leverage NFO/CSE -9.149 -4.760 -4.005 -2.977 -2.006 Year 2010-2011 2009-2010 2008-2009 2007-2008 Financial leverage 92.21% 18.86% 34.54% 48.41% Refers to the degree at which the business or investors utilize the borrowed money. It is the actual measure of the ratio of the total debt to the ratio of the total assets. Therefore, financial leverage is directly proportional to the amount of debt. Analysis: the corporate registered a negative financial leverage across all the years. It recorded the highest level in 2011 while the lowest was recorded in 2007. Deeper analysis: the corporate acquire the highest achievable leverage in 2011 due to underutilization of the debt. In 2007, the corporate underutilized the operating asset at $7, 929.30 while in 2007, it recorded $10, 144.70. the trend has been decreasing due to reluctance to maximize the operations on the total assets. The trend is falling as the company does rely on loans for its operations. Inventory Days This is the number of days or the period the company holds or stores its inventory/ products before selling them. Virgin Media Inc Year 2011 2010 2009 2008 2007 Inventory days INVx365/COS 2.978 6.118 3.080 17.972 15.039 Year 2010-2011 2009-2010 2008-2009 2007-2008 Inventory days -51.32% 98.64% -82.86% 19.50% The inventory days are fluctuating from a high of 98.64% to a low of -82.86%. Deeper analysis: 2008-2009 recorded the highest inventory days with -82.86% and this can be supported with the least income in the same period. HMV group Year 2011 2010 2009 2008 2007 Inventory days INV x 365/ COS 37.222 80.042 44.438 44.727 50.936 Year 2010-2011 2009-2010 2008-2009 2008-2007 Inventory days -53.50% 80.12% -0.65% -12.19% The trend has been reducing from the high of 80.042% to -12.19%. Deeper analysis: the corporate recorded inventory days of 80.042 in 2010 due to a least income this was recorded in the same year. It registered the lowest inventory days of 37.222 in 2011 due to the increase in the income of the corporate. Cross sectional: virgin company recorded the highest inventory record as compared to HMV Company which had a lower inventory record. This therefore means that virgin company recorded a lower income as compared to HMV Company. Receivable Days Virgin Media Inc This is the average time the company’s customers take to complete paying or purchasing an equal account receivable. This is divided by the annual sales made on credit times 365. Year 2011 2010 2009 2008 2007 Receivable days Rec x 365/Revenue 39.812 40.608 40.157 43.905 40.821 Year 2010-2011 2009-2010 2008-2009 2007-2008 Receivable days -1.96% 1.12% -8.54% 7.55% The customers of this company have been unpredictable as they have been paying on time and delaying in some years. Analysis: the customers took the longest time to pay for the debt. In 2008, they registered the highest number of days before settling the bills. In 2011, the customers improved in reliability as they recorded a lower number of days before complete repayment of the debt. Deeper analysis: the company recorded the lowest net operating asset while in 2008, it acquired the largest. The change in the time frame might have been due to change of corporate policies. The corporate may also have done away with unreliable customers. HMV Group Year 2011 2010 2009 2008 2007 Receivable days Rec x 365/Revenue 8.917 9.089 4.999 3.777 5.524 Year 2010-2011 2009-2010 2008-2009 2008-2007 Receivable days -1.89% 81.80% 32.37% -31.64% The trend has been unpredictable. Analysis: the corporate recorded the highest percentage between 2008 to 2009 of 81.80%.on the other hand, in 2011, the customers recorded the lowest receivable days. Deeper analysis: the customers were reliable in 2008 due to the increased annual sales of the corporate. In 2011, increase in the annual sale increased the receivable days. This meant that the corporate had a higher credit in 2011. Cross-section: there were higher receivable days with Virgin Media as compared to HMV corporate. This means that HMV had a higher gain while Virgin relied on the money out of reach. Payable Days Virgin Media Inc This refers to the average time that the company takes to pay all the vendors. It is equal to the accounts payable divided by the annual credit purchase times 365. Year 2011 2010 2009 2008 2007 Payable days Payx365/COS 69.199 68.574 74.614 82.103 74.376 Year 2010-2011 2009-2010 2008-2009 2007-2008 Payable days 0.91% -8.10% -9.12% 10.39% The time the company takes to pay its vendors has been reducing all along. Analysis: the company registered the highest payable days in 2008 of 82.103 while the lowest was registered in 2011 at 69.199. Deeper analysis: in 2008 the corporate took a very long tome to pay the vendors due to the highest number of sales made during the year. In 2011, the company had little credit thus was able to clear the vendors quickly. HMV group Year 2011 2010 2009 2008 2007 Payable daysPayx365/COS 32.560 82.529 48.967 51.651 57.956 Year 2010-2011 2009-2010 2008-2009 2007-2008 Payable days -60.55% 68.54% -5.20% -10.88% The trend has been unpredictable in clearing all the vendors their dues. Analysis: the company registered the highest payable days in 2010 while the lowest was registered in 2011. Deeper analysis: the corporate had little outstanding payments like clearing of loans in 2011 while in 2010; the corporate may have managed to make little payable accounts. Cross-section: virgin media registered a higher payable days due to overreliance on debts and loans while HMV does not depend on loans for its operations. Cash Operating Cycle Virgin Media Inc Refers to the time duration between the outflow of materials, wages and other expenditures of a company and the inflow cash made from the sale of the goods. This is a true reflection of the investment of the company’s working capital. Thus, the lower the investment, the faster the cycle. Furthermore, investment increases from raw materials. Year 2011 2010 2009 2008 2007 Cash operating cycle Invdays+Recdays-Paydays 26.409 -21.848 -31.377 -20.227 -18.516 Year 2010-2011 2009-2010 2008-2009 2007-2008 Cash operating cycle 20.88% -30.37% 55.13% 9.24% The cash operating cycle has been decreasing. Analysis: in 2011, the corporate registered a higher cash operating cycle while in 2007, the duration was negative. The company may have poor strategized the market sales leading to lower investment during the year. Deeper analysis: the operating cycle increased in 2011 due to the increase in due to opening of more branches in other parts of the world. This meant that there was increase in raw materials , wages and the other expenditures. In 2007, the company invested more due to increase in raw materials for the corporate. HMV Group Year 2011 2010 2009 2008 2007 Cash operating cycle Invdays+Recdays-Paydays 13.579 6.602 0.470 -3.148 -1.496 Year 2010-2011 2009-2010 2008-2009 2007-2008 Cash operating cycle 105.69% 1303.88% -114.94% 110.39% There is a reducing cash operating cycle. Analysis: the corporate increased along the years with 2011 registering a high level of $13.579 while 2008 recording -3.148. Deeper analysis: the corporate recorded a an increasing cash operating cycle due to increase in prices of raw materials and increased number of staff. Cross-section: from the data, HMV invested at a lower rate than Virgin Company. Reference Accounting for management, (n.d), Financial Statement Analysis, viewed April 22 2012, http://www.accountingformanagement.com/accounting_ratios.htm Read More
Cite this document
  • APA
  • MLA
  • CHICAGO
(Financial Statement Analysis Term Paper Example | Topics and Well Written Essays - 4250 words, n.d.)
Financial Statement Analysis Term Paper Example | Topics and Well Written Essays - 4250 words. https://studentshare.org/finance-accounting/1772839-financial-statement-analysis
(Financial Statement Analysis Term Paper Example | Topics and Well Written Essays - 4250 Words)
Financial Statement Analysis Term Paper Example | Topics and Well Written Essays - 4250 Words. https://studentshare.org/finance-accounting/1772839-financial-statement-analysis.
“Financial Statement Analysis Term Paper Example | Topics and Well Written Essays - 4250 Words”. https://studentshare.org/finance-accounting/1772839-financial-statement-analysis.
  • Cited: 0 times

CHECK THESE SAMPLES OF Gross Profit Margin

Financial Statement Analysis Report

The preparation of Financial Statement Analysis requires financial ratios, accounting data from financial statements.... According to the reading of Pamela Peterson Drake financial analysis is the name given to the progression of selecting, evaluating and explaining to assist in investment and financial management.... Financial analysis can be used internally to appraise issues such as effectiveness of employees, operations and credit procedures....
4 Pages (1000 words) Assignment

Financial Statement Analysis: Alcatel-Lucent

The research will be focusing on a few areas of the financial statements in the analysis of this company we.... The analysis of the company is described in detail here.... The paper tells that the analysis of a company's financial data reflects the company's performance.... The analysis can be carried out in relation to the past years' performance of a company or in relation to the performance of other companies in the same industry....
7 Pages (1750 words) Research Paper

Financial Statement Analysis and Valuation

This essay "Financial Statement Analysis and Valuation" presents British Petroleum Company as a British energy group delivering premium energy products and services around the world.... BP features a diverse energy portfolio producing natural resources for more than 80 countries across the globe....
10 Pages (2500 words) Essay

Google - Financial Statement Analysis

The company is a leader and innovator in both internet searches along with web advertising.... Web advertising is the primary method.... ... ... the company can generate revenue with the Google Adsense and Adwords program being designed to give companies a way to provide tailored advertising to their viewers (Edgaronline, 2010). ...
5 Pages (1250 words) Research Paper

Practical Financial Statement Analysis

This assignment "Practical Financial Statement Analysis" discusses a corporate strategy that seems to be serving the group well when considering internal criteria as it has in-depth knowledge about these markets and has a long-standing relationship with customers in these regions.... The financial period disparity may distort the effectiveness of ratio analysis and may therefore lead to unreliable conclusions.... Comparative ratio analysis2 is effective if the financial statements of the organizations being assessed are of the same financial period....
10 Pages (2500 words) Assignment

Financial Statement Analysis and Valuation

ppendix B: 2013 Income statement GKN (Annual Report: GKN, 2013).... ppendix C: 2013 GKN statement of Cash Flow(Annual Report: GKN, 2013).... Overall the financial performance of the company revealed good profitability, efficiency, and liquidity.... The four major divisions of the company are GKN Aerospace, GKN Driveline, GKN Powder Metallurgy, and GKN Land Systems (Gkn, 2015)....
2 Pages (500 words) Assignment

Financial Statement Analysis - Ardent Leisure

The paper "Financial Statement Analysis - Ardent Leisure " is a perfect example of a finance and accounting case study.... The paper "Financial Statement Analysis - Ardent Leisure " is a perfect example of a finance and accounting case study.... The paper "Financial Statement Analysis - Ardent Leisure " is a perfect example of a finance and accounting case study....
7 Pages (1750 words) Case Study

Bellamys Australia - Financial Statement Analysis

The paper "Bellamy's Australia - Financial Statement Analysis" is a great example of a finance and accounting assignment.... The paper "Bellamy's Australia - Financial Statement Analysis" is a great example of a finance and accounting assignment.... The paper "Bellamy's Australia - Financial Statement Analysis" is a great example of a finance and accounting assignment....
12 Pages (3000 words) Assignment
sponsored ads
We use cookies to create the best experience for you. Keep on browsing if you are OK with that, or find out how to manage cookies.
Contact Us