StudentShare
Contact Us
Sign In / Sign Up for FREE
Search
Go to advanced search...
Free

Financial Statements of Fletcher Furniture Mart - Case Study Example

Cite this document
Summary
The present case study "Financial Statements of Fletcher Furniture Mart" touches upon FFM that is a sole trader business that retails householder furniture to the public. This company has been in business operations for the past many years and has contributed a remarkable value in the retail industry…
Download full paper File format: .doc, available for editing
GRAB THE BEST PAPER98.2% of users find it useful
Financial Statements of Fletcher Furniture Mart
Read Text Preview

Extract of sample "Financial Statements of Fletcher Furniture Mart"

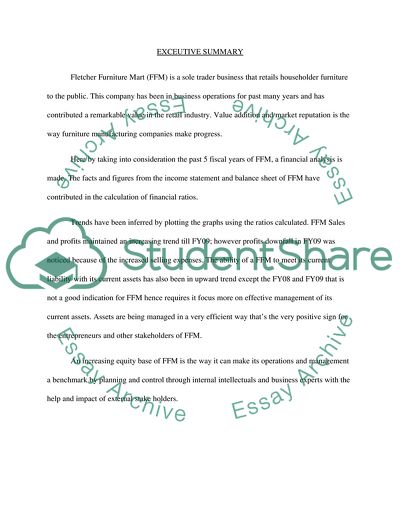
 Financial Statements of Fletcher Furniture Mart EXCEUTIVE SUMMARY Fletcher Furniture Mart (FFM) is a sole trader business that retails householder furniture to the public. This company has been in business operations for past many years and has contributed a remarkable value in the retail industry. Value addition and market reputation is the way furniture manufacturing companies make progress. Here by taking into consideration the past 5 fiscal years of FFM, a financial analysis is made. The facts and figures from the income statement and balance sheet of FFM have contributed in the calculation of financial ratios. Trends have been inferred by plotting the graphs using the ratios calculated. FFM Sales and profits maintained an increasing trend till FY09; however profits downfall in FY09 was noticed because of the increased selling expenses. The ability of a FFM to meet its current liability with its current assets has also been in upward trend except the FY08 and FY09 that is not a good indication for FFM hence requires it focus more on effective management of its current assets. Assets are being managed in a very efficient way that’s the very positive sign for the entrepreneurs and other stakeholders of FFM. An increasing equity base of FFM is the way it can make its operations and management a benchmark by planning and control through internal intellectuals and business experts with the help and impact of external stake holders. COMPANY ANALYSIS Sales: The total sales of FFM maintained an increasing trend till FY09. FY09 turned out to be the best period for FFM as this year resulted in achievement of business sales at its peak value. However, FY 2010 brought a decline in sales value that left substantial impact on company’s profits in year 2010. Profitability: Selling expenses increased immensely in FY09 that made a big impact on FFM’s operating profit. This rising cost greatly hampered the profitability of the company and hence resulted in sudden decline of profit from operations to $2,000 as compared to the last year recorded profit of $152,000. Also, the finance costs increased substantially by 103.63% as interest rates rose might be in result of tight monetary policy or liquidity crunch in the market. That resulted in reduced profit from operations in FY09. Gross Profit tends to rise till FY09 and declined in FY10 with the simultaneous rising and declining trend in sales respectively. Liquidity: Current ratio has been showing a random movement throughout the years. Current ratio indicates the ability of a company to meet its current liability with its current assets. Since in 2008 and then again in 2010 this ratio has declined relative to the respective previous years this means that this is not a good indication for FFM and should focus more on its effective management of its current assets. After FY07, the declining investments make a negative mark for FFM in the market. The sudden downfall in company investments ended up in lower current ratio. While in FY10 the decline was noticed because of the reduced receivables that might be the impact of reduced credit sales. Thus, decrease in current assets and a corresponding increase in current liabilities resulted in a less favorable liquidity position. Efficiency Ratios Total Asset Turnover Ratio: Total asset turnover has been increasing since FY06 because the management of the company's assets has been effective in generating higher sales revenue. However, receivable turnover and inventory turnover tend to decline after FY08. FINANCIAL GEARING Long Term Debt to Equity: The long term debt to equity marked a record increase in the year 2009 as compared to the other years. The long term debt to equity increased because of a decline in the equity base due to company profits. However in the years 2008 and 2010 it has declined. The debt management ratios of FFM showed a positive trend during FY09. The debt to asset and equity ratios as well as the long-term debt ratio all receded during the period of FY08 which reflected a reduction in the company's dependence on debt financing. However, during FY09 the debt ratios of the company rose because the total debt increased in FY09 mainly due to a 46.4% increase in the current liabilities which form 57.9% of the total debt. Pros & Cons of buying FFM: The decision to go for purchasing a manufacturing business is a tricky job to handle. FFM is a find out to be one of good options for an entrepreneur to invest his savings and money. This decision would be favor if FFM qualify for the following 3 factors for purchasing a business i.e. 1. Lower Risk, 2. Management Training and 3. Lower Asset Costs This company has a very well balanced efficiency background as the asset management is getting more valued and efficient gradually since last 5 years. Sales growth also tends to make a healthy signal for an entrepreneur along the high profit proportions making up rising equity base. Besides all the prospects this purchase of manufacturing business will bring along serious competitive issues. The market is saturated with similar-type ventures, and the cost of the furniture items has become very price-competitive. There are just too many businesses chasing after the same consumer dollar. It is cutthroat manufacturing industry where it is difficult to enter into the marketplace. CONCLUSION In this report I made a deep financial analysis of the Fletcher Furniture Mart. In this analysis I sort the main reasons of the declining profit of Mart. As we all know that profit is directly proportion to sale. If sales goes up the profit will go up and vice versa. As it is shown above that sales shows the upward trend in past years, but in FY09 the sale decreases dramatically. There are two main reasons behind it; 1. Increase in selling expenses and the 2. Increase in financial costs. This is also the reason of declining of sale. Because due to increase of these two costs the selling price goes up. Once you increase the selling price your sale will start decreasing because there are alternatives in market. So there is possibility that you will lose your customers. Same case happens with this mart, the interest rate and selling cost goes up rapidly so they increase their selling price that results in decrease in sale and profit too. One thing is also notable here that there is not a huge decline in sales but still the profit is low, the main reason was that there is increase in the financial costs of mart, if you look on the profit analysis you will notice one thing that your gross profit is higher than the operating profit. It means the increase in selling costs does not have a big impact on profit of FFM; it is in fact the financial cost that disturbs profit adversely. In the ratio analysis it is also analyzed that the credit sale of firm also decreases, in result the receivables also decreases in current year. It does not mean that you received the money from receivables; it shows that there is a decrease in the new receivables. RECOMMENDATIONS After having a deep analysis I’ve made some suggestions for the Fletcher Furniture Mart. First of all the management should try to decrease the selling expenses of firm. This act will boost up your sale with a small proportion as it reduces the selling price of product, and the profit of firm also goes up. Secondly, the company should try to encash their receivables and should also make a balance between maturity date of the payment made to vendors and the maturity date of receivables. This act will result in the higher market reputation of FF Mart because when you will provide the money to your supplier at right time you will develop trust and strong relation with them. What will happen next, due to your good reputation you will be more eligible to get new stocks on credit. Hence financial loans will be of limited or no need and in result low financial cost of FFM. APPENDICES Balance Sheet: ASSETS 2006 2007 2008 2009 2010 NON-CURRENT ASSETS           Plant and equipment 1,288,000 1,311,000 1,298,000 1,796,000 1,591,000 Computers 259,000 121,000 78,000 43,000 22,000 TOTAL NON-CURRENT ASSETS 1,547,000 1,432,000 1,376,000 1,839,000 1,613,000 CURRENT ASSETS           Inventory 888,000 725,000 958,000 1,261,000 980,000 Prepayments 59,000 71,000 82,000 174,000 64,000 Investments 15,082,582 16,933,790 8,543,763 2,769,134 1,386,816 Accounts Receivables 630,000 766,000 939,000 1,190,000 896,000 Cash 48,000 90,000 90,000 184,000 319,000 TOTAL CURRENT ASSETS 16,707,582 18,585,790 10,612,763 5,578,134 3,645,816 TOTAL ASSETS 18,254,582 20,017,790 11,988,763 7,417,134 5,258,816 LIABILITIES           Long term Loans 792,000 930,000 834,000 1,713,000 1,347,000 TOTAL NON-CURRENT LIABILITIES 792,000 930,000 834,000 1,713,000 1,347,000 Accounts Payables 1,370,336 1,027,274 1,747,626 306048 493,968 Short term Loan 7,597,020 3,942,972 2,613,695 960,620 1,360,677 TOTAL CURRRENT LIABILITIES 8,967,356 4,970,246 4,361,321 1,266,668 1,854,645 TOTAL LIABILITIES 9,759,356 5,900,246 5,195,321 2,979,668 3,201,645 EQUITY           CAPITAL AND RESERVES           Capital at beginning 1,377,000 1,387,000 1,488,000 1,619,000 1,575,000 Additional Capital -  -  25,000 -  -  Add: Net Profit 20,000 147,060 152,000 2,000 6,000   1,397,000 1,534,060 1,665,000 1,621,000 1,581,000 Less: Drawings 10,000 46,060 46,000 46,000 44,000 TOTAL EQUITY 1,387,000 1,488,000 1,619,000 1,575,000 1,537,000 TOTAL LIABILITIES AND EQUITY 11,146,356 7,388,246 6,814,321 4,554,668 4,738,645 Income Statement:   2006 2007 2008 2009 2010   (in $) (in $) (in $) (in $) (in $) Sales - net 4,639,000 5,850,000 7,184,000 8,282,000 6,207,000 Less: Cost of sales 3,842,000 4,899,000 6,084,000 7,148,000 5,115,000 Gross profit 797,000 951,000 1,100,000 1,134,000 1,092,000 Less: Administrative expenses 481,000 442,000 503,000 555,000 509,000 Less: Selling and distribution expenses 240,000 309,940 384,000 522,000 465,000 Less: Interest expenses 56,000 52,000 61,000 55,000 112,000 Total Operating Expense 777,000 803,940 948,000 1,132,000 1,086,000 Profit from operations 20,000 147,060 152,000 2,000 6,000 Ratio Calculations: Category Formula 2006 2007 2008 2009 2010 Liquidity Ratios:             Cash Ratio Cash/current liabilities 0.00535275 0.01810776 0.02063595 0.145263 0.17200057 current Ratio current assets/current liabilities 1.86315587 3.73941048 2.433382684 4.40378536 1.96577566 Acid Test Ratio current assets-inventory/current liabilities 1.76413003 3.59354245 2.213724466 3.4082601 1.43737265 Working capital current assets - current liabilities 7,740,226 13,615,544 6,251,442 4,311,466 1,791,171 Efficiency Ratios:             Total Asset Turnover sales/total assets 0.25412798 0.29224005 0.599227794 1.1166038 1.1803037 Fixed Asset Turnover sales/Net tangible fixed assets 2.99870718 4.08519553 5.220930233 4.50353453 3.84810911 Current Asset Turnover sales/Net current assets 0.27765837 0.3147566 0.676920798 1.4847259 1.70249952 Stock Turnover sales/inventories 5.2240991 8.06896552 7.498956159 6.56780333 6.33367347 Average Inventory Age 360/inventory turnover 68.9114033 44.6153846 48.00668151 54.8128471 56.8390527 Receivable Turnover annual sales/Receivables 7.36349206 7.63707572 7.650692226 6.95966387 6.92745536 Average Receivable Age 360/receivable turnover 48.8898469 47.1384615 47.0545657 51.7266361 51.9671339 Accounts Payable Turnover CGS/average payables 2.80369194 4.76893214 3.481294053 23.3558135 10.3549218 Average Payable Period 360/Accounts Payable turnover 128.402124 75.4885977 103.4098225 15.4137213 34.7660762 Financial Gearing Ratio:             Debt to total Equity LTD/equity 0.57101658 0.625 0.515132798 1.08761905 0.87638256 Long Term Debt To Equity LTD/equity + LTD 0.36346948 0.38461538 0.339991847 0.5209854 0.46705964 Profitability Ratios:             Gross Profit Margin G/P/sales 17.18% 16.26% 15.31% 13.69% 17.59% Operating Profit Margin O/P/sales 0.43% 2.51% 2.12% 0.02% 0.10% REFERENCES Kuhlemeyer, Gregory A. 2001. Financial Statement Analysis. (In Kuhlemeyer, Gregory A. (ed.11). Fundamentals of Financial Management. Prentice Hall. Read More
Cite this document
  • APA
  • MLA
  • CHICAGO
(Financial Statements of Fletcher Furniture Mart Case Study, n.d.)
Financial Statements of Fletcher Furniture Mart Case Study. Retrieved from https://studentshare.org/finance-accounting/1744314-accounting-and-financial-management
(Financial Statements of Fletcher Furniture Mart Case Study)
Financial Statements of Fletcher Furniture Mart Case Study. https://studentshare.org/finance-accounting/1744314-accounting-and-financial-management.
“Financial Statements of Fletcher Furniture Mart Case Study”, n.d. https://studentshare.org/finance-accounting/1744314-accounting-and-financial-management.
  • Cited: 0 times

CHECK THESE SAMPLES OF Financial Statements of Fletcher Furniture Mart

Crime Scene Investigations and Death Investigations

Contemporary Issues in Law Enforcement: Crime Scene Investigations and Death Investigations Abstract This research paper attempts to review the procedures that occur in murder crime scenes, including those that also have electronic crimes connected with the case.... hellip; The review will show the basic steps within the regular procedure of securing the scene and then beginning the process of investigating the crime and crime scene....
52 Pages (13000 words) Research Paper

Financial statements

The financial statements of a company are a set of reports that provide information about the financial condition of a company.... The four major financial statements are the income statement, balance sheet, statement of cash flow and the statement of retained earnings.... The double entry system of credits and debits created by Luca Pacioli in 1494 is still used today to generate the information needed to prepare financial statements (Smith, 2008)....
3 Pages (750 words) Essay

Retail Marketing at NEXT

The Next has a wide product range catering choices for fashion conscious men and women who expect style, quality and value in everything from the clothes they wear to the furniture in their homes. ... hellip; Necessary financial Reports have been also attached in the appendix to give the reader and idea about the growth and prosperity of NEXT's business. ... NEXT operates through five divisions: NEXT Retail operates the high street shops through more than 330 stores covering the UK and Ireland; NEXT Directory is the mail order division which also contain the e-commerce platform; NEXT Overseas operates retail outlets in the United States, Asia, Continental Europe, and the Middle East through franchise agreements; Ventura runs the financial services division....
13 Pages (3250 words) Case Study

Features Management in the Wider Environment

Its main product lines include garments, foodstuff, household goods, hospitality, furniture, apparatus, beauty, banking and energy products (Marks & Spencer, 2009).... om describes it in financial terms as the ‘interdependence of buyers and sellers of financial instruments in financial centres around the world....
14 Pages (3500 words) Essay

Digitizing the Physical World - Hoe organizations can benefit from digitization

.... 2.... The Physical World in Organizations: Before and After Digitization…….... ??…….... ... 2.... Materials, Technologies and… .... ... ... ... ... ... ... ... ... ... ... ... ... ... ... ... 2 ... ... he physical world is witnessing itself copied and even built upon by a ubiquitous digital world....
50 Pages (12500 words) Thesis

Cellular pathology

The laboratory department at the hospital analyzed both slides prepared from tissues and cells derived from body fluids (Hanon-fletcher & Maxwell 43).... Cellular pathology is the way to go as it gives the most accurate results with very few cases of misdiagnosis reported in its adoption (Hanon-fletcher & Maxwell et al 60).... ork CitedHannon-fletcher, Mary and Perry, Maxwell....
2 Pages (500 words) Personal Statement

The Partnership Between Mr Walker and Mr Melham: Six Issues to be Determined by the Court

The paper describes the status of the land as an asset with respect to the partnership.... The Court had to decide on how an account should be taken, given that Mr Walker mortgaged his interest in the land and the very same interest was purchased by Mr Melham.... hellip; According to Justice White, Mr Walker and Mr Melham had entered into a partnership for an undefined term that could be dissolved by either partner giving notice to the other of his intention to dissolve the partnership....
16 Pages (4000 words) Research Paper

How Environmental Movement Influenced Society

The narrator of this essay aims to tell that environmental Movement is a social movement that uses various strategies such as education, activism, and lobbying in order to influence the political course.... The movement seeks to protect the ecosystem and natural resources.... hellip; This essay demonstrates that there are many ideologies and structures in the Movement....
33 Pages (8250 words) Research Paper
sponsored ads
We use cookies to create the best experience for you. Keep on browsing if you are OK with that, or find out how to manage cookies.
Contact Us