StudentShare
Contact Us
Sign In / Sign Up for FREE
Search
Go to advanced search...
Free

The Performance of the Companies: Kellogg and Kraft Foods - Essay Example

Cite this document
Summary
This essay has been conducted to mainly analyze the financial performance of Kellogg Co. and Kraft Foods with the help of common-sized financial statements and traditional ratio analysis. The income statement for Kellogg has shown more stable and better performance as compared to Kraft Foods…
Download full paper File format: .doc, available for editing
GRAB THE BEST PAPER92.7% of users find it useful
The Performance of the Companies: Kellogg and Kraft Foods
Read Text Preview

Extract of sample "The Performance of the Companies: Kellogg and Kraft Foods"

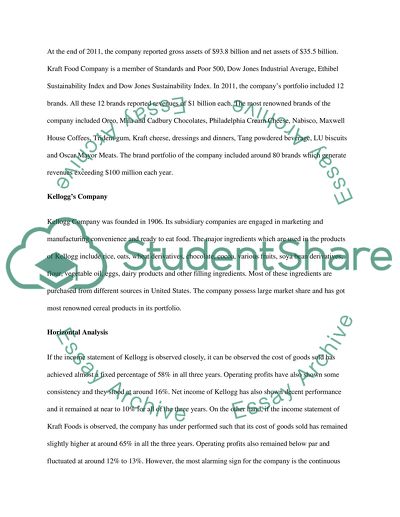
Financial Analysis – Kellogg v/s Kraft Foods Executive Summary This report has been conducted to mainly analyze the financial performance of Kellogg Co. and Kraft Foods with the help of common sized financial statements and traditional ratio analysis. The income statement for Kellogg has shown more stable and better performance as compared to Kraft Foods. However, the balance sheet of Kellogg has remained very risky due to much higher amount of debt included in its capital structure. As per the ratio analysis, both firms have more or less performed on a similar footings and not much important discrepancy is found among the two. Introduction The financial position and performance of a company can be analyzed with the help of different tools available. However, for the relative performance analysis, common size analysis as well as the traditional ratio analysis is the most effective tools such that they provide a same yardstick to compare the performance of two or more companies over several periods. This particular report emphasizes the performance of Kellogg Co. and Kraft Foods on the basis of common sized analysis and the traditional ratio analysis. Kraft’s Food Company Kraft Food Company is one of the world’s largest food companies. In 2011, the estimated revenue of the company is approximated as $54.4 billion whereas the earnings of the company before taxes are amounted as $4.8 billion. Kraft Food incorporated in Virginia in 2000. They have around 126,000 employees all over the world. The company manufactures and markets products related to food which includes confectionery, biscuits, cheese, beverages, packaged grocery, convenient meals etc. The company sells its products to its customers in over 170 different countries. At the end of 2011, the company reported gross assets of $93.8 billion and net assets of $35.5 billion. Kraft Food Company is a member of Standards and Poor 500, Dow Jones Industrial Average, Ethibel Sustainability Index and Dow Jones Sustainability Index. In 2011, the company’s portfolio included 12 brands. All these 12 brands reported revenues of $1 billion each. The most renowned brands of the company included Oreo, Mila and Cadbury Chocolates, Philadelphia Cream Cheese, Nabisco, Maxwell House Coffees, Trident gum, Kraft cheese, dressings and dinners, Tang powdered beverage, LU biscuits and Oscar Mayor Meats. The brand portfolio of the company included around 80 brands which generate revenues exceeding $100 million each year. Kellogg’s Company Kellogg Company was founded in 1906. Its subsidiary companies are engaged in marketing and manufacturing convenience and ready to eat food. The major ingredients which are used in the products of Kellogg include rice, oats, wheat derivatives, chocolate, cocoa, various fruits, soya bean derivatives, flour, vegetable oil, eggs, dairy products and other filling ingredients. Most of these ingredients are purchased from different sources in United States. The company possess large market share and has got most renowned cereal products in its portfolio. Horizontal Analysis If the income statement of Kellogg is observed closely, it can be observed the cost of goods sold has achieved almost a fixed percentage of 58% in all three years. Operating profits have also shown some consistency and they stood at around 16%. Net income of Kellogg has also shown decent performance and it remained at near to 10% for all of the three years. On the other hand, if the income statement of Kraft Foods is observed, the company has under performed such that its cost of goods sold has remained slightly higher at around 65% in all the three years. Operating profits also remained below par and fluctuated at around 12% to 13%. However, the most alarming sign for the company is the continuous declining trend of net income which has dropped from 8% to 6% in three years time. Overall, income statement of Kellogg has shown more decent performance as compared to Kraft Foods. So far as the balance sheet of Kellogg is concerned, the ratio of current assets is on an increasing trend and currently at 25%. One considerable proportion to total assets is of goodwill which takes a substantial percentage of around 30%. The company’s debt position has increase sharply such that around 85% of the assets are financed through debt with a very minor percentage of equity of around 15%. The current assets of Kraft Foods amount to around 17% of the total assets. However, a very huge percentage of goodwill can be experienced over here which takes around 40%. Debt structure of Kraft food is still quite better than that of Kellogg such that around 62% assets are financed through debt and the remaining 38% are financed through equity. Vertical Analysis The trend analysis of Kellogg does not provide a very convincing picture of income statement such that its sales and cost of sales have increased but operating profits and net income have experienced negative zone which is not a satisfactory sign for the company. On the other hand, Kraft Foods have remained successful in increasing its revenues by double figure percentage along with the operating profits. However, they experienced a very sluggish decrease of around -14% in terms of their net income growth. If the balance sheet of Kellogg is considered, it can be noted that current assets have increased by a marginal percentage of around 3% as compared to previous year however total assets stayed the same footing of the last year. Equity position of Kellogg has experienced a negative trend it wiped out by around -18% in the last year. However, debt position of the company has massively increased as compared to previous year which shows the riskiness of the company. The balance sheet of Kraft Foods remained a bit stable last year as it did not show any major fluctuations. Current assets remained the same as compared to previous year. Total Assets declined by around 1%. Similar trend can also be observed for both the equity and liabilities section as well. In a nutshell, Kraft food reflected a better performance as compared to Kellogg in terms of their performance for the last three years. Ratio Analysis If liquidity ratios for both the companies are observed, it can be noticed that the liquidity position has improved by both the companies as both the companies more current assets as compared to their current liabilities. If the turnovers for the companies are analyzed, more or similar trends can be observed in terms of inventory turnover such that Kellogg has around 12 turnovers a year whereas Kraft Foods managed 10 turnovers a year. For receivable turnovers, Kellogg has around 11 turnovers a year but Kraft Foods have remained a bit lazy in collecting its receivables and had only 8 turnovers a year. Total asset turnover for Kellogg has been good for the past 3 years which is around a single turnover a year. However, Kraft Foods hardly managed to have half turnover in the whole year. The return on shareholder’s equity for Kellogg is quite disturbing due to the fact that it has injected a very less amount of equity in its capital structure due to which it shows more than 50% return on equity. The same for Kraft Food has been on a rather justified side, showing around 10% return on equity on average basis in all three years. Return on assets for Kellogg has been pretty much consistent such that it remained at around 10.5% every year whereas the same for Kraft Food has shown dramatic decline from 6% to 3% in last 3 years. Return on sales for Kellogg has been quite stable and remained near about 10% every year. But a significant change can be experienced with the return on sales of Kraft Foods such that it reduced around 6% from 10% in the last three years. Debt to asset ratio of Kellogg is quite worse such that more than 80% of its assets are financed through debt which is huge risk sign for the company. On the other hand, Kraft Foods has around 63% debt in its capital structure which is a rather better side for the company. Despite of raising too much debt, still the interest coverage ratio for Kellogg has been quite phenomenal and stood at around 8 times as compared to that of Kraft Foods which even struggled to achieve a multiple of 3 for the past three years. If the investors’ ratios are taken into consideration, it can be observed that EPS for Kellogg and Kraft has remained around $3 and $2 respectively with more or less 60% payout ratio for both the companies. However, the book value per share of Kellogg is quite disappointing which has been around $5 per share as compared to Kraft Food which has been more than $18 per share every year. Conclusion Overall, the performance of both the companies has remained very similar except for the capital structure of Kellogg which has been highly influenced by debt percentage. However, the income statement for Kellogg is still more stable as compared to Kraft Foods. It is important to mention that Kellogg needs to increase amount of equity as well in its capital structure in order to avoid any probable mishap in the future. Kellogg Co       Income Statement   Horizontal Analysis       (millions, except per share data) 2011 2010 2009 Net sales 100.00 100.00 100.00 Cost of goods sold 58.72 57.34 57.13 Selling, general and administrative expense 26.31 26.61 26.96 Operating profit 14.97 16.05 15.91 Interest expense 1.77 2.00 2.35 Other income (expense), net -0.08 -0.17 Income before income taxes 13.12 14.05 13.39 Income taxes 3.81 4.05 3.79 Net income 9.31 10.00 9.61 Net loss attributable to noncontrolling interests -0.02 -0.06 -0.03 Net income attributable to Kellogg Company 9.33 10.06 9.64 Kellogg Co       Balance Sheet   Horizontal Analysis       (millions, except share data)   Current assets 2011 2010 2009 Cash and cash equivalents 3.87 3.75 2.98 Accounts receivable, net 9.98 10.04 9.76 Inventories 9.51 8.91 8.13 Other current assets 2.08 1.90 1.97 Total current assets 25.43 24.61 22.84 Property, net 27.57 26.40 26.88 Goodwill 30.44 30.62 32.53 Other intangibles, net 12.22 12.29 13.02 Other assets 4.34 6.08 4.74 Total assets 100.00 100.00 100.00 Current liabilities 0.00 0.00 0.00 Current maturities of long-term debt 6.39 8.04 0.01 Notes payable 1.97 0.37 0.39 Accounts payable 9.99 9.70 9.62 Other current liabilities 9.49 8.77 10.41 Total current liabilities 27.84 26.88 20.43 Long-term debt 42.32 41.43 43.17 Deferred income taxes 5.35 5.88 3.79 Pension liability 4.71 2.24 3.84 Other liabilities 4.97 5.39 8.46 Commitments and contingencies 85.19 81.82 79.69 Equity 0.00 0.00 0.00 Common stock, $.25 par value, 1,000,000,000 shares authorized 0.00 0.00 0.00 Issued: 419,484,087 shares in 2011 and 419,272,027 shares in 2010 0.88 0.89 0.94 Capital in excess of par value 4.39 4.18 4.21 Retained earnings 56.47 51.68 48.94 Treasury stock at cost 0.00 0.00 0.00 62,182,500 shares in 2011 and 53,667,635 shares in 2010 -26.30 -22.37 -16.25 Accumulated other comprehensive income (loss) -20.65 -16.16 -17.55 Total Kellogg Company equity 14.79 18.22 20.29 Noncontrolling interests 0.02 -0.03 0.03 Total equity 14.81 18.18 20.31 Total liabilities and equity 100.00 100.00 100.00 Kellogg Co     Income Statement   Vertical Analysis       (millions, except per share data) 2011-10 2010-09 Net sales 6.46% -1.42% Cost of goods sold 9.03% -1.06% Selling, general and administrative expense 5.24% -2.68% Operating profit -0.70% -0.55% Interest expense -6.05% -15.93% Other income (expense), net   Income before income taxes -0.57% 3.44% Income taxes 0.20% 5.46% Net income -0.89% 2.65% Net loss attributable to noncontrolling interests -71.43% 75.00% Net income attributable to Kellogg Company -1.28% 2.89% Per share amounts:   Basic 2.41% 4.73% Diluted 2.42% 4.43% Dividends per share 7.05% 9.09% Kellogg Co     Balance Sheet   Vertical Analysis       (millions, except share data) 2011-10 2010-09 Current assets   Cash and cash equivalents 3.60% 32.93% Accounts receivable, net -0.17% 8.87% Inventories 7.20% 16.04% Other current assets 9.78% 1.81% Total current assets 3.84% 13.96% Property, net 4.89% 3.92% Goodwill -0.14% -0.41% Other intangibles, net -0.14% -0.14% Other assets -28.33% 35.59% Total assets 0.46% 5.78% Current liabilities   Current maturities of long-term debt -20.06% 95100.00% Notes payable 431.82% 0.00% Accounts payable 3.48% 6.69% Other current liabilities 8.66% -10.89% Total current liabilities 4.05% 39.16% Long-term debt 2.63% 1.51% Deferred income taxes -8.61% 64.00% Pension liability 111.32% -38.37% Other liabilities -7.36% -32.52% Commitments and contingencies   Equity   Common stock, $.25 par value, 1,000,000,000 shares authorized   Issued: 419,484,087 shares in 2011 and 419,272,027 shares in 2010 0.00% 0.00% Capital in excess of par value 5.45% 4.87% Retained earnings 9.78% 11.69% Treasury stock at cost   62,182,500 shares in 2011 and 53,667,635 shares in 2010 18.11% 45.60% Accumulated other comprehensive income (loss) 28.42% -2.64% Total Kellogg Company equity -18.44% -5.02% Noncontrolling interests -150.00% -233.33% Total equity -18.20% -5.32% Total liabilities and equity 0.46% 5.78% Kraft Foods       Income Statement   Horizontal Analysis             2011 2010 2009 Net revenues 100.00 100.00 100.00 Cost of sales 65.02 63.62 64.04 Gross profit 34.98 36.38 35.96 Selling, general and administrative expenses 22.33 24.39 22.67 Asset impairment and exit costs -0.01 0.04 -0.17 Losses on divestitures, net 0.01 0.02 Amortization of intangibles 0.41 0.43 0.07 Operating income 12.25 11.51 13.37 Interest and other expense, net 3.47 4.11 3.19 Earnings from continuing operations before income taxes 8.78 7.40 10.18 Provision for income taxes 2.25 2.33 2.93 Earnings from continuing operations 6.52 5.07 7.25 Earnings and gain from discontinued operations, net of income taxes 3.34 0.56 Net earnings 6.52 8.41 7.81 Noncontrolling interest 0.04 0.05 0.02 Net earnings attributable to Kraft Foods 6.49 8.36 10.62 Per share data: 0.00 0.00 0.00 Basic earnings per share attributable to Kraft Foods: 0.00 0.00 0.00 Continuing operations 0.00 0.00 0.00 Discontinued operations 0.00 0.00 Net earnings attributable to Kraft Foods 0.00 0.00 0.01 Diluted earnings per share attributable to Kraft Foods: 0.00 0.00 0.00 Continuing operations 0.00 0.00 0.00 Discontinued operations 0.00 0.00 Net earnings attributable to Kraft Foods 0.00 0.00 0.01 Dividends declared 0.00 0.00 0.00 Kraft Foods       Balance Sheet   Horizontal Analysis     2011 2010 2009 ASSETS   Cash and cash equivalents 2.10 2.60 3.15 Receivables (net of allowances of $143 in 2011 and $246 in 2010) 6.78 6.86 7.79 Inventories, net 6.08 5.57 5.66 Deferred income taxes 0.97 0.94 1.09 Other current assets 1.33 1.04 0.98 Total current asset 17.27 17.02 18.67 Property, plant and equipment, net 14.72 14.47 16.03 Goodwill 39.75 39.73 43.12 Intangible assets, net 26.84 27.25 20.13 Prepaid pension assets 0.03 0.09 0.17 Other assets 1.39 1.44 1.89 TOTAL ASSETS 100.00 100.00 100.00 LIABILITIES 0.00 0.00 0.00 Short-term borrowings 0.19 0.79 0.68 Current portion of long-term debt 3.89 1.17 0.77 Accounts payable 5.89 5.68 5.64 Accrued marketing 3.05 2.64 3.27 Accrued employment costs 1.45 1.36 1.76 Other current liabilities 5.17 5.05 5.10 Total current liabilities 19.66 16.68 17.22 Long-term debt 24.61 28.19 27.02 Deferred income taxes 7.18 8.38 6.76 Accrued pension costs 3.83 2.50 2.65 Accrued postretirement health care costs 3.45 3.20 4.22 Other liabilities 3.62 3.34 3.20 TOTAL LIABILITIES 62.35 62.28 61.07 Commitments and Contingencies (Note 13) 0.00 0.00 0.00 EQUITY 0.00 0.00 0.00 Additional paid-in capital 33.37 32.78 35.39 Retained earnings 19.19 17.44 21.94 Accumulated other comprehensive losses -7.07 -4.08 -5.93 Treasury stock, at cost -7.97 -8.53 -12.62 Total Kraft Foods Shareholders Equity 37.53 37.61 38.79 Noncontrolling interest 0.12 0.11 0.14 TOTAL EQUITY 37.65 37.72 38.93 TOTAL LIABILITIES AND EQUITY 100.00 100.00 100.00 Kraft Foods     Income Statement   Vertical Analysis             2011-10 2010-09 Net revenues 10.48 26.97 Cost of sales 12.92 26.13 Gross profit 6.22 28.47 Selling, general and administrative expenses 1.16 36.62 Asset impairment and exit costs -138.89 -128.13 Losses on divestitures, net 0.00 Amortization of intangibles 6.64 711.54 Operating income 17.49 9.32 Interest and other expense, net -6.87 63.62 Earnings from continuing operations before income taxes 31.03 -7.70 Provision for income taxes 6.80 0.97 Earnings from continuing operations 42.16 -11.21 Earnings and gain from discontinued operations, net of income taxes 654.13 Net earnings -14.30 36.69 Noncontrolling interest -20.00 257.14 Net earnings attributable to Kraft Foods -14.27 36.18 Per share data:   Basic earnings per share attributable to Kraft Foods:   Continuing operations 38.89 -24.21 Discontinued operations 585.71 Net earnings attributable to Kraft Foods -16.67 17.65 Diluted earnings per share attributable to Kraft Foods:   Continuing operations 38.19 -23.81 Discontinued operations 578.57 Net earnings attributable to Kraft Foods -16.74 17.73 Dividends declared 0.00 0.00 Kraft Foods     Balance Sheet   Vertical Analysis       ASSETS 2011-10 2010-09 Cash and cash equivalents -20.44 18.09 Receivables (net of allowances of $143 in 2011 and $246 in 2010) -2.72 25.82 Inventories, net 7.46 40.66 Deferred income taxes 1.56 23.01 Other current assets 25.78 52.53 Total current asset -0.12 30.25 Property, plant and equipment, net 0.15 28.98 Goodwill -1.48 31.61 Intangible assets, net -2.99 93.34 Prepaid pension assets -63.95 -25.22 Other assets -4.60 8.90 TOTAL ASSETS -1.52 42.83 LIABILITIES   Short-term borrowings -75.73 65.56 Current portion of long-term debt 227.71 117.35 Accounts payable 2.14 43.63 Accrued marketing 13.84 15.31 Accrued employment costs 5.65 9.96 Other current liabilities 0.91 41.40 Total current liabilities 16.06 38.31 Long-term debt -14.01 49.02 Deferred income taxes -15.61 77.11 Accrued pension costs 51.01 34.96 Accrued postretirement health care costs 6.30 8.17 Other liabilities 6.69 48.88 TOTAL LIABILITIES -1.41 45.67 EQUITY   Common Stock, no par value (1,996,537,778 shares issued in 2011 and 2010)   Additional paid-in capital 0.28 32.27 Retained earnings 8.38 13.55 Accumulated other comprehensive losses 70.62 -1.64 Treasury stock, at cost -8.00 -3.45 Total Kraft Foods Shareholders Equity -1.72 38.48 Noncontrolling interest 2.78 12.50 TOTAL EQUITY -1.71 38.39 TOTAL LIABILITIES AND EQUITY -1.52 42.83 Current Ratio Year     Kellogg Co. Kraft Foods 2011 Current Assets 3027 1.32 16,202 1.41   Current Liabilities 2288 11,491   2010 2915 0.92 16,221 1.02   3184 15,893   2009 2558 0.77 12,454 0.68       3313   18,445   Quick Ratio Year     Kellogg Co. Kraft Foods 2011 Current Assets - Inventories 1895 0.83 10,496 0.91   Current Liabilities 2288 11,491   2010 1859 0.58 10,911 0.69   3184 15,893   2009 1648 0.50 8,679 0.47       3313   18,445   Inventory Turnover Year     Kellogg Co.   Kraft Foods 2011 Sales 12,575 11.11 54,365 9.53   Inventory 1,132 5,706   2010 12,397 11.74 49,207 9.27   1,056 5,310   2009 12,575 13.82 38,754 10.27       910     3,775   Receivable Turnover Year     Kellogg Co.   Kraft Foods 2011 Sales 12,575 10.59 54,365 8.55   Receivables 1,188 6,361   2010 12,397 10.42 49,207 7.53   1,190 6,539   2009 12,575 11.51 38,754 7.46       1,093     5,197   Asset Turnover Year     Kellogg Co.   Kraft Foods 2011 Sales 12,575 1.06 54,365 0.58   Payables 11,901 93,837   2010 12,397 1.05 49,207 0.52   11,847 95,289   2009 12,575 1.12 38,754 0.58       11,200     66,714   Return on Shareholders Equity Year     Kellogg Co.   Kraft Foods 2011 Net Income   1,231 69.86% 3,527 9.98%   Shareholders Equity 1,762 35,328   2010 1,247 57.89% 4,114 11.45%   2,154 35,942   2009 1,212 53.27% 4,114 15.84%       2,275     25,972   Return on Assets Year     Kellogg Co.   Kraft Foods 2011 Net Income 1,231 10.34% 3,527 3.76%   Total Assets 11,901 93,837   2010 1,247 10.53% 4,114 4.32%   11,847 95,289   2009 1,212 10.82% 4,114 6.17%       11,200     66,714   Return on Sales Year     Kellogg Co.   Kraft Foods 2011 Net Income   1,231 9.33%   3,527 6.49%   Net Sales 13,198 54,365   2010 1,247 10.06% 4,114 8.36%   12,397 49,207   2009 1,212 9.64% 4,114 10.62%       12,575     38,754   Debt to Assets Ratio Year     Kellogg Co. Kraft Foods 2011 Total Liabilities 10,139 85.19% 58,509 62.35%   Total Assets 11,901 93,837   2010 9,693 81.82% 59,347 62.28%   11,847 95,289   2009 8,925 79.69% 40,742 61.07%       11,200   66,714   Times Interest Earned Year     Kellogg Co. Kraft Foods 2011 Operating Profit 1,976 8.48 6,657 3.53   Interest Expense 233 1,885   2010 1,990 8.02 5,666 2.80   248 2,024   2009 2,001 6.78 5,183 4.19       295   1,237   Earning per share Year     Kellogg Co. Kraft Foods 2011 Net Income 1,231 2.94 3,527 1.77   Number of Shares Outstanding 419 1,996   2010 1,247 2.98 4,114 2.06   419 1,996   2009 1,212 2.89 4,114 2.06       419   1,996   Payout Ratio Year     Kellogg Co. Kraft Foods 2011 DPS 1.67 56.84% 1.16 65.54%   EPS 2.94 1.77   2010 1.56 52.42% 1.16 56.31%   2.98 2.06   2009 1.43 49.44% 1.16 56.31%       2.89   2.06   Book value per share Year     Kellogg Co. Kraft Foods 2011 Shareholders Equity 1,762 4.21 35,328 17.70   Number of Shares Outstanding 419 1,996   2010 2,154 5.14 35,942 18.01   419 1,996   2009 2,275 5.43 25,972 13.01       419   1,996   Works Cited Kelloggs Company. (2011). ANNUAL REPORT PURSUANT TO SECTION 13 OR 15(d). Washington D.C: UNITED STATES SECURITIES AND EXCHANGE COMMISSION. KRAFT FOODS INC (KFT). (2011). Annual report pursuant to section 13 and 15(d). Virginia: United States Securities and Exchange Commission. Read More
Cite this document
  • APA
  • MLA
  • CHICAGO
(The Performance of the Companies: Kellogg and Kraft Foods Essay, n.d.)
The Performance of the Companies: Kellogg and Kraft Foods Essay. Retrieved from https://studentshare.org/finance-accounting/1593469-financial-statement-analysis
(The Performance of the Companies: Kellogg and Kraft Foods Essay)
The Performance of the Companies: Kellogg and Kraft Foods Essay. https://studentshare.org/finance-accounting/1593469-financial-statement-analysis.
“The Performance of the Companies: Kellogg and Kraft Foods Essay”, n.d. https://studentshare.org/finance-accounting/1593469-financial-statement-analysis.
  • Cited: 0 times

CHECK THESE SAMPLES OF The Performance of the Companies: Kellogg and Kraft Foods

Marketing Plan for Kellogg Company 2012-2015

Financial overview According to information obtained from its official website, with 2011 sales of more than $13 billion, Kellogg Company is regarded as the world's leader in production of cereals and is also a leader in production of convenient foods.... Mission statement “Nourishing families so they can flourish and thrive” The above mission statement is a good one since it shows that the company is committed to provide healthy breakfast foods to different consumers across the globe....
11 Pages (2750 words) Essay

Information and Communication Technology in Companies

The paper "Information and Communication Technology in companies" discusses that social media's concept came about due to an idea mooted by Ted Leonsis in 1997, who was then the chief executive at AOL.... With a subscription of over one billion users, Facebook allows individuals, companies, organizations, and even government agencies to create and manage personalized profiles that can be viewed either publicly or by authorized people.... The study revealed that most workers want a blend of personal and work lifestyles in organizational culture, which has come to determine which companies get the best talent....
12 Pages (3000 words) Dissertation

Evaluation and Comparison of the Marketing Strategies of Two Global Companies: Nestle and P&G

Major categories of products are starting from breakfast cereals, baby food, dairy products, bottled water, coffee confectionary, snacks, ice cream and pet foods.... Evaluation and comparison of the marketing strategies of two global companies: Nestle and P&G Table of Contents Introduction 4 Company overview 4 Nestle 4 P&G 5 SWOT analysis 6 Internal strengths 6 Internal weaknesses 7 External opportunities 7 External threats 8 Porter's Five Forces Analysis 9 Threat of new entrants 9 Bargaining power of buyers 9 Bargaining power of suppliers 10 Threat of substitutes 10 Internal rivalry in the industry 11 Marketing Mix 11 Product 11 Price 12 Place 12 Promotion 13 References 14 Introduction This paper deals with a detailed comparative analysis of marketing strategies of two Global FMCG companies....
10 Pages (2500 words) Essay

The Key Function of Corporate Social Responsibility

The inter-relationship of business and society is intrinsically linked to business goals and performance.... 1.... Introduction The key function of business is to make profit by providing the people with goods and services.... In the contemporary environment of cut throat business, its core strategy is invariably focused on meeting the changing preferences of the people through development of new products and services....
16 Pages (4000 words) Essay

Mergers and Acquisitions in Creating Maximum Value

Lazonick, O'Sullivan, (2008 pp-24-27) stated that the rationale behind mergers and acquisitions is based on the thought that two companies together can be more valuable and robust compared to two different companies.... Mergers and Acquisitions as a Strategic Mean of Creating Value and Maximizing Shareholder Wealth By [Name of student] [Presented to] [Name of institution] [Date] INTRODUCTION Organisations in the current business environment thrive for success and creation of value....
11 Pages (2750 words) Essay

Company Strategic Analysis: General Mills

hellip; The report also analyzes the performance of the company its mission, strategies adapted by the company, and also analyzes the resources of the firm whether they are rare and whether they are imitable or not.... kraft and Kellogg are formidable competitors of the company, having strong brands of their own.... Rivalry amongst competitors: This dimension is also ending up on the higher end of the spectrum because as mentioned earlier kraft Food and Kellogg, both are formidable competitors having strong management and brand portfolio....
5 Pages (1250 words) Research Paper

The project of Kellogg Company producer of cereal and other food

Today, each and every company spend significant amount of resources in the… kellogg, being one of the most successful companies in the world has also adopted several strategies to gain and maintain the market leadership strategies. This report is all This report starts with a proper introduction which gives a fair idea about the basic concept of strategic management and the sequence of work that is followed throughout the project.... Since the project is on kellogg, it is very important to have a clear understanding about the company, its business model, products, and employees....
14 Pages (3500 words) Essay

International Trade: Physical Distribution

The author of the paper examines the levels of integrated relationships kellogg has with their suppliers and their customers, and the advantages and disadvantages of these relationships.... Thus, kellogg's for one, being a global food major, needs to exercise extreme caution and circumspection in the kind of cereals and snacks it serves, not only in terms of preserving its high reputation as a quality food producer, but also in terms of the fact that kellogg's is as much concerned about the food which consumers eat, as most probably the customers themselves are....
10 Pages (2500 words) Assignment
sponsored ads
We use cookies to create the best experience for you. Keep on browsing if you are OK with that, or find out how to manage cookies.
Contact Us