StudentShare
Contact Us
Sign In / Sign Up for FREE
Search
Go to advanced search...
Free

Financial statement analysis - Essay Example

Cite this document
Summary
Supplies is a public company which is engaged in the business of manufacturing and supplying of different electrical components. This study is about the financial ratio analysis of the company for the years 2011 and 2012…
Download full paper File format: .doc, available for editing
GRAB THE BEST PAPER97.6% of users find it useful
Financial statement analysis
Read Text Preview

Extract of sample "Financial statement analysis"

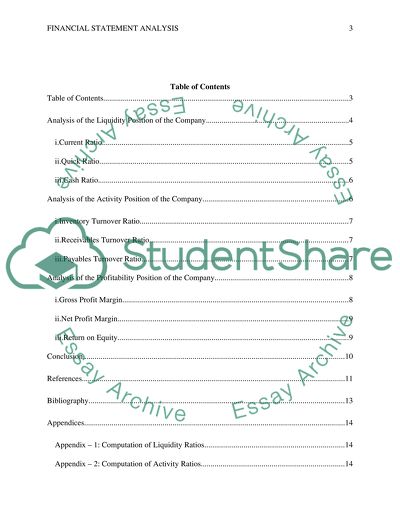
? FINANCIAL MENT ANALYSIS A4M1 Supplies is a public company which is engaged in the business of manufacturing and supplying of different electrical components. This study is about the financial ratio analysis of the company for the years 2011 and 2012. The ratio analysis has been performed with the help of the financial information present in the company’s financial statements. Different types of ratios have been calculated and divided into three categories, namely, liquidity ratios, activity ratios and profitability ratios. The liquidity ratios calculated for the company indicate that the company was able to generate more ash revenues in the year 2012 as compared to 2011, and this resulted in improvement in its liquidity position in the year 2012. As regards its activity ratios, the company management was able to manage its receivables more efficiently in 2012 but was not able to manage its inventories that efficiently in the year 2012. Next, regarding its profitability ratios, the company managed to generate more profit in 2012 and thereby improved its profitability position significantly. However, industry ratios were not used for comparison in this study, which is one of the limitations of this analysis. Table of Contents Table of Contents 3 Analysis of the Liquidity Position of the Company 4 i.Current Ratio 4 ii.Quick Ratio 5 iii.Cash Ratio 5 Analysis of the Activity Position of the Company 6 i.Inventory Turnover Ratio 6 ii.Receivables Turnover Ratio 7 iii.Payables Turnover Ratio 7 Analysis of the Profitability Position of the Company 7 i.Gross Profit Margin 8 ii.Net Profit Margin 8 iii.Return on Equity 9 Conclusion 9 References 10 Bibliography 12 Appendices 13 Appendix – 1: Computation of Liquidity Ratios 13 Appendix – 2: Computation of Activity Ratios 13 Appendix – 3: Computation of Profitability Ratios 14 A4M1 Supplies is engaged in the business of manufacturing and supplying different types of electrical components in the market. This study analyses the financial statements of A4M1 Supplies Company for the years 2011 and 2012. The performance and efficiency of an organization can be evaluated through proper analysis of its financial statements (Chandra, 2005, pp. 24, 17). Ratio analysis is a method of analyzing the financial information of a company as presented in its financial statements. It includes calculations of various ratios, which helps in the measurement of the financial performance of a company (Siddiqui, 2006, p.623). Various financial ratios of the A4M1 Supplies have been calculated and interpreted in this study. The ratios have been divided into three categories to indicate the liquidity, activity and profitability position of the company in 2011 and 2012. Analysis of the Liquidity Position of the Company The liquidity position of a company can be better understood trough the use of the liquidity ratios, which have been explained in details in this section. The company's ability to fulfill its current existing liabilities is measured through its liquidity ratios. These liquidity ratios are important for a company like A4M1 Supplies because if the company fails to meet such obligations, it might result in the bankruptcy of the company (Gallagher & Andrew, 2007, p. 94). The liquidity ratios computed for A4M1 Supplies include its current ratio, quick ratio or acid test ratio and cash ratio (Appendix - 1). i. Current Ratio This is one of the commonly used liquidity ratios of a business organization. It helps measure the ability of a company of meeting its existing short-term liabilities (Megginson, & Smart, 2008, p. 49). It is calculated as the ratio of the current assets owned by the firm to its existing current liabilities. The current ratio calculated for the company indicates that it has improved in 2012 as compared to 2011. It means that the company managed to improve its liquidity position in the year 2012 and 178% of the current liabilities of the company are available as liquid assets in the form of current assets of the company. ii. Quick Ratio Quick ratio, which is also known as acid test ratio, is a more conservative approach to measuring the liquidity position of an organization than the current ratio, because it does not include inventory as current assets in the formula of calculating the current ratio. The rationale behind such exclusion of inventory is that the company may not be able to convert its inventories into cash that quickly to meet its immediate obligations. If the quick ratio of a firm goes below one, it can be a bit of concern for both the internal managers and the creditors of the company, because it implies that the current obligations could not be met successfully through the use of liquid or quick assets of the company (Jackson, Sawyers, & Jenkins, 2008, p. 502). The quick ratio as calculated above indicates that it has also improved in the year 2012 as compared to 2011. However, the quick ratio values are significantly lower than the current asset values. This indicates that most of the current assets of the company are in the form of inventories. Therefore, the company might face problems in meeting its current obligations if it is not able to easily convert its inventories into cash. iii. Cash Ratio Cash ratio is a more conservative approach to measuring the liquidity position of a company as compared to current ratio or quick ratio. It is based on the assumption that the company's current obligations can be funded through its cash and other marketable securities (if any). This measure is more helpful in measuring the company's liquidity when it is required that the company meet its current obligations in the form of current liabilities only with cash in the near future (Baker & Powell, 2005, p. 49-50). The cash ratio calculated for the company indicates that the company had not cash balance in the year 2011 and managed to generate some amount of cash revenues in the year 2012. However, the cash ratio of 0.09 for the year 2012 is too low and the company might be facing difficulties in fulfilling its current debt obligations. Analysis of the Activity Position of the Company Activity ratios, which are sometimes termed as efficiency ratios, help determine the activity position of a company. The activity ratios give a measure of the liquidity associated with certain types of current assets owned by the company through the estimation of different types of segments of its operating cycle. It indicates the efficiency of the company management related to optimum utilization of the available short-term economic resources of the organization (Nikolai, Bazley, & Jones 2009, p. 282). The activity ratios calculated for A4M1 Supplies Company are its inventory turnover ratio, receivables turnover ratio and payables turnover ratio (Appendix - 2). i. Inventory Turnover Ratio The inventory turnover ratio is one of the measures of the activity or efficiency of a business firm, which indicates its ability to sell and replace its existing inventories as quickly as possible. It is calculated as the ratio between the costs of sales or goods sold by the organization to its average inventory during a particular period (Stickney, Weil, Schipper, & Francis, 2009, p. 252). The inventory turnover ratio of the company has reduced 4.65 times in the year 2012 as compared to 5.01 times in 2011. This indicates that the company has not been able to manage its inventories efficiently in 2012. This has resulted in the increase of inventories as well. ii. Receivables Turnover Ratio This type of activity ratio gives a measure about the number of times the accounts receivables of a company are turned over in a particular period. The higher the receivables turnover ratio, the better it is for the firm, because it indicates that the company is managing to collect its receivables more efficiently (Rich, Jones, Mowen, & Hansen, 2011, p. 607). The receivables turnover ratio calculated for the company indicates that it has improved in 2012 as compared to 2011. This implies that the company was able to collect its receivables more efficiently in 2012 and it has resulted in the increase in cash balance of the company as well. iii. Payables Turnover Ratio This is another activity ratio which gives a measure about the number of times the accounts payables of an organization are turned over in a particular period. Therefore, it indicates the number of times purchases made by a company are paid off during the year (Bragg, 2012, p. 80). The payables turnover ratio of the company is showing an increasing trend indicated through the calculated figures as shown in Appendix - 2. It implies the rate of paying off its creditors has increased in 2012. However, this ratio is much less than the receivables turnover ratio implying that the company managed to generate cash at a faster rate in 2012. Analysis of the Profitability Position of the Company The profitability ratios calculated through the use of the information present in the financial statements of a company provide a better understanding about the profitability position of the company. Various items like sales or revenues, stock value, and equity can be related to the profit generated by a business firm. Profitability ratios give a measure of the business firm’s ability to generate profits out of its available resources and the extent or the level up to which those resources are being managed in an efficient way (Gitman, & McDaniel, 2008, p. 393). The profitability ratios that have calculated for A4M1 Supplies include gross profit margin ratio, net profit margin ratio and return on equity (Appendix - 3). i. Gross Profit Margin This ratio is a profitability measure of a company which gives an indication about each of the sales dollar in percentage terms that is found to be remaining once all the goods purchased by the organization has been paid off. Every company aspires to have a greater gross profit margin to generate more profit out of its sales (Pinson, 2008, p. 115). The gross profit margin of the company has increased in 2012 as compared to 2011. This indicates that the company managed to increase its revenues at a greater rate than costs of purchasing the goods. Therefore, according to this ratio, it was more profitable in the year 2012. ii. Net Profit Margin This ratio is one of the most commonly used profitability measures of a company. It indicates the net income generated by the organization as a percentage of its revenues or sales (Gibson, 2012, p. 324). The profit earned by the company after taking into account the taxes paid by it is considered to be its net income. The net profit margin is observed to have increased significantly in the year 2012 as compared to 2011. It indicates that the company has managed to operate its business activities more efficiently in 2012, which has resulted in a more profitable position in 2012. iii. Return on Equity The return on equity is a profitability ratio which helps measure the net income generated by a company out of the capital received from its shareholders. Maximization of the wealth of the shareholders is considered to be one of the primary objectives of any business concern. Therefore, this ratio is very important for the organization and its shareholders (Rich, Mowen, Hansen, & Jones, 2009, p. 646). The return on equity of the company is alarmingly high in the year 2012 and was negative in the year 2011. This indicates that the company has been able to utilize its resources more efficiently in 2012, which has resulted in high levels of profit for its shareholders. Conclusion The ratio analysis performed in this study can be utilized to measure the performance and efficiency of the company in the years 2011 and 2012. The liquidity position of the company has improved in 2012, and it was able to generate more cash revenues in the year 2012 as compared to 2011. The activity ratios calculated in this study indicate that the company was not able to manage its inventory well in 2012. However, it managed to collect its receivables at a faster rate to generate increased cash revenues in 2012. As regards its profitability position, the company managed to generate higher profits in 2012 and was able to generate higher returns for its shareholders in 2012. All in all, the company managed to utilize its available resources efficiently to generate higher profits in 2012. References Baker, H. K., & Powell, G. (2005). Understanding financial management: A practical guide. New Jersey: John Wiley & Sons. Bragg, S. M. (2012). Business ratios and formulas: A comprehensive guide. (3rd ed.). New Jersey: John Wiley & Sons. Chandra, P. (2005). Fundamentals of financial management. (4th ed.). New Delhi: Tata McGraw-Hill. Gallagher, T. J., & Andrew, J. D. (2007). Financial management; principles and practice. (4th ed.). Minnesota: Freeload Press. Gibson, C. H. (2012). Financial reporting and analysis. (13th ed.). Connecticut: Cengage Learning. Gitman, L. J., & McDaniel, C. (2008). The future of business: The essentials. (4th ed.). Connecticut: Cengage Learning. Jackson, S. R., Sawyers, R. B., & Jenkins, J. G. (2008). Managerial accounting: A focus on ethical decision making. Connecticut: Cengage Learning. Megginson, W. L., & Smart, S. B. (2008). Introduction to corporate finance. (2nd ed.). Connecticut: Cengage Learning. Nikolai, L. A., Bazley, J. D., & Jones, J. P. (2009). Intermediate accounting. (11th ed.). Connecticut: Cengage Learning. Pinson, L. (2008). Anatomy of a business plan: The step-by-step guide to building a business and securing your company's future. (7th ed.). California: AKA Associates. Rich, J., Jones, J., Mowen, M., & Hansen, D. (2009). Cornerstones of financial accounting. Connecticut: Cengage Learning. Rich, J., Jones, J., Mowen, M., & Hansen, D. (2011). Cornerstones of financial accounting. (2nd ed.). Connecticut: Cengage Learning. Siddiqui, S. A. (2006). Managerial economics and financial analysis. New Delhi: New Age International (P) Ltd. Stickney, C., Weil, R. L., Schipper, K., & Francis, J. (2009). Financial accounting: An introduction to concepts, methods, and uses. (13th ed.). Connecticut: Cengage Learning. Bibliography Foster, G. (2007). Financial statement analysis. (2nd ed.). New Jersey: Pearson Education. Fridson, M. S. (2011). Financial statement analysis: A practitioner's guide. (4th ed.). New Jersey: John Wiley & Sons. Peterson, P. P., & Fabozzi, F. J. (2012). Analysis of financial statements. (2nd ed.). New Jersey: John Wiley & Sons. Woelfel, C. J. (1993). Financial statement analysis: The investor's self-study to interpreting & analyzing financial statements. New York: McGraw-Hill Education. Appendices Appendix – 1: Computation of Liquidity Ratios i. Current Ratio   2012 2011 Current Assets 216608 209940 Current Liabilities 121640 160,817.00 Current Ratio 1.78 1.31 ii. Quick Ratio   2012 2011 (Current Assets-Inventories) 57464 53283 Current Liabilities 121640 160817 Quick Ratio 0.47 0.33 iii. Cash Ratio   2012 2011 Cash 11552 0 Current Liabilities 121640 160817 Cash Ratio 0.09 0.00 Appendix – 2: Computation of Activity Ratios i. Inventory Turnover Ratio   2012 2011 Cost of Sales 740114 784971 Inventory 159144 156657 Inventory Turnover Ratio 4.65 5.01 ii. Receivables Turnover Ratio   2012 2011 Sales 1104786 1133736 Accounts Receivables 42970 50595 Receivables Turnover Ratio 25.71 22.41 iii. Payables Turnover Ratio   2012 2011 Sales 1104786 1133736 Accounts Payables 82053 91343 Payables Turnover Ratio 13.46 12.41 Appendix – 3: Computation of Profitability Ratios i. Gross Profit Margin   2012 2011 Gross Profit 364672 348765 Sales 1104786 1133736 Gross Profit Margin 33.01% 30.76% ii. Net Profit Margin   2012 2011 Net Profit 78516 8810 Sales 1104786 1133736 Net Profit Margin 7.11% 0.78% iii. Return on Equity   2012 2011 Net Profit 78516 8810 Shareholders' Equity 17167 -61349 Return on Equity 457.37% -14.36% Read More
Cite this document
  • APA
  • MLA
  • CHICAGO
(“Financial statement analysis Essay Example | Topics and Well Written Essays - 1750 words”, n.d.)
Financial statement analysis Essay Example | Topics and Well Written Essays - 1750 words. Retrieved from https://studentshare.org/finance-accounting/1401165-financial-statement-analysis
(Financial Statement Analysis Essay Example | Topics and Well Written Essays - 1750 Words)
Financial Statement Analysis Essay Example | Topics and Well Written Essays - 1750 Words. https://studentshare.org/finance-accounting/1401165-financial-statement-analysis.
“Financial Statement Analysis Essay Example | Topics and Well Written Essays - 1750 Words”, n.d. https://studentshare.org/finance-accounting/1401165-financial-statement-analysis.
  • Cited: 0 times

CHECK THESE SAMPLES OF Financial statement analysis

Position af a Staff Accountant

In reference to my resume, I am well equipped with strong computer skills, which are required in financial statements analysis.... The author of the paper will begin with the statement that it is exciting to find a job opening for the position of a staff accountant.... Most significant is the realization that the position requires experience in the area of general ledger and accurate financial reports maintenance, areas in which I have been working for the last two years of my internship....
1 Pages (250 words) Personal Statement

My goal statment

Additionally, I prepared the financial statement, summarized cash disbursements and cash receipts, prepared tax forms for individual & corporate, Utilized QuickBooks and so forth.... I would provide input setting standards for the assignments accomplishments including staff days of effort, and the scope, depth, as well as, analysis of the research.... This essay "My Goal statement" discusses past goals, job experience, current job requirements and job duties define future goals....
2 Pages (500 words) Personal Statement

Edit the Actual CV to be Oriented according to the Instructions

For financial analysis and management roles, I have carefully analyzed different financial information for provision of direction and support, optimal funds utilization, identifying recommendations, and guaranteeing that all operations are within the required budget.... Experienced to deliver high-end industrial knowledge, skills, and expertise for efficient and effective execution and handling of transaction, administrative and financial support functions within structured financial environment....
6 Pages (1500 words) Personal Statement

Next Plc Performance and Business Strategies Europe

and Europe as well as to evaluate the… I have mainly focused on the inductive reasoning approach in my research by accumulating sufficient data about the company and drawing suitable conclusion based on the analysis of these data (Beausaert, et.... I have mainly focused on the inductive reasoning approach in my research by accumulating sufficient data about the company and drawing suitable conclusion based on the analysis of these data (Beausaert, et....
2 Pages (500 words) Personal Statement

A Letter of Admission for Colorado School of Mines

"A Letter of Admission for Colorado School of Mines" paper contains a personal statement of a student who applied for admission in the Dual Degree in Petroleum Economics & Management with Mineral and Energy Economics program that is being offered by the Colorado School of Mines....
6 Pages (1500 words) Personal Statement

My Memorable Story

In the paper “My Memorable Story” the author provides an account of an event that took place in his family which is very memorable to him.... His grand mother's death from cancer is one day that most of their family members will never forget since she was a pillar in the family.... hellip; The author states that his early childhood was filled with love from everybody that surrounded him....
7 Pages (1750 words) Personal Statement

The Fasting Movement

In the paper “The Fasting Movement” the author describes a feeling of anxiety when he has done something significant in life.... That first day in high school, when you are just about to be handed your final term results, finished participating in the school's environmental club's elections....
8 Pages (2000 words) Personal Statement

The Goal to Pursue a Program in Nursing

nbsp;I completed my Bachelor of Science degree course in Chemistry, and Minor in Applied Statistics and Data analysis in the Fall of 2011 with a vision of specializing in chemistry and biochemistry.... nbsp;I completed my Bachelor of Science degree course in Chemistry, and Minor in Applied Statistics and Data analysis in the Fall of 2011 with a vision of specializing in chemistry and biochemistry.... … The paper "The Goal to Pursue a Program in Nursing" is an exceptional example of a personal statement on nursing....
1 Pages (250 words) Personal Statement
sponsored ads
We use cookies to create the best experience for you. Keep on browsing if you are OK with that, or find out how to manage cookies.
Contact Us