StudentShare
Contact Us
Sign In / Sign Up for FREE
Search
Go to advanced search...
Free

The Beer-Lambert Law - Lab Report Example

Cite this document
Summary
In the paper “The Beer-Lambert Law” the author explains the law, which says that the absorbance of a sample at a given wavelength is proportional to the absorbance of the substance at each specific wavelength, the path length which is the distance that light waves travel through the sample…
Download full paper File format: .doc, available for editing
GRAB THE BEST PAPER92.5% of users find it useful
The Beer-Lambert Law
Read Text Preview

Extract of sample "The Beer-Lambert Law"

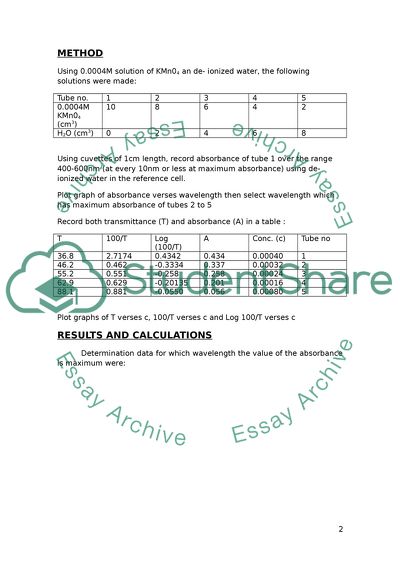
INVESTIGATION OF THE BEER – LAMBERT LAW INTRODUCTION Light radiations when passed through a colored substance, some of the light radiations may be absorbed and the remainder transmitted through the sample. Therefore, higher concentrations of colored solute, the more light radiations are absorbed and the less light radiations are transmitted through the substances. Transmittance of a substance is the ration of light intensity entering the sample denoted as (I0) to that exiting the sample denoted as (IT) at a particular wavelength. Transmittance is usually expressed as percentage: Equation 1 Nevertheless, the Absorbance is the relationship in relating the absorption of the light when it is travelling through the sample. This property is the negative logarithm of the transmittance and it is dimensionless: Equation 2 The Beer Lambert Law says that the absorbance of a sample at a given wavelength is proportional to the absorbance of the substance at each specific wavelength, the path length which is the distance that light waves travels through the sample and the concentration of the absorbing substance: Equation 3 Where, A Absorbance (dimensionless) molar absorption coefficient (L/mol/cm) l path length (cm) c concentration (mol/L) The experiment tried to prove the Beer-Lambert law by measuring the absorbance of potassium permanganate solution of different concentrations. A straight line plot should result if the solution obeys this Law. METHOD Using 0.0004M solution of KMn04 an de- ionized water, the following solutions were made: Tube no. 1 2 3 4 5 0.0004M KMn04 (cm3) 10 8 6 4 2 H2O (cm3) 0 2 4 6 8 Using cuvettes of 1cm length, record absorbance of tube 1 over the range 400-600nm (at every 10nm or less at maximum absorbance) using de- ionized water in the reference cell. Plot graph of absorbance verses wavelength then select wavelength which has maximum absorbance of tubes 2 to 5 Record both transmittance (T) and absorbance (A) in a table : T 100/T Log (100/T) A Conc. (c) Tube no 36.8 2.7174 0.4342 0.434 0.00040 1 46.2 0.462 -0.3334 0.337 0.00032 2 55.2 0.551 -0.258 0.258 0.00024 3 62.9 0.629 -0.20135 0.201 0.00016 4 88.1 0.881 -0.0550 0.056 0.00080 5 Plot graphs of T verses c, 100/T verses c and Log 100/T verses c RESULTS AND CALCULATIONS Determination data for which wavelength the value of the absorbance is maximum were: l (nm) A 600 0.044 590 0.128 580 0.115 570 0.23 560 0.271 550 0.376 540 0.432 530 0.434 520 0.431 510 0.347 500 0.321 490 0.248 480 0.134 Table 1: Absorbance at different wavelengths for tube 1 (0.4mM) Figure 1: Absorbance against wavelength for tube 1 The experiment was delayed till 400 nm because it was obvious that the maximum value of the absorbance will be achieved at 530nm as it can be shown in the table 1. So, the next measurements of absorbance and transmittance for the rest of the samples were recorded at the same wavelength of 530nm. These results are presented in the table below. Tube No. Conc. (M) A T (%) 100/T Log (100/T) 1 0.0004 0.434 36.8 2.717 0.434 2 0.00032 0.337 46.2 2.165 0.335 3 0.00024 0.258 55.2 1.812 0.258 4 0.00016 0.201 62.9 1.590 0.201 5 0.00008 0.056 88.1 1.135 0.055 Table 2: Experimental values for absorbance and transmittance for different concentrations of KMnO4 Also, table 2 includes the calculations of 100/T and Log (100/T) which are used in the following plots. To boost the elastration of how the transmittance varies for different concentration, the transmittance values and 100/T (data in table 2) versus concentration were plotted. Figure 2: Transmittance against different KMnO4 concentration Figure 3: 100/T against different KMnO4 concentration The representation of the transmittance versus concentration shows an exponential shape because the intensity of a beam of monochromatic light decreases exponentially as the concentration of absorbing substance increase arithmetically. For the same reason the plot of 100/T against concentration should be with exponential shape as well. If the previous sentence with regard to the exponential trend of the transmittance is true and if the experiment would have made with solutions more concentrate, it would be right to say that at high concentrations the value of the transmittance trends to infinite. The next plots are log (100/T) versus concentration and Absorbance versus concentration (data from table 2). If the equation 2 is true, both plots will be the same. Figure 4: Log (100/T) against different KMnO4 concentration Figure 5: Absorbance against different KMnO4 concentration DISCUSSION The aim of this experiment was to better understand the transmittance and absorbance of a substance, in other words, how it is behaves when a beam of monochromatic light passes through. After plotting the results and analyzing them, it has demonstrated the relation between transmittance and absorbance properties of a substance, in our case a solution of potassium permanganate. See equation 2. Also with this experiment, it has verified the Beer – Lambert law (equation 3), in which the relation between absorbance and concentration are directly proportional as long as the molar absorption coefficient () and path length (l) are constant (in our case these parameters were constant due to the experiment utilising the same substance, potassium permanganate, and the same size cuvettes). As a result, plotting absorbance against concentration is a straight line. It is important to mention that the Beer – Lambert Law has a number of limitations: Deviations in absorbance coefficients at high concentrations (>0.01M) due to electrostatic interactions between molecules in close proximity. If there are suspended particles in the sample, these will cause light scattering, thereby reducing the transmittance intensity. Fluorescence or phosphorescence of the sample. Changes in refractive index at high concentrations. Stray light in faulty equipment can also affect the readings. Any of these limitations do not apply to this experiment. But a significant observation has to be made looking at figure 5. The points of tubes 4 and 5 (0.00016 and 0.00008 M) do not perfectly follow a linear trend of the rest of the concentrations (it can be noticed as well in the rest of the plots). This can be explained due to a human error during the preparation of the solutions. CONCLUSION Measuring the Transmittance and Absorbance of different concentrations of potassium permanganate, it was possible to confirm the relation of these two properties. Absorbance is equal to the logarithm of 100/T. Also, it was demonstrated that at a molar absorption coefficient and path length constant, the absorbance is directly proportional to the concentration of the sample. Hence, the Beer – Lambert Law is obeyed. SOURCES: Handbook of spectroscopy by Wiley, page 1011 (available online) STANDARISATION OF POTASSIUM PERMANGANATE SOLUTION 0.02M USING FERROUS AMMONIUM SULFATE (Ammonium Iron (II) Sulfate) INTRODUCTION Titration is a volumetric analysis procedure used to determine the concentration of an acid or base solution. A chemical reaction is set up between a known volume of a solution of unknown concentration (titrate) and a solution which the concentration and the volume are known. When both solutions are reacted to the point to the number of acid equivalents equals the number of base equivalents (or vice versa), the equivalence point is reached (end-point). This point for strong acids or bases will be at pH 7, neutral. Two methods can be used to estimate the equivalence point: Using a Ph, a graph has to be made plotting the variation of the pH of the solution against the volume of added titrants. Using an indicator which is a substance that changes the color when the reaction reaches the end-point. Table 1: Schematic of a titration technique The objective of this experiment is determining the concentration of a potassium permanganate solution with the volumetric analysis technique. The titrant used was ferrous ammonium sulfate (ammonium iron (II) sulfate). The reaction between these two solutions is known to be a red-ox reaction because there is a transfer of the electrons. Whereas the Fe2+ion reduces to Fe3+ Fe2+ Fe3+ + e- Equation 1 The MnO4- ion reduces to Mn2+ MnO4- + 8 H+ + 5 e- Mn2+ + 4H2O Equation 2 The resulting red-ox equation is MnO4- + 5 Fe2+ + 8 H+ Mn2+ + 5 Fe3+ + 4H2O Equation 3 METHOD A mixture of accurately weighed 9.8g of A.R. salt and approximately 150ml of 2M bench sulfuric acid was made and shaken until all solute was fully dissolved. Then the solution was diluted with de-ionized water till the mark of the volumetric flask. 25mL of this solution of known concentration were pipette for being tritated with potassium permanganate solution of unknown concentration until the first permanent pink color. Two tritations were carried out and they should not differ by more than 0.05mL. RESULTS AND CALCULATIONS The potassium permanganate volumes for the different made tritations were: Initial V KMnO4 (cm3) Final V KMnO4 (cm3) V KMnO4 (cm3) 1st Titration 1.2 27.1 26 2nd Titration 5 32.5 26.5 3rd Titration 4.1 30.5 26.4 Average = 26.3 Table 1: Experimental volumes of the tritation and average Before determinate the concentration of the potassium permanganate solution, it is needed to make some calculations. Molar mass of the Iron Salt, FeSO4·(NH4)2SO4·6H2O, which is calculating adding the atomic mass of each compound per the number of times each compound is in the chemical formula: Chemical element Atomic mass (u) Times of element in formula Fe 56 1 S 32 2 O 16 14 N 14 2 H 1 20 Molar mass, Mr= 392 g/mol Table 2: Atomic masses for the calculation of the molar mass of the iron salt Number of moles of Iron Salt in the weighted 9.8g: The molarity of the made Iron Salt solution of 250mL (=0.25 L): The reaction ratio between the MnO4- ion and Fe2+ ion can be determinate from the equation 3. MnO4- : Fe2+ Volume tritated, V (L) 0.275 : 0.25 Molarity, M (mol/L) ? : 0.1 Ratio 1 : 5 With the next equation, it is possible calculate the concentration of the potassium permanganate solution. The needed values are previously presented. Equation 4 When the titration was completely finish, all the moles of Fe2+ reacted with all the moles of KMnO4- and the ratio between this to ions is 1:5. That means that it was need five times more moles of Fe2+ than KMnO4-. Hence: Equation 5 Substituting the equation 5 in equation 4: Equation 6 With the equation 6 and all the previous calculations, it is possible to calculate the molarity of the permanganate ion. DISCUSSION The aim of this experiment was to standardize of 0.02M potassium permanganate using the titration technique. The other used solution, with a known molarity was the ferrous ammonium sulfate. During the realization of this practical and this report, it was necessary being familiar with the red-ox reaction between these two compounds, as well as with the knowledge of molar mass, molarity, volumes and moles. Essential concepts for the calculation of the potassium permanganate solution. To regards with the experiment, three titrations were made to obtain a more accurate volume result. CLONCUSSION With the volumetric analysis procedure it was possible to determinate the concentration of a potassium permanganate, which was 0.019M SOURCES: General chemistry by Whitten Davis, page 406 (available online) Read More
Cite this document
  • APA
  • MLA
  • CHICAGO
(The Beer-Lambert Law Lab Report Example | Topics and Well Written Essays - 1854 words, n.d.)
The Beer-Lambert Law Lab Report Example | Topics and Well Written Essays - 1854 words. Retrieved from https://studentshare.org/chemistry/1791078-lab-report-beer-lamber-law-titration-and-protien
(The Beer-Lambert Law Lab Report Example | Topics and Well Written Essays - 1854 Words)
The Beer-Lambert Law Lab Report Example | Topics and Well Written Essays - 1854 Words. https://studentshare.org/chemistry/1791078-lab-report-beer-lamber-law-titration-and-protien.
“The Beer-Lambert Law Lab Report Example | Topics and Well Written Essays - 1854 Words”, n.d. https://studentshare.org/chemistry/1791078-lab-report-beer-lamber-law-titration-and-protien.
  • Cited: 2 times

CHECK THESE SAMPLES OF The Beer-Lambert Law

Legal Case Study

What is the previous law?... The previous law on the same issue was that if there was breach of contract through refusal to marry, a cause of action to file a suit for the same arises.... What is the current law?... The present law on the same issue is that civil suits for the recovery of the property which is taken on the strength of a fraudulent promise to marry can be initiated under sec.... This makes him liable to be punished according to law....
4 Pages (1000 words) Research Paper

Standardisation Of 0.02moldm-3 Potassium Permanganate Solution Using Ferrous Ammonium Sulphate (Ammonium Iron (Ii) Sulphate)

The technique for determining the concentration of an acid or a base is known as titration.... This is the process which involves carefully adding one reactant to another while at the same time measuring how much is needed for the reaction to be complete.... … The main objective of this experiment is to standardize i....
4 Pages (1000 words) Lab Report

UV-VS Spectroscopy

A qualitative analysis on the performance characteristics of a UV/VIS absorption spectrometer is important in accessing how this… In this experiment, the beer lambert law was considered to help in determining the concentration of the unknown solutions. UV-VS spectroscopy is a concept referring to absorption spectroscopy, usually through the In this experiment, there was need to introduce the students to how the UV/VIS applies in the laboratory.... Further, the beer lambert law was also considered to help in determining the concentration of the unknown solutions....
5 Pages (1250 words) Lab Report

Literature search on Sodium salicylate

According to The Beer-Lambert Law, absorbance, A can be calculated by A=ɛcl where, ɛ is the molar absorbivity, c is concentration and b is the path length (Alica B 2012).... The lambda max can be measured in many ways in the laboratory.... Using hydrotropic solubilization, Ethiraj (2012) found the lambda max to be 344nm....
1 Pages (250 words) Essay

The Concentration of Solutes Present in the Substances

Using the excel graph and The Beer-Lambert Law, the equation generated for the given points is as follows: Table 6 was drawn to reflect the difference between the absorbance rate of standard and self-made solutions.... In order to measure the calculations in the form of a graph, beer-lambert law was used after having done with the calculations....
3 Pages (750 words) Essay

Spectroscopy Method Utilized in the Lab

y utilizing a standard curve(y=mx+b),where x-values show various concentrations of the same sample with y values showing the absorbance of a given wavelength, it can be stated that the concentration is directly proportional to the absorbance, which initially was proved by beer-lambert law(Bauer et al.... hrough establishment of a standard for the copper nitrate compound and utilizing the knowledge of beer-lambert law, the % mass of the copper in the ore was attained....
2 Pages (500 words) Essay

Elements of the Partition Coefficient

The paper 'Elements of the Partition Coefficient' presents the partition coefficient which is the ratio of two-phased solute concentration.... As a constant, it is defined as the concentration of solute in solvent A divided by the concentration of solute in solvent B expressed in the formula.... hellip; In an experiment, researchers used oil and water as solvents and salicylic acid was used as solute....
7 Pages (1750 words) Research Paper

Glycolysis and Fermentation of Grape Juice

… Glycolysis and Fermentation of Grape JuiceAim the main objective of the experiment is to establish parameters of wine alcohol content and glucose level during the progress of fermentation.... Glycolysis happens prior to fermentation of grape juice.... Glycolysis and Fermentation of Grape JuiceAim the main objective of the experiment is to establish parameters of wine alcohol content and glucose level during the progress of fermentation....
4 Pages (1000 words) Assignment
sponsored ads
We use cookies to create the best experience for you. Keep on browsing if you are OK with that, or find out how to manage cookies.
Contact Us