StudentShare
Contact Us
Sign In / Sign Up for FREE
Search
Go to advanced search...
Free

Fatigue Analysis - Research Proposal Example

Cite this document
Summary
This work "Fatigue Analysis" focuses on the aspects of fatigue performance. The author takes into account compressive stress on the surface, the improvement of fatigue performance of materials. From this work it is obvious about the Basquin analysis has been performed on the S-N data of Al-7475 by different investigators. …
Download full paper File format: .doc, available for editing
GRAB THE BEST PAPER91.7% of users find it useful
Fatigue Analysis
Read Text Preview

Extract of sample "Fatigue Analysis"

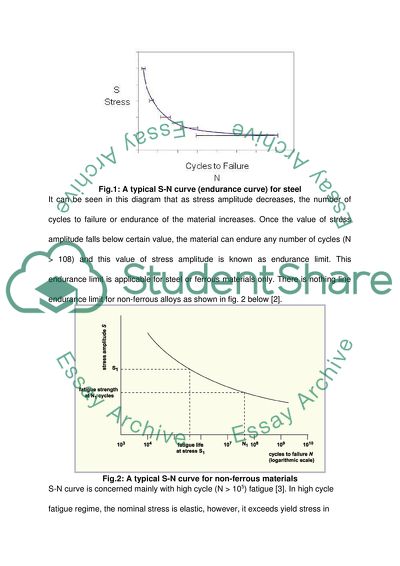
Fatigue Analysis Introduction Fatigue is a mode of fracture in which a material fractures under cyclic or repetitive loading well below its yield stress. This is vary serious mode of fracture as it occurs in catastrophic manner and therefore, requires due care in design as well as in service monitoring of components. Cyclic or repetitive loading occurs in many applications like rotating equipments, thermal cyclic loading etc. It is relevant to bring out two important aspects of fatigue fracture – 1) It involves cyclic or repetitive loading and 2) The applied load is well below the yield stress. The important question to ask is why material fails well below its yield strength. This is because even though the nominal load on the component may be well below its yield stress, due to different kind of inhomogeneity and stress raisers like inclusions, cracks etc., the actual stress level in many regions exceed the yield stress and plastic deformation occurs on localized level, which keeps accumulating during each of the repetitive loading – unloading cycle and culminates into fracture. Fatigue behaviour of a material is historically measured and presented in the form of S – N data or S – N curve. Here S is abbreviation for “Stress” and N is abbreviation for “No of Cycles to Failure”. This is usually plotted on a semi – Log scale with x-axis being Log of No. of cycles to failure and y-axis is the corresponding stress amplitude (S). Fig. 1 below presents a typical S-N curve or endurance curve for ferrous alloys or steel [1]. Fig.1: A typical S-N curve (endurance curve) for steel It can be seen in this diagram that as stress amplitude decreases, the number of cycles to failure or endurance of the material increases. Once the value of stress amplitude falls below certain value, the material can endure any number of cycles (N > 108) and this value of stress amplitude is known as endurance limit. This endurance limit is applicable for steel or ferrous materials only. There is nothing line endurance limit for non-ferrous alloys as shown in fig. 2 below [2]. Fig.2: A typical S-N curve for non-ferrous materials S-N curve is concerned mainly with high cycle (N > 105) fatigue [3]. In high cycle fatigue regime, the nominal stress is elastic, however, it exceeds yield stress in localized region. The S – N curve is described by Basquin’s equation, which is given below. Nf(a)b = C ......... (1) Where, Nf = No. Of cycles till fracture a = Stress Amplitude b, c are empirical constants Here the mean stress is zero i.e. the loading is tensile and compressive in +a range. Subsequently attempts were made by different investigators to account for non-zero mean stress level and some important equations incorporating non-zero mean stress level are the following. Soderberg (1939) a e[1-(m / y)] Modified Goodman (1899) a e [1-(m / TS)] Gerber (1874) a e[1-(m / TS)2] Where, a = Fatigue strength with mean stress m e = Fatigue strength with zero mean stress y = yield strength ts = tensile strength Stages of Fatigue Failure Fatigue failure occurs in following stages (1) Crack Initiation – During this stage there is early development of fatigue damage in material. This damage can be removed by thermal annealing as this requires dissipation of accumulated residual stress in localized regions. (2) Slip Band Crack Growth – This involves deepening of initial crack on planes of high shear stress. This stage is termed as Stage I Crack Growth. (3) Crack Growth on Planes of High Shear Stress – This involves growth of well defined crack in the direction normal to maximum tensile stress. This stage is termed as Stage II crack growth. (4) Ultimate Ductile Fracture – Once the crack has reached a length that it makes the remaining cross-section unsuitable to bear the applied load, the components fractures. Basquin Analysis of the S – N Data Basquin analysis of S-N data for Al-7475 reported by different investigators is presented in the following section and the Basquin’s equation has been derived for each case. Basquin’s equation is written as Nf(a)b = C ........................ (1) Taking Log of both sides, one gets Log  = b log Nf + log c Therefore, plotting the S-N data on a Log – Log plot and drawing the best fit line through these points gives, values of ‘b’ and ‘c’ as that of the slope of the line and intercept respectively. This methodology was utilized for performing Basquin analysis on the S-N data provided in the five different cases [3 – 7] and the analysis is presented in the following section. Case – I: Lee Adagbonyin (2008) Table (1) Stress (MPa) Nf Log  Log N 186 3.3*106 2.269513 6.518514 220 3.3*106 2.342423 6.518514 250 5.7*105 2.39794 5.755875 270 6.9*104 2.431364 4.838849 290 5.2*104 2.462398 4.716003 340 3.3*104 2.531479 4.518514 Table 1: S – N Data for Fatigue of Al-7475 in Air [3] This data is presented in the form of S – N curve in Fig. 3. From this S – N curve it can be seen that fatigue strength of Al-7475 goes on decreasing with increasing number of cycle to failure and vice – versa. Also, this trend is monotonic and there is nothing like endurance limit, which does not exist for non-ferrous alloys. This trend is on the expected line. Analysis was performed on this data to determine Basquin’s equation for this alloy. For this purpose a log – log plot was made between fatigue strength and number of cycles to failure. A best – fit line was drawn through the data points. This analysis was performed using MS – Office Excel. The chart, the best – fit line and equation of the best – fit line is presented in Fig. 4. The Best fit Equation is log  = (-0.093)log Nf + 2.92 Comparing this with Log  = b log Nf + log c We get, b = -0.093 and c = 102.92 = 832 MPa Therefore, Basquin’s Equations can be written as  = (832)*(Nf)-0.093 In this equation, the exponent of Nf, the number of cycles to failure is negative. This means more is the number of cycles to failure lower will be the fatigue strength and vice versa. This confirms to the data presented in Table 1 and also obvious from the common sense. Basquin analysis for remaining four cases was also made in similar manner and is presented in the following sections. Case – II: Verma B.B et al (2000) Table.(App.2) Stress (MPa) Nf Log  Log N 195 4.47*106 2.290035 6.650308 200 2.95*106 2.30103 6.469822 225 3.00*105 2.352183 5.477121 250 1.86*105 2.39794 5.269513 280 1.20*105 2.447158 5.079181 Table 2: S – N Data for Fatigue of Al-7475 in Air [4] This data is presented in the form of S – N curve in Fig. 5. The Best fit Equation is log  = (-0.086)log Nf + 2.858 Comparing this with Log  = b log Nf + log c We get, b = -0.086 and c = 102.858 = 721 MPa Therefore, Basquin’s Equations can be written as  = (721)*(Nf)-0.086 Case – III: Richard Crossland (2003) Table.(App.5) (Air data) Stress (MPa) Nf Log  Log N 195 2.4*106 2.290035 6.380211 225 4.0*105 2.352183 5.60206 250 3.7*105 2.39794 5.568202 280 1.2*105 2.447158 5.079181 The Best fit Equation is log  = (-0.119)log Nf + 3.049 Comparing this with Log  = b log Nf + log c We get, b = -0.119 and c = 103.049 = 1119 MPa Therefore, Basquin’s Equations can be written as  = (1119)*(Nf)-0.119 Case – IV: Richard Crossland (2003) Table. (3.5% NaCl Solution) (App.3) Stress (MPa) Nf Log of Stress () Log of Nf 150 1.27*105 2.176091 5.103804 200 7.25*104 2.30103 4.860338 250 1.21*104 2.39794 4.082785 300 1.18*104 2.477121 4.071882 350 7.61*103 2.544068 3.881385 400 1.14*103 2.60206 3.056905 The Best fit Equation is log  = (-0.205)log Nf + 3.273 Comparing this with Log  = b log Nf + log c We get, b = -0.205 and c = 103.273 = 1875 MPa Therefore, Basquin’s Equations can be written as  = (1875)*(Nf)-0.205 Case – V: Edger A. S., Jr., and Gerd lutjering (1979) Table.(App.4) Stress (MPa) Nf Average Nf Log of Stress () Log of Nf 210 8.9*106 8.9*106 2.322219 6.94939 220 9.8*106, 1.3*106, 1.7*106 4.3*106 2.342423 6.633468 230 6.2*106 6.2*106 2.361728 6.792392 250 9.0*105, 6.1*106 3.5*106 2.39794 6.544068 290 9.0*105, 6.1*106 3.5*106 2.462398 6.544068 320 2.9*105, 2.4*105 2.6*105 2.50515 5.414973 360 8.5*104, 1.2*105 1.0*105 2.556303 5 The Best fit Equation is log  = (-0.108)log Nf + 3.102 Comparing this with Log  = b log Nf + log c We get, b = -0.108 and c = 103.102 = 1265 MPa Therefore, Basquin’s Equations can be written as  = (1265)*(Nf)-0.108 Scatter in Data The scatter in fatigue performance of AL-7475 as reported by different investigators is clearly seen in Fig. 13, which shows S-N curve of this alloy in air as reported by different investigators. There is significant scatter in the data as displayed by the values of b and c in different cases. However, scatter in S-N data to the extent of one order of magnitude (in no. Of cycles to failure) is something that is on expected line. This is because the measurements for N are performed on small number of specimen and therefore, a large scatter is expected from statistical consideration. Values of ‘c’ and ‘b’ derived from data reported by different investigators. Sl. No. Investigator c b 1 Lee Adagbonyin (2008) 832 -0.093 2 Verma B.B et al (2000) 721 -0.086 3 Richard Crossland (2003) 1119 -0.119 4 Edger A. S., Jr. (1979) 1265 -0.108 It can be seen that scatter in the values of ‘c’ and ‘b’ is within expected band and this scatter is on the account of statistical scatter given the fact that less number of samples are tested for establishing S-N curve for a material. Fatigue Life in Different Media The service environment considerably affects fatigue life. This is because, fatigue cracks generally start from the surface and in corrosive media is present then it will accelerate growth rate of crack. Hence it is natural to expect that fatigue life will deteriorate in corrosive media. This is very much like stress – corrosion cracking (SCC). In SCC crack growth rate gets accelerated in presence of stress and corrosive media. Similarly in fatigue in corrosive media is also very much the same situation. Environmentally Enhanced Fatigue Crack Propagation is an area of active interest and lot of work has been done and reported on fatigue performance of different metals and alloys [7-11]. It has been reported that fatigue performance of aluminium alloys gets deteriorated in moist atmosphere. Fig. 14 shows fatigue behaviour of Al-7475 in air and in NaCl. It can be seen that this alloy shows much inferior fatigue performance in NaCl as compared to that in air. This is because in NaCl solution the Cl- ions hinder formation of the passive oxide layer on the surface of aluminium alloys which protect these alloys in air and thus accelerates growth rate of cracks. Further once crack has formed the pH of the NaCl solution trapped in the crack drops substantially and further increases growth rate of the cracks. This is the reason why fatigue performance of aluminium alloys is much inferior in NaCl as compared to the same in air. This is evident from the value of ‘b’ as well which is -0.086 and -0.205 in air and NaCl respectively. Higher –ve value of ‘b’ implies that with increase in fatigue life there will be larger drop in fatigue strength. Fatigue behaviour of Al-7475 vis a vis that of Other Al –Alloys Fatigue performance of different aluminium alloys like Al-7475, Al-7075, Al-2017 and Al-2024 has been compared by Verma B. B. (2000). They have shown that fatigue performance of AL-7475 was the best among these alloys. This difference in fatigue behaviour is attributed mainly to the chemistry control of the material and the heat treatment given to it which resulted in highly homogeneous precipitation in this material. A homogeneous structure has lesser number of stress raiser sites and hence results in better fatigue performance. Improvement in Fatigue Performance There are many ways in which fatigue performance of a material can be improved. The main focus is on two things – 1) Make the material as homogeneous as possible and in a polycrystalline material, this can be done by microstructural refining or grain refining. 2) Surface modification – Fatigue cracks mostly initiate from surface and therefore, one can ply with surface finish, state of stress on surface (tensile / compressive) and surface coatings. Surface finish leads to lesser no. of crack initiation sites. A compressive stress on surface does not allow crack initiation and / growth from the surface. A good coating protects the material from harsh media and thus either of these or a combination of these methods can be used to improve fatigue performance of materials. Some of the processes which are commonly used for improving fatigue performance of materials are the following. (i) Sand Blasting – This is a very old practice for improving surface finish and introducing compressive stress into surface layer. Both of these have positive effect on fatigue performance. This is because, improved surface finish reduces the probability of crack initiation on surface. Further, whatever crack tries to grow from the surface is suppressed by presence of residual compressive stress field. However, sand blasting is not a clean process and introduces lot of suspended particulate matter on shop floor, which is harmful for workers. Therefore, sand blasting is now almost discontinued and this has been replaced with metal particle blasting. (ii) Laser Shot Pinning – This is similar to sand blasting except that here the surface is blasted with photons and not with sand. Surface to be treated is shined with high intensity short pulses of laser, which ablates a thin layer of material and the ablating particles exert lot of recoil pressure on the underlying substrate and thus introduce compressive stress in the substrate, thus fatigue performance is improved. However, this process is still within the confines of laboratories. (iii) Surface Coating – When suitable surface coating is applied then it isolates the material from hostile media and thus improves fatigue performance of the material. (iv) Grain Refining – Grain refining means offering circuitous path to the growing fatigue crack and a longer crack growth path means slower fatigue crack growth. This way a fine grained microstructure always offers improved fatigue performance. How the microstructure can be defined depends on the material system. In many system it can be done by mechanical working, in many systems by only suitable heat treatment and in many systems by a suitable combination of the two. (v) Component Design – Component design also plays great role in fatigue life of a component. One should avoid sharp corners or other stress raisers in the component for longer life of component under fatigue loading. Conclusions: Basquin analysis has been performed on the S-N data of Al-7475 by different investigators. It was found that there is small scatter within one order of magnitude in the S-N curve of this alloy as reported by different investigators. Further fatigue performance of Al-7475 is much inferior in 3.5% NaCl solution than that in air. A brief discussion on different methods to improve fatigue life has also been presented. References: [1] http://www.materialsengineer.com/CA-fatigue.htm [2] http://www.ami.ac.uk/courses/topics/0124_seom/index.html [3] Lee Adagbonyin (2008) Table (1) [4] Verma B.B et al, “Study of fatigue behaviour of Al-7475”. Bull. Mater. Sci. Vol. 24, No. 2, April 2001, pp 231 - 236 [5] Richard Crossland (2003) Table.(App.5) (Air data and NaCl Data) [6] Edger A. S., Jr., and Gerd lutjering (1979) Table.(App.4) [7] A. Hartman, F. J. Jacobs, A. Nederveen and P. deRijk, NLR TN/M 2182, 1967 [8] A. Hartman, Intl. J. Fract. Mech. 1(3), 167 (1965) [9] R. P. Wei, Eng. Fract. Mecj. 1, 633 (1970) [10] J. Barsom, Eng. Fract. Mech 3(1), 15 (1971) [11] E. J. Imhof and J. M. Barsom, ASTM STP 536, 1973, p182 Read More
Tags
Cite this document
  • APA
  • MLA
  • CHICAGO
(Fatigue Analysis Research Proposal Example | Topics and Well Written Essays - 2500 words, n.d.)
Fatigue Analysis Research Proposal Example | Topics and Well Written Essays - 2500 words. https://studentshare.org/technology/1747656-fatigue-analysis
(Fatigue Analysis Research Proposal Example | Topics and Well Written Essays - 2500 Words)
Fatigue Analysis Research Proposal Example | Topics and Well Written Essays - 2500 Words. https://studentshare.org/technology/1747656-fatigue-analysis.
“Fatigue Analysis Research Proposal Example | Topics and Well Written Essays - 2500 Words”. https://studentshare.org/technology/1747656-fatigue-analysis.
  • Cited: 0 times

CHECK THESE SAMPLES OF Fatigue Analysis

High Cocoa Polyphenol Rich Chocolate in Reducing Chronic Fatigue Syndrome

It is fair to mention that there is no generally accepted definition of fatigue, however, in most literary works, it can be interpreted as “a combination of symptoms including: impaired performance (loss of attentiveness, slower reaction times, impaired judgment, poorer performance on skilled control tasks and increased probability of falling asleep) and subjective feelings of drowsiness or tiredness”3.... The problem of fatigue syndrome is extremely important since it leads to such negative consequences as decreased concentration of the person, aggravated functions of memory, slow response and reaction, enhanced irritability and depressions, high somnolence, frequent changes of mood, sharper susceptibility to the influence of alcohol and high risks of diseases....
8 Pages (2000 words) Essay

M&Ms Project Report

The process of Sampling In Statistical analysis the most important part is to collect any data which is called Sampling.... In our analysis for example if we want to evaluate the CI we can infer that the proportion of blue candies in lying between 0.... 1.... The entire goal of sampling is to draw a set of data that will represent the true population or all the incidences of total occurences of a population and that too without bias i....
4 Pages (1000 words) Assignment

Human Postural Sway

This paper explores whether anterior-posterior (AP) sway of center of pressure (COP) can be linearly applied to predict the AP response of a weak posterior directed mechanical perturbation (tug or pull at the waist) in a healthy subject and effects of muscle fatigue on postural control system.... In this paper we present the observation where 10 healthy subjects of mean age 25 are examined to find out a relationship between postural sway during quite-stance and perturbation with and without muscle fatigue....
7 Pages (1750 words) Essay

Fatigue: an Overly-Emotional State of Mind

fter being satisfied with the level of analysis and an understanding of the behavioral patterns and reactions of each participant, the study group will be deprived of several hours of restful sleep over an extended period of time.... In the paper “fatigue: an Overly-Emotional State of Mind” to conduct a study of this manner, a large group of people would need to be examined.... hellip; The author states that choosing people with the same overall qualities such as those mentioned will lower the chances of external causes of stress or fatigue causing emotional or irrational behavior....
3 Pages (750 words) Assignment

Reaction Time of Firefighters

That data were analyzed using a 3 (Shift Type: Day or Evening or 24-Hour) X 2 (Time of Shift: Beginning or End) between-subjects analysis of Variance (ANOVA) and within-subjects ANOVA.... In order to test and prove this assumption, the data was analysed using one way analysis of variance....
6 Pages (1500 words) Research Paper

Course Project

nalysisAn analysis of the study of ABC Company reveals that the performance of employees and their work patterns is influenced by four major factors.... Finally, there is the need to tackle occupational health and safety issues like fatigue.... Several factors have been studied and known to affect performance of employees....
2 Pages (500 words) Research Paper

Effects of Fatigue, Stress, Drug Abuse

For there to be any noticeable progress in the workplace in terms… This paper looks at the causes and effects of fatigue, stress, drug abuse and alcoholism and how as a manager of the company and the company Issues such as reduced productivity and heightened risks to injury in the work environment can all result from the aforementioned issues, dealing with them and preventing the engagement of employees to them is imperative.... Work related injuries are on the increase and are always recorded high when most workers work overtime and have less break to reduce the fatigue or engage in activities that can reduce the levels of stress....
4 Pages (1000 words) Essay

De Havilland Comet

This paper "De Havilland Comet - the First Produced Commercial Jetliner" focuses on the jetliner that was designed, developed and manufactured by De Havilland at the Hertfordshire headquarters in the United Kingdom.... De Havilland Comet 1 prototype flew on 27 July 1949 for the first time.... nbsp; … The flight was a great advancement in aerodynamics, performance and materials....
5 Pages (1250 words) Assignment
sponsored ads
We use cookies to create the best experience for you. Keep on browsing if you are OK with that, or find out how to manage cookies.
Contact Us