StudentShare
Contact Us
Sign In / Sign Up for FREE
Search
Go to advanced search...
Free

Whether the R&M Expense of the Diesel Trucks Is More than the Gasoline-Powered Trucks - Statistics Project Example

Cite this document
Summary
"Whether the R&M Expense of the Diesel Trucks Is More than the Gasoline-Powered Trucks" paper argues that overall the diesel trucks have produced savings in repair and maintenance expenses and the relationship between R&M expense and mileage driven is not broken-downed…
Download full paper File format: .doc, available for editing
GRAB THE BEST PAPER96.8% of users find it useful
Whether the R&M Expense of the Diesel Trucks Is More than the Gasoline-Powered Trucks
Read Text Preview

Extract of sample "Whether the R&M Expense of the Diesel Trucks Is More than the Gasoline-Powered Trucks"

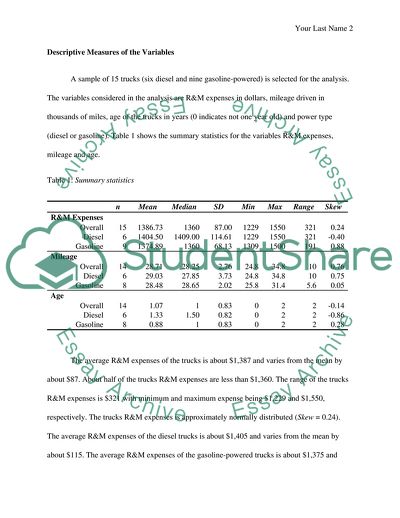
ECON 221: Empirical Methods In Economics- Fall December 19, The Project Franks Poultry maintains a fleet of trucks. After reviewing the repair and maintenance bills for the truck, the manager of Franks Poultry observed that the diesel trucks appeared to be more expensive to repair and maintain (R&M) than the gasoline-powered trucks plus they cost more to purchase. The manager also noticed that there was no apparent relationship between a plot of R&M expense and mileage driven, and there appeared a negative correlation with exception for the high expense for a Truck. In previous years, there had always been a clear positive correlation between R&M expense and miles driven. The management at Franks was disappointed that the diesel trucks have not produced savings in repair and maintenance expense and it is puzzled by the breakdown in the relationship between R&M expense and mileage driven. Problem Statement Whether the R&M expense of the diesel trucks is more than the gasoline-powered trucks, and if the relationship between R&M expense and mileage driven break-downed. Descriptive Measures of the Variables A sample of 15 trucks (six diesel and nine gasoline-powered) is selected for the analysis. The variables considered in the analysis are R&M expenses in dollars, mileage driven in thousands of miles, age of the trucks in years (0 indicates not one year old) and power type (diesel or gasoline). Table 1 shows the summary statistics for the variables R&M expenses, mileage and age. Table 1: Summary statistics n Mean Median SD Min Max Range Skew R&M Expenses Overall 15 1386.73 1360 87.00 1229 1550 321 0.24 Diesel 6 1404.50 1409.00 114.61 1229 1550 321 -0.40 Gasoline 9 1374.89 1360 68.13 1309 1500 191 0.88 Mileage Overall 14 28.71 28.25 2.76 24.8 34.8 10 0.76 Diesel 6 29.03 27.85 3.73 24.8 34.8 10 0.75 Gasoline 8 28.48 28.65 2.02 25.8 31.4 5.6 0.05 Age Overall 14 1.07 1 0.83 0 2 2 -0.14 Diesel 6 1.33 1.50 0.82 0 2 2 -0.86 Gasoline 8 0.88 1 0.83 0 2 2 0.28 The average R&M expenses of the trucks is about $1,387 and varies from the mean by about $87. About half of the trucks R&M expenses are less than $1,360. The range of the trucks R&M expenses is $321 with minimum and maximum expense being $1,229 and $1,550, respectively. The trucks R&M expenses is approximately normally distributed (Skew = 0.24). The average R&M expenses of the diesel trucks is about $1,405 and varies from the mean by about $115. The average R&M expenses of the gasoline-powered trucks is about $1,375 and varies from the mean by about $68. Thus, there appears that the R&M expense of the diesel trucks is higher as compared to the gasoline-powered trucks. The average mileage of the trucks is about 28,710 miles and varies from the mean by about 2,760 miles. About half of the truck mileage is less than 28,250 miles. The range of the truck mileage is 10,000 miles with minimum and maximum mileage being 24,800 miles and 34,800 miles, respectively. The truck mileage is slightly positively skewed (Skew = 0.76). The average mileage of the diesel trucks is about 29,030 miles and varies from the mean by about 3,730 miles. The average mileage of the gasoline-powered trucks is about 28,480 miles and varies from the mean by about 2,020 miles. Thus, there appears that the mileage of the diesel trucks is slightly higher as compared to the gasoline-powered trucks. The average age of the trucks is about 1.07 years and varies from the mean by about 0.83 years. About half of the trucks age is less than 1 year. The range of the trucks age is 2 years with minimum and maximum age being 1 year and 2 years, respectively. The trucks age is approximately normally distributed (Skew = -0.14). The average age of the diesel trucks is about 1.33 years and varies from the mean by about 0.82 years. The average age of the gasoline-powered trucks is about 0.88 years and varies from the mean by about 0.83 years. Thus, there appears that the age of the diesel trucks is more as compared to the gasoline-powered trucks. Figure 1 shows the scatter diagram between R&M expenses and mileage driven. As shown in the scatter diagram, there appears no apparent relationship between R&M expenses and mileage driven. The correlation coefficient value of 0.002 indicates that there is no linear relationship between R&M expenses and mileage driven. With the notable exception for the high expense observation for Truck 2, the correlation coefficient value of -0.494 indicates that there is a moderately strong negative linear relationship between R&M expenses and mileage driven. Figure 1: Scatter diagram showing the relationship between R&M expenses and mileage driven Figure 2: Scatter diagram showing the relationship between R&M expenses and age Figure 2 shows the scatter diagram between R&M expenses and age. As shown in the scatter diagram, there appears a positive relationship between R&M expenses and age. The correlation coefficient value of 0.683 indicates that there is a strong positive linear relationship between R&M expenses and age. With the notable exception for the high expense observation for Truck 2, the correlation coefficient value of -0.813 indicates that there is a very strong positive linear relationship between R&M expenses and age. The correlation coefficient value of -0.636 indicates that there is a strong negative linear relationship between mileage driven and age. With the notable exception for the high expense observation for Truck 2, the correlation coefficient value of -0.802 indicates that there is a very strong negative linear relationship between mileage driven and age. Proposed Empirical Models Regression Model 1 The results of the multiple regression analysis of R&M Expenses on mileage, age and diesel (diesel or gasoline) are presented in below table 2. The regression model is given by: R&M Expenses = 437.40 + 28.52 (Mileage) +143.87(Age) – 52.23(Diesel) The regression coefficient of mileage of 28.52 indicates that an additional thousand miles driven by truck increases the R& M expenses by about $28.52, one average given other factors (age and diesel) are constant. The regression coefficient of age of 143.87 indicates that an additional year increase in truck age increases the R& M expenses by about $143.87, one average given other factors (mileage and diesel) are constant. The regression coefficient of diesel of -52.23 indicates that a diesel truck reduces the R&M expenses by about $52.23, on average, as compared to a gasoline-powered truck given other factors (mileage and age) are constant. The value of the coefficient of determination, R2 of 0.854 suggests that the variables mileage, age and diesel explain about 85.4% of the variation in truck R& M expenses. Thus, the overall fit of the model is very good. The Adjusted R2 value of 0.810 also suggests very good fit for the data. Table 2: Multiple regression of R&M Expenses on mileage, age and diesel SUMMARY OUTPUT Regression Statistics Multiple R 0.924 R Square 0.854 Adjusted R Square 0.810 Standard Error 39.355 Observations 14 ANOVA   df SS MS F Significance F Regression 3 90333.08 30111.03 19.44 0.0002 Residual 10 15488.35 1548.83 Total 13 105821.43         Coefficients Standard Error t Stat P-value Lower 95% Upper 95% Intercept 437.399 170.50 2.57 0.0281 57.51 817.29 Mileage 28.502 5.54 5.14 0.0004 16.15 40.85 Age 143.875 19.16 7.51 0.0000 101.17 186.57 Diesel -52.231 24.01 -2.18 0.0547 -105.72 1.26 Assumptions The histogram of the standardized residuals (See Appendix B) indicates that there are no outliers and the histogram is roughly symmetric. Thus, the assumption that the errors (residuals) are normally distributed is met. The plots of residuals against X (mileage, age or diesel) show no pattern in the residuals, as we move from left to right. Thus, the assumption that the errors have constant variance is met. Test for overall significance The null and alternate hypotheses are H0: βMileage = βAge = βDiesel = 0 (Regression model is statistically not significant.) H1: At least one of the βk is nonzero. (Regression model is statistically significant.) The selected level of significance, α is 0.05. The selected test is the F test for overall significance. The decision rule will be Reject H0 if p ≤ 0.05, otherwise, do not reject H0. The test statistic (df1, df2) and p-value are F(3, 10) = 19.44 p-value = 0.0002 Decision: Reject H0, as p-value = 0.0002 < 0.05 Conclusion: Regression model is statistically significant. Test for the significance of mileage The null and alternate hypotheses are H0: βMileage = 0 (Coefficient of mileage is 0.) H1: βMileage ≠ 0 (Coefficient of mileage is different from 0.) (Two-tailed test) The selected level of significance, α is 0.05. The selected test is the t test for predictor significance. The decision rule will be Reject H0 if p ≤ 0.05, otherwise, do not reject H0. The test statistic (df) and p-value (two-tailed) are t(10) = 5.14 p-value (two-tailed) = 0.0004 Decision: Reject H0, as p-value = 0.0004 < 0.05 Conclusion: Truck mileage significantly predicts R&M Expenses. Test for the significance of age The null and alternate hypotheses are H0: βAge = 0 (Coefficient of age is 0.) H1: βAge ≠ 0 (Coefficient of age is different from 0.) (Two-tailed test) The selected level of significance, α is 0.05. The selected test is the t test for predictor significance. The decision rule will be Reject H0 if p ≤ 0.05, otherwise, do not reject H0. The test statistic (df) and p-value (two-tailed) are t(10) = 7.51 p-value (two-tailed) < 0.0001 Decision: Reject H0, as p-value < 0.0001 Conclusion: Truck age significantly predicts R&M Expenses. Hypothesis Test whether the diesel trucks have lower R&M expenses The null and alternate hypotheses are H0: βDiesel ≥ 0 (The diesel trucks have not lower R&M expenses.) H1: βDiesel < 0 (The diesel trucks have lower R&M expenses.) (left-tailed test) The selected level of significance, α is 0.05. The selected test is the t test for predictor significance. The decision rule will be Reject H0 if p ≤ 0.05, otherwise, do not reject H0. The test statistic (df) and p-value (one-tailed) are t(10) = -2.18 p-value (left-tailed) = 0.0547/2 = 0.0273 Decision: Reject H0, as p-value = 0.0273 < 0.05 Conclusion: The diesel trucks have lower R&M expenses. Regression Model 2 The results of the multiple regression analysis of R&M Expenses on mileage, age and diesel (diesel or gasoline) excluding Truck 2 are presented in below table 3. The regression model is given by: R&M Expenses = 698.61 + 19.86 (Mileage) +126.60(Age) – 54.12(Diesel) The regression coefficient of mileage of 19.86 indicates that an additional thousand miles driven by truck increases the R& M expenses by about $19.86, one average given other factors (age and diesel) are constant. The regression coefficient of age of 126.60 indicates that an additional year increase in truck age increases the R& M expenses by about $126.60, one average given other factors (mileage and diesel) are constant. The regression coefficient of diesel of -54.12 indicates that a diesel truck reduces the R&M expenses by about $54.12, on average, as compared to a gasoline-powered truck given other factors (mileage and age) are constant. The value of the coefficient of determination, R2 of 0.833 suggests that the variables mileage, age and diesel explain about 83.3% of the variation in truck R& M expenses. Thus, the overall fit of the model is very good. The Adjusted R2 value of 0.777 also suggests very good fit for the data. Table 3: Multiple regression of R&M Expenses on mileage, age and diesel excluding Truck 2 SUMMARY OUTPUT Regression Statistics Multiple R 0.913 R Square 0.833 Adjusted R Square 0.777 Standard Error 37.908 Observations 13 ANOVA   df SS MS F Significance F Regression 3 64475.90 21491.97 14.96 0.0008 Residual 9 12933.03 1437.00 Total 12 77408.92         Coefficients Standard Error t Stat P-value Lower 95% Upper 95% Intercept 698.614 255.62 2.73 0.0231 120.36 1276.87 Mileage 19.859 8.40 2.37 0.0422 0.86 38.85 Age 126.602 22.55 5.61 0.0003 75.59 177.61 Diesel -54.125 23.17 -2.34 0.0443 -106.54 -1.71 Assumptions The histogram of the standardized residuals (See Appendix C) indicates that there are no outliers and the histogram is roughly symmetric. Thus, the assumption that the errors (residuals) are normally distributed is met. The plots of residuals against X (mileage, age or diesel) show no pattern in the residuals, as we move from left to right. Thus, the assumption that the errors have constant variance is met. Test for overall significance The null and alternate hypotheses are H0: βMileage = βAge = βDiesel = 0 (Regression model is statistically not significant.) H1: At least one of the βk is nonzero. (Regression model is statistically significant.) The selected level of significance, α is 0.05. The selected test is the F test for overall significance. The decision rule will be Reject H0 if p ≤ 0.05, otherwise, do not reject H0. The test statistic (df1, df2) and p-value are F(3, 9) = 14.96 p-value = 0.0008 Decision: Reject H0, as p-value = 0.0008 < 0.05 Conclusion: Regression model is statistically significant. Test for the significance of mileage The null and alternate hypotheses are H0: βMileage = 0 (Coefficient of mileage is 0.) H1: βMileage ≠ 0 (Coefficient of mileage is different from 0.) (Two-tailed test) The selected level of significance, α is 0.05. The selected test is the t test for predictor significance. The decision rule will be Reject H0 if p ≤ 0.05, otherwise, do not reject H0. The test statistic (df) and p-value (two-tailed) are t(9) = 2.37 p-value (two-tailed) = 0.0422 Decision: Reject H0, as p-value = 0.0422 < 0.05 Conclusion: Truck mileage significantly predicts R&M Expenses. Test for the significance of age The null and alternate hypotheses are H0: βAge = 0 (Coefficient of age is 0.) H1: βAge ≠ 0 (Coefficient of age is different from 0.) (Two-tailed test) The selected level of significance, α is 0.05. The selected test is the t test for predictor significance. The decision rule will be Reject H0 if p ≤ 0.05, otherwise, do not reject H0. The test statistic (df) and p-value (two-tailed) are t(9) = 5.61 p-value (two-tailed) = 0.0003 Decision: Reject H0, as p-value = 0.0003 < 0.05 Conclusion: Truck age significantly predicts R&M Expenses. Hypothesis Test whether the diesel trucks have lower R&M expenses The null and alternate hypotheses are H0: βDiesel ≥ 0 (The diesel trucks have not lower R&M expenses.) H1: βDiesel < 0 (The diesel trucks have lower R&M expenses.) (left-tailed test) The selected level of significance, α is 0.05. The selected test is the t test for predictor significance. The decision rule will be Reject H0 if p ≤ 0.05, otherwise, do not reject H0. The test statistic (df) and p-value (one-tailed) are t(9) = -2.34 p-value (left-tailed) = 0.0443/2 = 0.0221 Decision: Reject H0, as p-value = 0.0221 < 0.05 Conclusion: The diesel trucks have lower R&M expenses. The Adjusted R2 value of 0.810 for the regression model 1 is higher as compared to the adjusted R2 value of 0.777 for the regression model 2. Thus, regression model 2 provides better fir for the data as compared to the regression model 1. Conclusion In conclusion, the results of the regression analysis suggested that a diesel truck reduces the R&M expenses by about $52.23, on average, as compared to a gasoline-powered truck implying R&M expense of the diesel trucks is not more than the gasoline-powered trucks. Furthermore, the results of the regression analysis suggested that an additional thousand miles driven by truck increases the R& M expenses by about $28.52, one average, implying that R&M expenses have a direct (positive) relationship with mileage driven. Thus, overall the diesel trucks have produced savings in repair and maintenance expense and the relationship between R&M expense and mileage driven is not broken-downed. Works Cited Genevieve, Briand and R. Carter Hill. Using Excel for Principles of Econometrics. 4th. New York: John Willey & Sons, Inc, 2012. Electronic. Appendix A: Summary Statistics and Correlation Matrix Summary Statistics: Overall   R&M Expenses Mileage Age Mean 1386.73 28.71 1.07 Standard Error 22.46 0.74 0.22 Median 1360 28.25 1 Mode 1350 #N/A 1 Standard Deviation 87.00 2.76 0.83 Sample Variance 7569.21 7.63 0.69 Kurtosis -0.44 0.27 -1.51 Skewness 0.24 0.76 -0.14 Range 321 10 2 Minimum 1229 24.8 0 Maximum 1550 34.8 2 Count 15 14 14 Summary Statistics: Diesel   R&M Expenses Mileage Age Mean 1404.50 29.03 1.33 Standard Error 46.79 1.52 0.33 Median 1409.00 27.85 1.50 Mode #N/A #N/A 2 Standard Deviation 114.61 3.73 0.82 Sample Variance 13136.30 13.94 0.67 Kurtosis -0.36 -0.62 -0.30 Skewness -0.40 0.75 -0.86 Range 321 10 2 Minimum 1229 24.8 0 Maximum 1550 34.8 2 Count 6 6 6 Summary Statistics: Gasoline-powered   R&M Expenses Mileage Age Mean 1374.89 28.48 0.88 Standard Error 22.71 0.71 0.30 Median 1360 28.65 1 Mode 1310 #N/A 0 Standard Deviation 68.13 2.02 0.83 Sample Variance 4641.36 4.07 0.70 Kurtosis -0.19 -1.25 -1.39 Skewness 0.88 0.05 0.28 Range 191 5.6 2 Minimum 1309 25.8 0 Maximum 1500 31.4 2 Count 9 8 8 Correlation Matrix: All trucks   R&M Expenses Mileage Mileage 0.0020 Age 0.6825 -0.6355 Correlation Matrix: Excluding Truck 2   R&M Expenses Mileage Mileage -0.4937 Age 0.8133 -0.8017 Appendix B: Residual Plots and Standard Residuals Histogram for Regression Model 1 Appendix C: Residual Plots and Standard Residuals Histogram for Regression Model 2 Read More
Cite this document
  • APA
  • MLA
  • CHICAGO
(Whether the R&M Expense of the Diesel Trucks Is More than the Statistics Project Example | Topics and Well Written Essays - 2500 words, n.d.)
Whether the R&M Expense of the Diesel Trucks Is More than the Statistics Project Example | Topics and Well Written Essays - 2500 words. https://studentshare.org/statistics/1854698-data-analysis
(Whether the R&M Expense of the Diesel Trucks Is More Than the Statistics Project Example | Topics and Well Written Essays - 2500 Words)
Whether the R&M Expense of the Diesel Trucks Is More Than the Statistics Project Example | Topics and Well Written Essays - 2500 Words. https://studentshare.org/statistics/1854698-data-analysis.
“Whether the R&M Expense of the Diesel Trucks Is More Than the Statistics Project Example | Topics and Well Written Essays - 2500 Words”. https://studentshare.org/statistics/1854698-data-analysis.
  • Cited: 0 times

CHECK THESE SAMPLES OF Whether the R&M Expense of the Diesel Trucks Is More than the Gasoline-Powered Trucks

A Conflict Over a Multi-Source Context

There is a lot of proof that the 30,000 everyday cargo trucks that pull the containers of shipping from the ports contribute significantly to air pollution along the streets and freeways in the region around the harbor and throughout Southern California (South Coast AQMD, 2000).... Huge ships with engines that run on the dirtiest fuel, hundreds of diesel truck visits each day, hauling cargo, and marine ports activities bring about various environmental effects that may possibly affect local communities as well as the environment....
4 Pages (1000 words) Essay

Least Cost Solution

The flexibility of the trucks also accounts for another substantial advantage, speed.... the miles per hour capacity of trucks and locomotives are about the same), the motor truck generally provides the shipper with superior service in regard to elapsed time (transit time), which is the ultimate measure of time for the shipper.... The difficulty in quantifying benefits makes it more difficult to assign dollar values to them in a consistent manner....
3 Pages (750 words) Essay

Puffery in Advertising

According to the case, trucks similar to the Mammoth are used for hauling heavy equipment but the Mammoth is not suited for hauling.... This would mean that the Mammoth would be in a different class from the hauling trucks, or in a class of its own.... The American Heritage Dictionary (2000) defines puffery as "flattering, often exaggerated praise and publicity, especially when used for promotional purposes....
2 Pages (500 words) Essay

Cars and Trucks of Logan

The paper under the title 'Cars and trucks of Logan' presents compensation approach which is now becoming a very important racket in the car industry.... This is evident among the three car companies namely Wilson motor, Axtell Taylor, and Murdock Hyundai.... hellip; This essay discusses the different compensation approaches these three companies employ in their trade....
1 Pages (250 words) Essay

Analysis of Ford and Firestone Case

Both the Ford and Firestone are at fault in this situation, firestone should not have installed the tires that were in question to Ford trucks; on the other hand, the Ford Company should have made it clear on the recommended pressure of Firestone tires.... The firestone name has ruined its reputation, so is the Ford trucks, the number of lives lost in this accident is not something to go away easily.... Currently, the ford trucks have changed their tires from firestone, however the vehicles keep on rolling in most occasions, and therefore one cannot put all the blame on the firestone tors in these incidences (Case 24 688)....
1 Pages (250 words) Essay

Guidlines for communication in simulated business of a food truck

In simpler words, it can be well stated that the customers of the food trucks remember specific brands by their slogans and themes.... Important guidelines to business communication remain as the most significant aspect.... A business that is newly setting within the market needs to ensure a healthy… Following are some of the communication guidelines for a chosen business. First and foremost, it is important that very simple approach is used when it comes to marketing the business....
1 Pages (250 words) Research Paper

Applying of the Project of Road King Trucks

In addition, the company's IRR is higher than the Road King Trucks cost of capital.... Road King trucks is going to gain $532 million in wealth when the expansion decision implemented, which is a huge amount money on a scale like this.... that is a company that manufactures trucks is contemplating on introducing a public transport bus.... The analysis aims at establishing whether Road King trucks should decide to expand its current… In answering the six questions, the body of the report is going to discuss the following six issues i) importance of the current energy cost; ii) cash flows of the project; iii) the company's cost of capital; iv) choice of an engine Road King trucks should accept the project as it has a positive NPV and a low payback period....
7 Pages (1750 words) Assignment

The Food Truck Business

This paper tells that changes within the food industry focus on maximizing sales and profits for a restaurant business.... The food truck business offers a great way for the expansion of existing restaurant sales.... Ice creams, sandwiches, and hot dogs characterize the traditional food truck business....
1 Pages (250 words) Essay
sponsored ads
We use cookies to create the best experience for you. Keep on browsing if you are OK with that, or find out how to manage cookies.
Contact Us