StudentShare
Contact Us
Sign In / Sign Up for FREE
Search
Go to advanced search...
Free

Composition of the US Population - Report Example

Cite this document
Summary
"Composition of the US Population" paper concentrates on two quantitative variables namely the number of natives and foreign-born individuals in the US and analyzes these two groups with regards to some of the above-mentioned socio-demographic variables…
Download full paper File format: .doc, available for editing
GRAB THE BEST PAPER91.4% of users find it useful
Composition of the US Population
Read Text Preview

Extract of sample "Composition of the US Population"

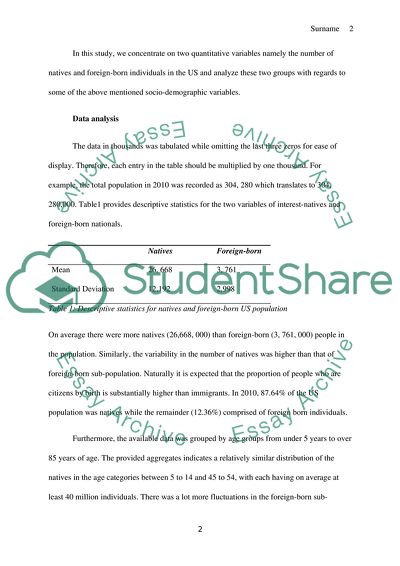
s Composition of the US population The USA, being one of the World’s renowned superpowers has seen a constant population growth over the years. The population growth may however, not be entirely attributed to births within the land. In fact immigration to the US accounts for a substantial proportion of the population growth witnessed annually. This is due the fact that with the economic development, there is need for manpower in the diverse industries. The US government has established a policy enabling about 50,000 immigrants into the nation annually and granting them the permanent residence documentation thus enabling them to permanently settle in the US (Ilona Bray). It would be interesting to analyze the composition of the population in the US taking into account their birth country, US citizenship status and more importantly their distribution with regards to various demographic and socio –economic factors. To achieve this, data on native and foreign-born populations in the US on 2010 was obtained from the United States Census Bureau website (Bureau). The dataset comprised of information about the age, marital status, gender, and education level, income in the previous year, household composition, and household tenure amongst others. In this study, we concentrate on two quantitative variables namely the number of natives and foreign-born individuals in the US and analyze these two groups with regards to some of the above mentioned socio-demographic variables. Data analysis The data in thousands was tabulated while omitting the last three zeros for ease of display. Therefore, each entry in the table should be multiplied by one thousand. For example, the total population in 2010 was recorded as 304, 280 which translates to 304, 280,000. Table1 provides descriptive statistics for the two variables of interest-natives and foreign-born nationals. Natives Foreign-born Mean 26, 668 3, 761 Standard Deviation 12,192 2,998 Table 1: Descriptive statistics for natives and foreign-born US population On average there were more natives (26,668, 000) than foreign-born (3, 761, 000) people in the population. Similarly, the variability in the number of natives was higher than that of foreign-born sub-population. Naturally it is expected that the proportion of people who are citizens by birth is substantially higher than immigrants. In 2010, 87.64% of the US population was natives while the remainder (12.36%) comprised of foreign born individuals. Furthermore, the available data was grouped by age groups from under 5 years to over 85 years of age. The provided aggregates indicates a relatively similar distribution of the natives in the age categories between 5 to 14 and 45 to 54, with each having on average at least 40 million individuals. There was a lot more fluctuations in the foreign-born sub-population in regards to distribution by age groups with 5 to 14 years age category accounting for the highest proportion of foreign- born US nationals in 2010. With regard to gender, there was no much difference in the distribution between natives and foreign-born individuals of a particular gender. For both, there were approximately 88% males and 12% females respectively. The distribution of natives and foreign-born nationals with regard to age is shown in figure 1 below. The bar charts indicate that the distribution is more or less symmetric for foreign –born US citizens while for the natives, there was more asymmetry. Figure 1: distribution of US population in 2010 by age group. A further test on the two subpopulations was performed using an independent pairs T-test. A statistic value of 5.77 with a p-value, 0.0001 led to the rejection of the null hypothesis of equality of the population means between the two sub-populations. It would be interesting to assess the correlation between natives and foreign-born individuals. Correlation is a measure of the strength of the association between pairs of variable. The magnitude of a correction tells how strong the association is while the sign (positive or negative) indicates the direction of the association. Pearson’s correlation values vary between -1 and +1, with a value of zero indicating no association. A scatter plot of the two variables is shown in figure 2 with the fitted trend line shown. As earlier stated, the figures are quoted in thousands. Figure 2: Scatterplot of natives versus foreign-born US citizens in 2010 There is a positive trend indicating that an increase in the native sub-population by one thousand individuals results to an increase in the foreign-born individuals. The fit is not very perfect as expected from any modeling exercise. The resulting linear regression line is of the form Y=0.1485X -198 indicating that for an increase in the natives population by 1000 individuals, the foreign-born sub-population increases by 148 individuals. The R- squared for the model is 36% which implies that with this model, the natives are able to account for only 36% of the foreign-born individuals(Wooldridge). Pearson’s correlation coefficient between natives and foreigners was obtained as 0.6 which is an indication of a strong correlation between the two variables. At this point we can make a few conclusions regarding the natives and foreign-born individuals in the US in 2010. First, there was a significant difference between the proportion of natives and foreign –born individuals in the US. This was revealed by the t-test statistic. Moreover, the bulk of the two sub-populations comprises of individuals aged between 5 and 64 years. There were more males than females in the US who were either natives or foreign-born. With the fitted linear regression line, we can make predictions on the resulting number of foreign-born individuals given a particular number of natives. Further analysis of the data focused mainly on descriptive statistics and graphical comparison of the two sub-populations with regard to other socio-economic factors such as education level, marital status, household composition, total household income, poverty status and household ownership. In the following sections, a brief summary of these findings is presented. There were 242, 168,000 individuals in total over 15 years old. Out of these, 50% were married with 32% claiming to have never married. Only a meager 2% reported to have separated while divorce accounted for 10% of this sub-population (figure3). Figure 3: Pie-chart of the US citizens in 2010 by their marital status. A breakdown of the marital status by the place of birth is presented in table 2 below, from which it’s evident that for each of the marital status categories, natives accounted for a higher proportion of the respondents than the foreign- born individuals. Natives Foreign-born Married 42.30% 9.00% Widowed 5.21% 0.72% Divorced 8.83% 0.98% Separated 1.80% 0.49% Never married 27.14% 3.54% Table 2: Proportion of respondents by marital status The proportion of natives having a particular level of education was generally higher than that of foreign-born US residents in 2010 (figure 4). In particular, only a paltry 4.71% of the foreign-born residents had a bachelors or advanced degree education. Moreover, majority of the native sub-population (50.52%) had high school or tertiary college level education. Another observation is that for the natives, only small portions are not high school graduates (8.11%). Figure 4: Distribution of natives versus foreign-born US citizens in 2010 by education level. Looking at the household composition (figure 5), it was clear that for natives, the highest proportion of households comprised of four or less individuals while for the foreign-born respondents, the highest percentage of them were in households of five to eight persons. This can possibly due to the fact that once the natives migrate into the US; they cluster in households with possibly their relatives, unlike for the natives, who will in most cases be living independently from their larger extended families. Figure 5: Distribution of natives versus foreign-born US citizens in 2010 by Household size Similarly, for the total family income in the preceding year (2009), it was clear that for any income category, there were a higher proportion of natives as compared to foreign-born individuals. More interesting is the fact that the highest income category also recorded the highest proportion of each of the sub-populations earning that much. This could be attributed to the lower proportions of foreign born residents with higher education, which could play a critical role in determining the earning potential of individuals (figure 6). Also based on the findings in figure 5, where foreign –born respondents were associated with larger household sizes, we can speculate the possibility of a higher unemployment rate amongst the non-natives resulting into the lower total household earnings. Figure 6: Distribution of natives versus foreign-born US citizens in 2010 by total income On the brighter side though, over 85% of the US population lived above the poverty line in the year preceding the survey (Natives=75.64% and foreign-born=10.02%). Only 11.98% of natives and 2.36% of foreign-born residents in the US lived below the poverty level. Interestingly, while there were more foreign-born residents living above the poverty level, amongst these individuals, similar proportions of owner occupied households (6.88%) and renter occupied households (6.3%) was observed as compared to the natives, where 60.14% of the natives households were owner occupied with only 26.67% being renter occupied. This could be an indication that natives attach more value to owning houses rather than renting out as compared to foreign-born US residents. References Bureau, U.S. Census. "Native and Foreign-Born Populations by Selected Characteristics: 2010." Statistical Abstract of the United States:. U.S. Census Bureau,, 2012. 44. Print. Ilona Bray, Ilona M. Bray. "U.S. Immigration Made Easy." Nolo, 2009. 606 Print. Wooldridge, Jeffrey M. Introductory Econometrics: A Modern Approach. Cengage Learning, 2009. Print. Read More
Cite this document
  • APA
  • MLA
  • CHICAGO
(Composition of the US Population Research Paper Example | Topics and Well Written Essays - 2000 words, n.d.)
Composition of the US Population Research Paper Example | Topics and Well Written Essays - 2000 words. https://studentshare.org/statistics/1797948-immigration-in-the-us
(Composition of the US Population Research Paper Example | Topics and Well Written Essays - 2000 Words)
Composition of the US Population Research Paper Example | Topics and Well Written Essays - 2000 Words. https://studentshare.org/statistics/1797948-immigration-in-the-us.
“Composition of the US Population Research Paper Example | Topics and Well Written Essays - 2000 Words”. https://studentshare.org/statistics/1797948-immigration-in-the-us.
  • Cited: 0 times

CHECK THESE SAMPLES OF Composition of the US Population

Population Growth

The composition of the population is an important measure in a society given that it helps determine the dependency ratio.... The following chart shows the composition of the population as at the 1990 census From the above chart, it is evident that the majority of individuals during the 1990 census were aged 15 to 34 years while only 21.... Data used in this paper was retrieved from the us census database.... US Census data was retrieved for the year 1900 to 2000 from the us census website....
3 Pages (750 words) Case Study

The Plague, what was the economic impact

The government had a rough time in trying to balance the little revenue that it obtained to satisfy the interest of the population.... This had an impact on government operations as the government was unable to provide the necessary services to its population.... This resulted to deficit as the burden to support its population increased than the benefits it accrued from the citizens.... Death of large population people especially the energetic population caused trade imbalance as the imports outdone the exports....
2 Pages (500 words) Admission/Application Essay

Describe how European colonists' relations with these populations

Generally, colonialism involved unequal relationships between the European colonialists' and the indigenous population.... Some of the effects range from social effects, economic effects, governance and administration, and political effects.... As such, Native Americans and enslaved Africans made fundamental… This paper will however address the political effects of the relations between the colonies and the European colonialists....
2 Pages (500 words) Essay

Is Homosexuality Nature or Nurture

Lack of the male species may have caused the same sex pairing among the albatross population.... The proportion of female-female pairing to different-sex pairing in the Oahu albatross population is higher than recordings for any other bird species.... Further study into the population of albatross inhabiting the island of Oahu may provide answers to questions that this initial study poses.... These findings initiate further study and discussion into the nature of homosexuality and population ecology, and the implications this research may have for future debates on the place of homosexuality in human society....
2 Pages (500 words) Essay

Keystone species - Sea stars

These two forms of interaction determine composition of ecosystem through the natural rule of survival for the fittest.... These two forms of interaction determine composition of ecosystem through the natural rule of survival for the fittest.... Each species, in a food chain, has its effects on composition of a habitat.... Each species, in a food chain,… A keystone species is a species in an ecosystem, whose influence in the ecosystem are greater than would be expected based on its population size....
2 Pages (500 words) Essay

The energy flow among organisms of a food chain

Due to changes in the atmosphere chemistry, indirect elevation of CO2 has shifted the forest productivity as well as the composition of the forest species has been shifted.... A greater factor affecting the population of animal species in the ecosystem is the raised levels of nitrogen deposition.... This could have an impact on the specie population within the habitat, litter quality and nutrient mass cycling rates.... The major hazard caused by human population is the deforestation....
2 Pages (500 words) Assignment

The Theory of Population

This paper declares that population geography is a term used to refer to the study of the geography of human beings and it focuses on how various factors including the scattering, relocation as well as the progression of human population impacts the environment and landscape of a particular region.... nbsp;… According to the study, population geography is divided into two different sections including the quantity as well as the dispersal of individuals throughout the world and the changes in the number of individuals in different areas....
4 Pages (1000 words) Assignment

Brazil and Its Population

This is because of the composition of the Catholics.... This essay "Brazil and Its population" presents Brazil as the largest in South America.... This is due to the fact that many people migrated to this country during colonial times and formed a majority of this population.... The current population of Brazil 211.... The urban population constitutes around 85 percent of the whole population....
1 Pages (250 words) Essay
sponsored ads
We use cookies to create the best experience for you. Keep on browsing if you are OK with that, or find out how to manage cookies.
Contact Us