StudentShare
Contact Us
Sign In / Sign Up for FREE
Search
Go to advanced search...
Free

Statistical Analysis of Geographical Data - Case Study Example

Cite this document
Summary
The study "Statistical Analysis of Geographical Data" focuses on the critical analysis of geographical data using regression and correlation techniques to establish the relationship between two data sets, categorized as independent and dependent variables…
Download full paper File format: .doc, available for editing
GRAB THE BEST PAPER93.3% of users find it useful
Statistical Analysis of Geographical Data
Read Text Preview

Extract of sample "Statistical Analysis of Geographical Data"

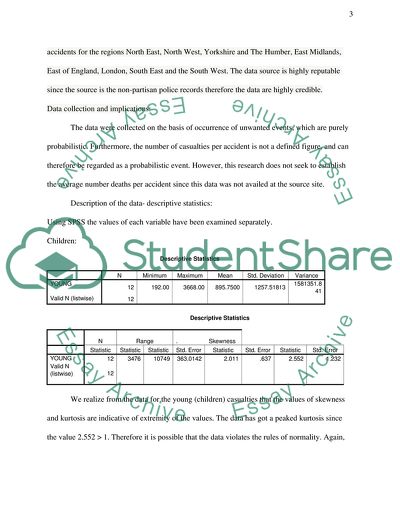
STATISTICAL ANALYSIS OFGEOGRAPHIC DATA By: Presented Introduction Geography utilizes many statistical tools to make conclusions about the features of geographical data. Naturally, a particular statistical technique is useful in analyzing a category of data. The only variation is the statistical features that the study wishes to unearth about the data. This study utilizes regression and correlation techniques to establish the relationship between two data sets, categorized as independent and dependent variables. The independent variable is age of the casualty while the dependent variable is deaths from number of deaths. The overall number of deaths per the two available age categories, children and the elderly is used to develop a linear relationship between the variables. The model: The model so obtained is of the form: y = αx1 + βx2 + ξ where y is the response/ dependent variable- total casualties; x1 and x2 are the young accident casualties and the elderly accident casualties respectively; and α and β are the correlation coefficients for the independent variables respectively. The epsilon is the y-intercept representing explanation for possible errors in the model. The data available has the corresponding values of y, x1 and x2. If a mathematical relationship can be established among the variables, then predicting the numbers of casualties will be made possible. Data: The data used was downloaded from the UK official national statistics site Neighborhood Statistics at the website . The data pertains to the 2003 accidents for the regions North East, North West, Yorkshire and The Humber, East Midlands, East of England, London, South East and the South West. The data source is highly reputable since the source is the non-partisan police records therefore the data are highly credible. Data collection and implications: The data were collected on the basis of occurrence of unwanted events, which are purely probabilistic. Furthermore, the number of casualties per accident is not a defined figure, and can therefore be regarded as a probabilistic event. However, this research does not seek to establish the average number deaths per accident since this data was not availed at the source site. Description of the data- descriptive statistics: Using SPSS the values of each variable have been examined separately. Children: Descriptive Statistics N Minimum Maximum Mean Std. Deviation Variance YOUNG 12 192.00 3668.00 895.7500 1257.51813 1581351.841 Valid N (listwise) 12 Descriptive Statistics N Range . Skewness Statistic Statistic Statistic Std. Error Statistic Std. Error Statistic Std. Error YOUNG 12 3476 10749 363.0142 2.011 .637 2.552 1.232 Valid N (listwise) 12 We realize from the data for the young (children) casualties that the values of skewness and kurtosis are indicative of extremity of the values. The data has got a peaked kurtosis since the value 2.552 > 1. Therefore it is possible that the data violates the rules of normality. Again, the measure of skewness indicates the presence of a tail. The value is 2.011, which is greater than 1. Therefore we realize this section of our data violates the assumptions for normality. The standard deviation is approximately 1.5 times the mean, which is an indication of very high variation in the data. The elderly: Descriptive Statistics N Minimum Maximum Sum Mean Std. Deviation Variance ELDERLY 12 66.00 1831.00 5284.00 440.3333 634.78133 402947.333 Valid N (listwise) 12 Descriptive Statistics N Skewness Kurtosis Statistic Std. Error Statistic Std. Error Statistic Std. Error ELDERLY 12 183.2456 2.006 .637 2.533 1.232 Valid N (listwise) 12 Again we observe a violation of the rules for normality in this test since the value of kurtosis is greater than 1, as well as the skewness value. The standard deviation is larger than the mean, which is an indication of a very high variation in the data. Total: Descriptive Statistics N Minimum Maximum Sum Mean Std. Deviation Variance TOTAL 12 1261.00 33951.00 100174.00 8347.8333 11636.62519 135411045.788 Valid N (listwise) 12 Descriptive Statistics N Skewness Kurtosis Statistic Std. Error Statistic Std. Error Statistic Std. Error TOTAL 12 3359.2043 2.013 .637 2.558 1.232 Valid N (listwise) 12 From this table we can conclude that the tests for normality are violated by the three variables, since this one too does. The measures of skewness and kurtosis are both greater than the required normality range of 1. The standard deviation is extremely large compared to the mean for the total number of casualties in 2003. This means that the variation is very high. The origin of regression analysis is attributed to the researcher Galton in the 19th Century. He carried out research in many fields, and was able to develop the theory of linear relationships among variables (Allen, 2011). Jerome (n.d.) echoes Cottrell’s (2011) note that the technique is used to measure the goodness of fit of a statistical model. Abrams (2007) observes that regression analysis is used when you want to predict a continuous dependent variable from a number of independent variables. The technique draws from available data for an event where data sets are placed according to the way they correspond to each other. Scatter plots are an adequate way of observing whether the there is a linear dependence among the variables. This is the scatter plot of the total number of elderly and children casualties against the number of children casualties. The plot points to a possible linear relationship between the two variables. The long gap at the middle section of the plot is explained by the high variation earlier observed. There is obvious presence of outliers in the two data sets indicating that some of the regions under observation could have a relatively higher contribution to the total number of casualties observed. The scatter plot of the total number of casualties against the number of elderly casualties shows a striking similarity to the plot of total casualties against children casualties. As earlier observed, a linear relationship is established of the two variables, with a wide gap at the middle of the plot again pointing to the existence of extreme values for this case. Results of the regression analysis: Model Summary(b) Model R R Square Adjusted R Square Std. Error of the Estimate Change Statistics R Square Change F Change df1 df2 Sig. F Change 1 .999(a) .998 .998 505.09279 .998 2914.771 2 9 .000 a Predictors: (Constant), ELDERLY, YOUNG b Dependent Variable: TOTAL This is an important section of the overall test for linear relationship among the variables. From this table we have the values of R, R-square and the adjusted R-square. Of the three, the adjusted R-square is most powerful since it incorporates the degrees of freedom in determining the overall variability explained by the independent variables (Karen, 2008). From the table the value of adjusted R-square is 0.998. interpreting this result, 99.8% of the variability observed in the response variable can be attributed to the age of the victim of a road accident. This is a nearly perfect model since so much of the variation is adequately explained by the contributing variables. ANOVA(b) Model Sum of Squares df Mean Square F Sig. 1 Regression 1487225435.144 2 743612717.572 2914.771 .000(a) Residual 2296068.522 9 255118.725 Total 1489521503.667 11 a Predictors: (Constant), ELDERLY, YOUNG b Dependent Variable: TOTAL The above table represents analysis of the regression factor. It is the ultimate test of whether there really exists regression among the factors. We develop a hypothesis to analyse the result thus: H0: there is no linear relationship between the independent variables and the dependent variable. H1: H0 is untrue, that is there exist a linear relationship between the independent variable and the independent variables. To draw the conclusions we focus on the values of F and the p-value, hereby represented by the significance of the F-statistic. The study was done at 5% level of significance. Therefore we contrast the p-value with the level of significance. p-value < level of significance. 0.0 < 0.05. Therefore we reject the null hypothesis at 5% level of confidence. Conclusion: there exist a linear relationship between the dependent variable and the independent variables. Table of coefficients: Coefficients(a) Model Unstandardized Coefficients Standardized Coefficients t Sig. B Std. Error Beta 1 (Constant) 248.035 185.222 1.339 .213 YOUNG 1.340 1.692 .145 .792 .449 ELDERLY 15.670 3.352 .855 4.675 .001 a Dependent Variable: TOTAL The table of constants shows the corresponding coefficients for each of our independent variables in order to complete a full representation of the linear relationship among the variables. The section with β’s has the values 248.035, 1.340 and 15.670 corresponding to the y-intercept, the young casualties and the elderly casualties respectively. We envisaged a model of the form: y = αx1 + βx2 + ξ In line with earlier definitions given, we assign the values accordingly. y = 1.34x1 + 15.67x2 + 248.035 This is the regression model for the data. Interpretation: There exist a strong linear relationship between the total number of casualties and the age of the casualties. The adjusted R-square indicated that 99.8% of the variation observed in the total number of casualties can be explained through the ages of the casualties. Again from the ANOVA of the regression test, we have established that there is an observable linear relationship between the total number of casualties and the ages of the casualties. The strength of this model gives it enough power to predict further values despite the existence of high variation and presence of extreme outliers in the original data sets. Bibliography Abrams, D. (2007). Nonlinear Regression and Curve Fitting: Introduction to Regression. Web, 26th February 2013. Allen, M. (2011). The Origins and Uses of Regression Analysis: Understanding Regression Analysis. Pp 1-5. Web, 25th February 2013. Cottrell, A. (1997). Regression Analysis: Basic Concepts. Pp 1-4. Web, 26th February 2013. Jerome, R. (n.d.). Statistics 210: Regression Analysis. Web, 26th February 2013. Karen. (2008). The Analysis Factor: Assessing the Fit of Regression Models. Web, 27th February 2013. < http://www.theanalysisfactor.com/assessing-the-fit-of-regression-models/> Read More
Cite this document
  • APA
  • MLA
  • CHICAGO
(Statistical Analysis of Geographical Data Case Study Example | Topics and Well Written Essays - 1500 words, n.d.)
Statistical Analysis of Geographical Data Case Study Example | Topics and Well Written Essays - 1500 words. https://studentshare.org/statistics/1795788-data-analysis-geography
(Statistical Analysis of Geographical Data Case Study Example | Topics and Well Written Essays - 1500 Words)
Statistical Analysis of Geographical Data Case Study Example | Topics and Well Written Essays - 1500 Words. https://studentshare.org/statistics/1795788-data-analysis-geography.
“Statistical Analysis of Geographical Data Case Study Example | Topics and Well Written Essays - 1500 Words”. https://studentshare.org/statistics/1795788-data-analysis-geography.
  • Cited: 1 times

CHECK THESE SAMPLES OF Statistical Analysis of Geographical Data

Quantitative Data Analysis

This paper ''Quantitative data Analysis'' tells that The cognitive ability of a grown-up person is a very vital factor that plays an important role in the determination of wages, as well as outcomes, from the labour market.... socioeconomic issues of the family including ethnicity, religion, income, cohousing the family relate issues like childcare, bedtime, ability to redetect and geographical factors.... ow do geographical factors affect cognitive ability of a child?...
9 Pages (2250 words) Essay

Geographic Information Systems and Spatial Analysis

Case Study Using GIS and Spatial Analysis Name Professor Institution Course Date Case Study Understanding the spatial distribution of data from phenomena that occur in the current world displays a great challenge to the elucidation of central questions in many areas of knowledge, regardless of whether it lies in health, in environment, in geology, in agronomy, among many others.... However, it would be fascinating to carry out analyses with a spatio-epidemiological model, which would stand more based on individual-level data than coarse spatial data....
12 Pages (3000 words) Research Paper

Geographical Information System: GIS

data modeling is a manner in which a GIS, or Geographical Information System, can be used to analyse the Earth in two and three dimensions, so that altitude can be factored into any geographical information.... The essay "geographical Information System: GIS" describes that geographers are able to analyse the material very effectively and have methods with which to lessen the mistakes that are made as much as possible.... This information from the area is modeled into the map, so analysis is much easier than it would be otherwise....
15 Pages (3750 words) Essay

Quantitative Geography

hellip; The purpose of Geographic Information System (GIS) is to make possible to view, understand, question, interpret, and visualize data in many ways and reveal relationships, patterns, and trends.... It is not a surprise that GIS data today is used by thousands of organizations from different segments of life, from businesses, governments, educators and scientists, environmental and conservation organizations to natural resource groups and utilities.... This approach allows us to create geographic knowledge by measuring the earth, organizing this data, and analyzing and modeling various processes and their relationships....
8 Pages (2000 words) Essay

Geographic Information Systems of Crime

hellip; The author states that crime mapping is a term in policing and a law enforcement tool that refers to the process of carrying out spatial analysis of crime problems as well as other police-related issues using a geographic information system.... Modern advancement in statistical analysis makes the addition of more social and geographic dimensions to the analysis possible.... They then combine the resultant visual display with other geographic data, are known state and analyze the crime causes and finally develop responses....
9 Pages (2250 words) Term Paper

The Impact of Geospatial Science on the 21st Century Geography

The geographic information system is useful in geography because it has the ability to manipulate, capture, store, and analyze all geographical information and data.... IS technology applies the use of digital information for purposes of creating digitized data.... The process of creating this kind of data involves the use of a hard copy which is then taken to a digital medium by the application of the CAD program.... This is because satellite and Ariel technology has made it possible for geospatial scientists to extract geographic data, through a digitization process referred to as heads up digitizing (Klinkenberg, 2007)....
5 Pages (1250 words) Essay

Business Intelligence Issues

statistical analysis has principles of finding the structure of data this is done by either adding Non-Structured and Structured or obtain data structure from a combination of non explained variance and explained variance.... or the business intelligent system to be effective it is important to adhere to stages of statistical analysis which involves; collection of date and cleaning it to ensure the date to be processed is correct, secondly is gaining knowledge about the data which is being used so that one would decide on the appropriate application to use to analyze the data....
7 Pages (1750 words) Essay

The Vector Topological Data Model in the Geographical Information Systems

GIS software, therefore, stores the topological definitions of geographical data in three different tables to represent the different features such as point, line, and area.... The object of analysis for the purpose of this paper "The Vector Topological Data Model in the Geographical Information Systems" is topology as an important model, particularly where the vector data model is applied to analyze spatial geographical data.... Since there are several networks in the geographical data, for instance, watercourses and road networks, network analysis enhanced with topological modeling can be used to analyze the possible flow around such networks....
8 Pages (2000 words) Term Paper
sponsored ads
We use cookies to create the best experience for you. Keep on browsing if you are OK with that, or find out how to manage cookies.
Contact Us