StudentShare
Contact Us
Sign In / Sign Up for FREE
Search
Go to advanced search...
Free

Estimating Effects of Process Parameters on Chitosan Microsphere Particle Size - Essay Example

Cite this document
Summary
The paper "Estimating Effects of Process Parameters on Chitosan Microsphere Particle Size" highlights that the particle size of enzymes is a critical criterion in determining the efficiency of a reaction. The particle size also determines how easily it can be separated from the obtained product…
Download full paper File format: .doc, available for editing
GRAB THE BEST PAPER91.7% of users find it useful
Estimating Effects of Process Parameters on Chitosan Microsphere Particle Size
Read Text Preview

Extract of sample "Estimating Effects of Process Parameters on Chitosan Microsphere Particle Size"

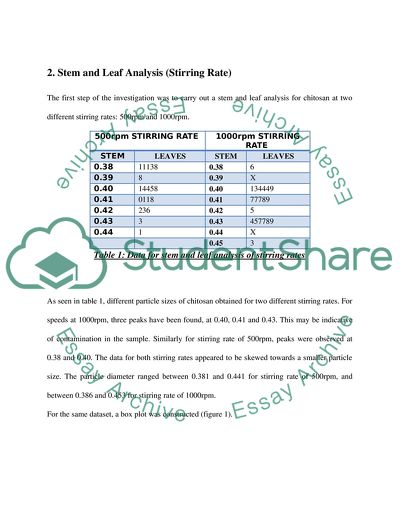
Estimating Effects of Process Parameters on Chitosan Microsphere Particle Size Introduction The particle size of enzymes is an extremely criticalcriterion in determining the efficiency of a reaction. In addition, the particle size also determines how easily it can be separated from the obtained product. Enzymes immobilized with large particle size have a small surface area to volume ratio. This implies that a lesser amount of enzyme is exposed for the reaction and therefore the rate of reaction is slow. On the other hand, immobilized enzymes with a smaller particle size have a larger surface area to volume ratio, implying that a larger amount of enzyme is exposed to facilitate a faster reaction rate. However, using immobilized enzymes very small size makes it difficult to separate them out of the product. Therefore, industries generally optimize the reaction rate and the ease of separation while determining which particle size to employ. The present report explores how various process parameters influence the particle size of chitosan microspheres. Data has been collected on how various parameters determine the size of immobilized enzyme particles. It should however be noted that data will exhibit variability even though the investigation is carried out under the same test conditions because the particle shape may not always be a perfect sphere and thus the measurement may have some degree of variability depending on particle position during measurement. The experiment is aimed at determining the conditions required for making a chitosan enzyme particle of a specific size by employing statistical techniques. Four parameters have been incorporated because of their influence on particle size, namely – Tween 80 concentration, stirring rate, glutaraldehyde concentration and chitosan concentration. 2. Stem and Leaf Analysis (Stirring Rate) The first step of the investigation was to carry out a stem and leaf analysis for chitosan at two different stirring rates: 500rpm and 1000rpm. 500rpm STIRRING RATE 1000rpm STIRRING RATE STEM LEAVES STEM LEAVES 0.38 11138 0.38 6 0.39 8 0.39 X 0.40 14458 0.40 134449 0.41 0118 0.41 77789 0.42 236 0.42 5 0.43 3 0.43 457789 0.44 1 0.44 X 0.45 3 Table 1: Data for stem and leaf analysis of stirring rates As seen in table 1, different particle sizes of chitosan obtained for two different stirring rates. For speeds at 1000rpm, three peaks have been found, at 0.40, 0.41 and 0.43. This may be indicative of contamination in the sample. Similarly for stirring rate of 500rpm, peaks were observed at 0.38 and 0.40. The data for both stirring rates appeared to be skewed towards a smaller particle size. The particle diameter ranged between 0.381 and 0.441 for stirring rate of 500rpm, and between 0.386 and 0.453 for stirring rate of 1000rpm. For the same dataset, a box plot was constructed (figure 1). Figure 1: Box plot for 500rpm and 1000rpm stirring rates The plot for 500rpm stirring rate has a lift value at 0.4065, lesser than that for 1000rpm. It can be seen from the plot that 75% of data on lift is between the values of 0.3955 and 0.419 while the values for good data should lie between 0.36025 and 0.45425. The plot for 1000rpm stirring rate shows a typical lift value of 0.4175 and 75% of data is between 0.404 and 0.4355 while the values for good data should lie between 0.35675 and 0.48275. The data for 1000rpm stirring rate seems to be skewed towards lower quartile while that of the 500rpm stirring rate does not seem to be skewed. Outliers are absent for both stirring rates, however data for the 1000rpm stirring rate appears to be more spread out. Overlaps are observed for several particle sizes at different rates and only slight variation is seen in diameter size at different stirring rates. 3. Graphical Analysis 3.1. Test of Significance In order to confirm the findings, statistical tests need to be conducted to confirm that they are statistically significant. The sample size for this experiment is small (n=20) and therefore, it is not appropriate to apply the central limit theorem. An assumption is thus made irrespective of stirring speed for normal distribution of the particle size values. A student t test can thus be performed for construction of confidence intervals. At α=0.05, i.e. 95% confidence interval for unknown mean, the diameter is given by the formula: μ1 ∈ For 500rpm, x̄ = 0.4065, s = 0.0177 and t190.25 = 2.09. Therefore the equation for diameter is: μ1 ∈ After calculation, μ1 ∈ (0.3982, 0.4148) For 1000rpm, x̄ = 0.4199, s = 0.0171 and t190.25 = 2.09. Therefore the equation for diameter is: μ1 ∈ After calculation, μ1 ∈ (0.4119, 0.4279) For particle size at stirring rate of 500rpm, the plausible values are 0.3982, 0.4148, while that for 1000rpm are 0.4119, 0.4279. Therefore, it can be said that 95% of the chitosan particles are in this size range for the respective stirring rates with a 5% chance of error. It can be seen upon observing the figures that there is a considerable overlap between particle size at the two different stirring rates. 3.2. Non-Parametric Test In order to understand how the mean particle size is influenced by the two stirring rates, non-parametric test was conducted, and the graph is figure 2 and 3. Figure 2: 95% confidence interval for mean chitosan particle size at stirring rate of 500rpm Figure 3: 95% confidence interval for mean chitosan particle size at stirring rate of 1000rpm As shown in figure 2, at confidence interval of 95% for particle size at stirring rate of 500rpm, the median is (0.398, 0.418) while that for 1000rpm is (0.4040, 0.434). Here too, it can be observed that there is a slight overlap of the median particle size at 500rpm and 1000rpm stirring rates. 3.3 Probability A probability plot is drafted for the particle size at the two stirring rates. It is based on the assumption that the earlier assumption of normal distribution is true. Figure 4: Probability plot for 500rpm and 1000rpm stirring rates As seen in figure 4 where the probability from normal distribution is plotted against empirical probability, the standard deviation and means are based on the estimates in the calculations. In the case of stirring rate of 500rpm, the data at the lower end does not follow the regression line. As seen in the stem and leaf plot, the data is skewed and is inconsistent with assumption of normality in normal distribution. 4. Particle Size For the data set of particle size of chitosan at various parameters, a second order response surface model was chosen: Y = Where, Y is particle size, X1 is stirring rate, X2 is concentration of Tween 80, X3 is concentration of chitosan, and X4 is concentration of glutaraldehyde, ε is the prediction error. The total squared prediction error could be minimized for estimation of β coefficient. Alternatively, the could be minimized, where n=3 is the number of observation on Y. This was processed in Ms Excel and tabulated as shown in table 2. The data does not seem to have a linear relationship. The value for X3 and X4 are is found to be zero and it is confirmed that the variables are real factors implying that the concentration of glutaraldehyde and chitosan are important determinants of particle size. Table 2: Second order response surface model in Ms Excel A probability plot of the data shows that it fits normal distribution, implying a good relationship between the normal distribution and empirical distribution. Normal distribution can therefore be observed in the residuals as seen in figure 5. Figure 5: Probability plot The residuals are scattered near the regression line, as seen in figure 5. A graph was constructed for the actual size of the particles against predicted size (figure 6). A straight line from the origin would indicate that the model was perfect. Figure 6: Actual size of particles plotted against the predicted size An R2 value of 70.2% is found for the plot in figure 6. This shows whether the data fits in a straight line or not. In order to confirm that the model was not overestimating or underestimating the size value, a graph was constructed for residuals against the predicted particle size. The graph, as seen in figure 7 showed that no overestimation or underestimation was being done because random scatter was seen for the residuals. Figure 7: Scatter plot for residuals versus predicted particle size A simplified model was drawn using the upper and lower 90% columns from table 2, as shown in table 3. Table 3: Simplified model using selected columns from table 2 Data from simplified model was used for the construction of a graph with confidence bands. Prediction and confidence bands were thus inserted in the graph (figure 8). Figure 8: Graph for simplified model 95% degree was used indicating that 95% of the predication data is found in the blue band and in-between red band. This model cannot be said to be accurate because of decreased value of R2. 5. Conditions The simplified model was employed for the estimation of the required condition. In the analysis, concentration of Tween 80 and the rate of stirring were found to be fixed conditions rather than real factors. The particle size was found to be greater at low Tween 80 concentration and slow stirring rate. The particle size for small and large particles was thus estimated based on this information. As seen in the plot in figure 9 for particles of smaller size, the set conditions were: 2.5 v/v% concentration of Tween 80 and 1750rpm stirring rate. This occurs in the limit bands as seen in the figure. Inclusion criterion for small particles was that they should be lesser than 0.25mm in diameter. The peak concentration of chitosan was found to be 1.75 w/w% at 3.75w/w% gluturaldehyde concentration. At 5w/w% concentration of glutaraldehyde, the Chitosan concentration was between 2.2 and 0.6 w/w%. Figure 9: Small particles predicted diameter As seen in the plot in figure 10 for particles of larger size, the set conditions were: 0.5 v/v% concentration of Tween 80 and 50rpm stirring rate. This occurs in the green bands as seen in the figure. Inclusion criterion for small particles was that they should be larger than 0.53mm in diameter. The peak concentration of chitosan was found to be 1 w/w% at 1w/w% gluturaldehyde concentration. At 5w/w% concentration of glutaraldehyde, the Chitosan concentration was found to be below 0.8w/w% and above 2.18w/w%. Figure 10: Large particles predicted diameter 6. Conclusion This report presents four conclusions regarding particle size of chitosan at different parameters. Firstly, some overlaps were found for particle sizes at different stirring rates, at both 1000rpm and 500rpm. This was observed in the stem and leaf analysis. Secondly, it is seen that stirring rate is not a real factor while Tween 80 was a non-real factor for particle size. The smallest particle obtained in the experiment was of 0.20mm diameter while the largest was of 0.67 mm diameter. Thirdly, a simplified model was created for the prediction of particle size. By employing this model, it was seen that a slow stirring rate and low concentrations of chitosan, glutaraldehyde and Tween 80 are required to obtain particles of larger size. Read More
Cite this document
  • APA
  • MLA
  • CHICAGO
(“Mini project Essay Example | Topics and Well Written Essays - 2500 words - 1”, n.d.)
Mini project Essay Example | Topics and Well Written Essays - 2500 words - 1. Retrieved from https://studentshare.org/statistics/1671015-mini-project
(Mini Project Essay Example | Topics and Well Written Essays - 2500 Words - 1)
Mini Project Essay Example | Topics and Well Written Essays - 2500 Words - 1. https://studentshare.org/statistics/1671015-mini-project.
“Mini Project Essay Example | Topics and Well Written Essays - 2500 Words - 1”, n.d. https://studentshare.org/statistics/1671015-mini-project.
  • Cited: 0 times

CHECK THESE SAMPLES OF Estimating Effects of Process Parameters on Chitosan Microsphere Particle Size

Cost Estimating Process

Estimating process Accurately estimating construction costs lies at the heart of a construction company's success.... There are several techniques of estimation which can be used for the estimating process of a project but the job of a good estimator is to adopt the methodology which is best suited to his own organization.... The following are the various aspects of the estimating process: Estimating Using Handheld Devices Estimation process does not only depend on the design and specifications as certain aspects of the cost can only be calculated through thorough site investigation by visiting the site....
3 Pages (750 words) Essay

Pharmaceutics and Formulation

The arrangement of the monomers in the block structure and size of alginate formed is very important as it affects both gel forming ability and viscosity of polymer.... Polysaccharides are polymers which are made up of simple sugars as the building blocks and have many applications as they have variable and versatile complex structures that are not found in other polymer classes....
8 Pages (2000 words) Literature review

The Effects of Estimation Error on Measures of Portfolio Credit Risk

More precisely, I analyse the impact of uncertainty about input parameters on the precision of measures of portfolio risk.... The paper "The effects of Estimation Error on Measures of Portfolio Credit Risk" highlights that even if the historical default frequency and the expected average default rate are identical, an individual borrower may have an expected default probability which is higher or lower than the average.... I assume that risk managers estimate input parameters directly with historical data....
8 Pages (2000 words) Research Paper

'Estimating Project Costs'

For successful accomplishment of each phase we are required to perform procedures associated with that phase and to produce quality oriented, customer focused.... ... ... Though every phase has its own importance but from estimation perspective project planning is the most important phase.... Based on the requirements set forth by customer project manager opt for defining WBS(Work Break Down Structure) for the project that constitutes of Cost is also the most important parameter of exclusive concern for higher level management, accountant, customer and other stakeholders of project and cost estimation is also performed during project planning phase....
4 Pages (1000 words) Assignment

Effects of Immobilized Enzymes on Industrial Bioprocesses

There are four key design criteria, which are significant for the determination of particle size.... Consequently, the data seems to be skewed towards the smaller particle size.... The actual values of the particle size of chitosan are 0.... For the 500RPM, the data appears to be skewed towards the smaller particle size.... This plot indicates that an actual value for the particle size of the chitosan is 0.... 175 and that much of the data, such as 75% of the data, on the particle size of the chitosan ranges between 0....
9 Pages (2250 words) Research Paper

Engine Selection Parameters

The author of the "Engine Selection parameters" paper elaborates on key parameters that are used in the process and procedures during the selection of the superlative engine for the aircraft.... To select the thrust parameter it starts with sea-lever thrust.... ... ...
6 Pages (1500 words) Term Paper

Parameters in Estimation of the Design of Floods and Catchment Response

The paper "parameters in Estimation of the Design of Floods and Catchment Response" evaluates different methods of estimating the response time of catchment in the estimation of peak discharge.... The time of concentration, the time to peak, and the lag time were compared to determine the best method for estimating the catchment response time for the peak discharge.... From this comparison, it was found that the lag time was the best while the time of concentration was the least method to be used in estimating the catchment response of time in South Australia....
33 Pages (8250 words) Term Paper

Economic Models with Parameters

The paper "Economic Models with parameters" discusses that the OLS assumption states that the regression model should be linear in parameters.... IV helps generate the consistent parameters estimates of the analysis, whereas OLS estimates lack consistency due to the endogeneity's presence (Crosby, et al....
16 Pages (4000 words) Case Study
sponsored ads
We use cookies to create the best experience for you. Keep on browsing if you are OK with that, or find out how to manage cookies.
Contact Us