StudentShare
Contact Us
Sign In / Sign Up for FREE
Search
Go to advanced search...
Free

Statistics Project Example

Cite this document
Summary
The demographic variable that were measured at the interval level of measurements were age, annual income, length of labor, return to workers, and number of workers per week (Troy & Dalgas-Pelish, 2003).
2. Descriptive statistics were used in the description of length of…
Download full paper File format: .doc, available for editing
GRAB THE BEST PAPER94.4% of users find it useful
Statistics
Read Text Preview

Extract of sample ""

Statistics Affiliation Answers to study questions in Exercise 11 The demographic variable that were measured at the interval level of measurements were age, annual income, length of labor, return to workers, and number of workers per week (Troy & Dalgas-Pelish, 2003). 2. Descriptive statistics were used in the description of length of labor in this study. Descriptive statistics were not appropriate because it considered only the features of the group being studied (Agresti, 2007). 3. Other statistic that could have been used in describing the length of labor is categorical statistics distribution (Agresti, 2007).

In this case, a description of the length of labor could have been initiated whereby the length of labor of one works would be considered as a random variable. A probability distribution that provides a description to such a random variable would them be initiated. 4. The distributions of scores for the experimental and control groups were not similar for the length of labor because the two means were different. The mean of the experimental group was 14.63 while that of the control group was 12.

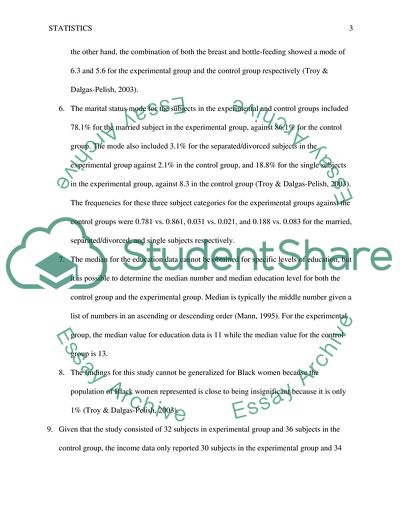
79, portraying a mean difference of 1.84 (Troy & Dalgas-Pelish, 2003). 5. The experimental and control groups were slightly in their type of feeding since in all types of feeding such as bottle feeding, breast feeding, as well as the combination of the two modes of feeding depicted a difference in their mode, as a measure of central tendency (Mann, 1995). Breast-feeding was found to have a mode of 40.6% for the experiment group against 41.7% for the control group, while bottle-feeding had a mode of 53.

1% against 50.0% for the experimental group and control group respectively. On the other hand, the combination of both the breast and bottle-feeding showed a mode of 6.3 and 5.6 for the experimental group and the control group respectively (Troy & Dalgas-Pelish, 2003). 6. The marital status mode for the subjects in the experimental and control groups included 78.1% for the married subject in the experimental group, against 86.1% for the control group. The mode also included 3.1% for the separated/divorced subjects in the experimental group against 2.

1% in the control group, and 18.8% for the single subjects in the experimental group, against 8.3 in the control group (Troy & Dalgas-Pelish, 2003). The frequencies for these three subject categories for the experimental groups against the control groups were 0.781 vs. 0.861, 0.031 vs. 0.021, and 0.188 vs. 0.083 for the married, separated/divorced, and single subjects respectively. 7. The median for the education data cannot be obtained for specific levels of education, but it is possible to determine the median number and median education level for both the control group and the experimental group.

Median is typically the middle number given a list of numbers in an ascending or descending order (Mann, 1995). For the experimental group, the median value for education data is 11 while the median value for the control group is 13. 8. The findings for this study cannot be generalized for Black women because the population of Black women represented is close to being insignificant because it is only 1% (Troy & Dalgas-Pelish, 2003). 9. Given that the study consisted of 32 subjects in experimental group and 36 subjects in the control group, the income data only reported 30 subjects in the experimental group and 34 subjects in the control group because of the issue of missing data (Troy & Dalgas-Pelish, 2003).

This aspect is also reflected on the percentages, which have failed to be 100% in the two groups. 10. The sample for this study was adequately described because the most important variables in a population were considered. The sample size was also relative large enough to represent the entire population, which further implies that the level of biasness was low (Mann, 1995). ReferencesAgresti, A. (2007). An Introduction to Categorical Data Analysis. Wiley-Interscience.Mann, P. S. (1995). Introductory Statistics (2nd ed.). Wiley.Troy, N. W.

, & Dalgas-Pelish, P. (2003). The effectiveness of a self-care intervention for the management of postpartum fatigue. Applied Nursing Research, 16(1), 38–45.

Read More
Cite this document
  • APA
  • MLA
  • CHICAGO
(“Statistics Project Example | Topics and Well Written Essays - 500 words - 9”, n.d.)
Statistics Project Example | Topics and Well Written Essays - 500 words - 9. Retrieved from https://studentshare.org/statistics/1647068-statistics
(Statistics Project Example | Topics and Well Written Essays - 500 Words - 9)
Statistics Project Example | Topics and Well Written Essays - 500 Words - 9. https://studentshare.org/statistics/1647068-statistics.
“Statistics Project Example | Topics and Well Written Essays - 500 Words - 9”, n.d. https://studentshare.org/statistics/1647068-statistics.
  • Cited: 0 times

CHECK THESE SAMPLES OF Statistics

Business Statistics

 The paper talks about the business Statistics as a discipline that helps the managers to make relevant quick decisions in the uncertain business environment.... nbsp;…  Business Statistics is a field that makes use of the statistical tools and allows the business managers to make the best possible decisions at the time of uncertainty.... nbsp; Business Statistics is used in all the functional departments of an organization – finance, human resource, marketing, operations and management and accounting....
6 Pages (1500 words) Term Paper

Communication as a Cause for Divorce

The paper 'Divorce Statistics' presents divorced couples which were found out that communication problems are the second most dominant reason for divorces next to infidelity.... Communication is now being given great attention not only in the relationships of husbands and wives.... hellip; Communication between husband and wife will be taken into account in this essay as this is related to divorce among couples....
1 Pages (250 words) Essay

Hopital Statistics

y looking at statistical information like an increase in the 1) How are Statistics used in your workplace?... Statistics is used to monitor and evaluate blood supply to the hospital.... Statistics is used to measureinfection rates, mortality and patient falls in the hospital.... This is the amount of time a hospital visit takes from the moment the patient walks in the door to the moment they are discharged2) What is one example of descriptive Statistics used in your workplace?...
2 Pages (500 words) Personal Statement

Descriptive Statistics

For teenagers who like sport say for example baseball, descriptive Statistics Give several examples of how descriptive Statistics are used in everyday life.... What advice would you give to others when interpreting Statistics?... Descriptive Statistics are used to describe the sample we are concerned with (Gaten, 2000).... For teenagers who like sport say for example baseball, descriptive Statistics comes in the form of batting average, the single digit that indicates the probability that a player will hit the ball....
1 Pages (250 words) Essay

Descriptive Statistics

art I: Your first task it to do the following Descriptive Statistics Consider this scenario: You are on the Board of Directors of the National Parkinsons Association.... Your Statistics should be the same - math is math, but your decision might be different than mine or your peers.... So, explain why based upon the Statistics you have calculated.... able 1: Number of months that patients went without experiencing debilitating symptoms Group 1 resultsGroup 2 results 445536586101521822137245536 The following table summarizes descriptive Statistics for the results....
2 Pages (500 words) Statistics Project

DESCRIPTIVE STATISTICS

y using Research Publication on the nurses, the researcher resolves whether the experience of education may influence Descriptive Statistics Descriptive Statistics usually helps a researcher analyse the measures of central tendency of the raw data collected from the experiment.... The descriptive Statistics from the findings can be essential to decision making too.... The descriptive Statistics in this study is obtained by administering the Nursing Research Self-Efficacy measure pre and post the learning period....
1 Pages (250 words) Assignment

Inferential Statistics

The paper pertain details of qualitative research report on the topic “inferential Statistics and librarianship.... Who have knowledge… In this research report, the author support his research topic by relating it to previous research taken by other one of them was about the use of Inferential Statistics Inferential Statistics The paper pertain details of qualitative researchreport on the topic “inferential Statistics and librarianship....
1 Pages (250 words) Assignment

ASPC & Statistics

hellip; Hence, the product weight is almost equal, and the mean lies in between 95% SPC & Statistics We ed the data on a statistical package Minitab, and we analysed the data as follows.... A) Descriptive Statistics ... escriptive Statistics ... The graph shows a linear correlation between the product weight and the percentage of occurring at a mean 9....
2 Pages (500 words) Assignment
sponsored ads
We use cookies to create the best experience for you. Keep on browsing if you are OK with that, or find out how to manage cookies.
Contact Us