StudentShare
Contact Us
Sign In / Sign Up for FREE
Search
Go to advanced search...
Free

ASPC & Statistics - Assignment Example

Cite this document
Summary
The graph shows a linear correlation between the product weight and the percentage of occurring at a mean 9.8 and SD = 0.40. Hence, the normality test indicates that the distribution data sample is normal.

Download full paper File format: .doc, available for editing
GRAB THE BEST PAPER98.2% of users find it useful
ASPC & Statistics
Read Text Preview

Extract of sample "ASPC & Statistics"

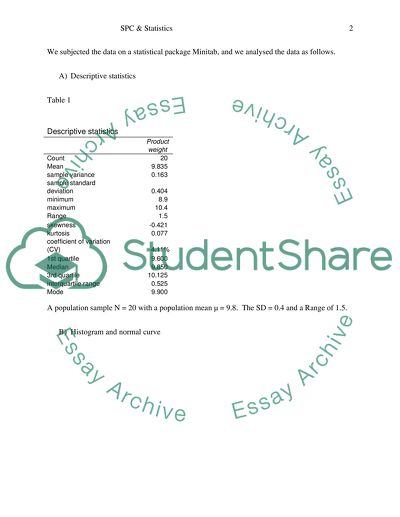
SPC & Statistics We ed the data on a statistical package Minitab, and we analysed the data as follows. A) Descriptive statistics Table 1 Descriptive statistics   Product weight Count 20 Mean 9.835 sample variance 0.163 sample standard deviation 0.404 minimum 8.9 maximum 10.4 Range 1.5 skewness -0.421 kurtosis 0.077 coefficient of variation (CV) 4.11% 1st quartile 9.600 Median 9.850 3rd quartile 10.125 interquartile range 0.525 Mode 9.900 A population sample N = 20 with a population mean μ = 9.8. The SD = 0.

4 and a Range of 1.5. B) Histogram and normal curve The graph indicates a Platykurtic distribution as Kurtosis = 0.07 indicating that most values are around the mean and also indicates an asymmetrical distribution with a negative skew. = -0.42. The graph shows a linear correlation between the product weight and the percentage of occurring at a mean 9.8 and SD = 0.40. Hence, the normality test indicates that the distribution data sample is normal. C) At +/- 1.96 σ = 95% from the graph above of normality test real score = 10.

5 and +/-3σ = At 99% from the graph the real score = 10.8 D). Confidence Intervals 95% CI = ((9.8-1.96*0.09), (9.8+1.96*0.09)) At 95% = [9.6, 10] an indication that the mean lies between the product weight and the sample rate can lie between 9.6 to 10 E) One-Sample T Test of μ = 10 vs ≠ 10 N Mean StDev SE Mean 95% CI T P 20 9.8350 0.0904 0.0202 (9.7927, 9.8773) -8.16 0.000 P-value < .05 Thus, we reject null hypothesis. Type I error occurs by indicating that the two product weights mean are not equal.

Hence, the product weight is almost equal, and the mean lies in between 95% CI.

Read More
Cite this document
  • APA
  • MLA
  • CHICAGO
(“ASPC & Statistics Assignment Example | Topics and Well Written Essays - 500 words”, n.d.)
ASPC & Statistics Assignment Example | Topics and Well Written Essays - 500 words. Retrieved from https://studentshare.org/statistics/1700993-aspc-statistics
(ASPC & Statistics Assignment Example | Topics and Well Written Essays - 500 Words)
ASPC & Statistics Assignment Example | Topics and Well Written Essays - 500 Words. https://studentshare.org/statistics/1700993-aspc-statistics.
“ASPC & Statistics Assignment Example | Topics and Well Written Essays - 500 Words”, n.d. https://studentshare.org/statistics/1700993-aspc-statistics.
  • Cited: 0 times

CHECK THESE SAMPLES OF ASPC & Statistics

Statistical Process Control for Controlling Service Quality

Statistical Process Control whilst primarily a manufacturing quality technique can be usefully applied in service industries Introduction- Research Background “The consumer compares his expectations with the service he perceives he has received, i.... .... he puts the perceived service against the expected service....
10 Pages (2500 words) Essay

Statistical Process Control (SPC)

1) "Statistical Process Control (SPC) is a preventative measure to be applied by companies, not a detection process" Comment on this statement, justifying clearly why you agree or disagree with the statement.... (20%) ... ... tatistical Process Control is a quality control technique that is used in manufacturing processes by using popular statistical methods like mean, variance, Standard Deviation etc....
2 Pages (500 words) Essay

E-business and Application Service Provider

The paper "E-business" tells us about the business process.... Technology has become a fundamental component firm and has provided competitiveness.... Jonscher (1995) pointed out that most of the functions of organizations are being completed through computers.... hellip; Computer-aided tasks have dominated most approaches observed in several companies....
12 Pages (3000 words) Essay

Basic Statistics

The assignment "Basic statistics" states that based upon the data we calculate the percent of relative frequency and prepare a chart.... Basic statistics Product B-17 Data & Statistical Calculations Prepare a Frequency Distribution Chart.... Does it approximate the normal curve, well it is negatively skewed than a normal curve, hence the frequency occurs towards the right of the graph?...
1 Pages (250 words) Assignment

MAT201 - Basic Statistics

The variable taken is number of phone calls made per day and the data set for 10 consecutive days have been taken here for analysis.... A record was made with the help of tally… The tally marks put in my diary are added for each day and the added value gives the number of phone calls received on a single day....
5 Pages (1250 words) Speech or Presentation

Computational Intelligence in Industry - Multivariate Statistical Process Control

Oakland (2008), however, clarified that SPC is neither about statistics nor control, but about competitiveness.... The paper "Computational Intelligence in Industry - Multivariate Statistical Process Control " states that statistical process control (SPC) has been around since the 1920s and it can be safely generalized that considerable research on the field has been made since then....
14 Pages (3500 words) Research Proposal

Basic Statistics and Pearson Correlation

This implies that there correlation between age and depression according to the statistics is very weak.... The Pearson correlation implies that Basic statistics of Affiliate Research Questions Is there a significant correlation between age and depression according to the data available in Book 5Pearson CorrelationNumber of Observations: 681Table 1Pearson Correlation Matrix AGEDEPRESSIONAGE1.... This implies that there correlation between age and depression according to the statistics is very weak....
2 Pages (500 words) Essay

Explaining Stats via Alternative Media

Essentially, statistics on inflammasome activates caspase 1 with the release of interleukin upto 1 β.... The Explaining the statistics via alternative media: Statistical Test, of Data and Data Collection According to the article, statistics on the inflammansome-independent role of AIM2 suppresses colon tumor genesis.... Essentially, statistics on inflammasome activates caspase 1 with the release of interleukin upto 1 β.... statistics on inflammansome-independent and the role of AIM2 in suppressing colon found out that AIM2 deficiency in mice has greater tumor loading compared to Asc-limited mice of azoxymethane model of colorectal cancer....
1 Pages (250 words) Research Paper
sponsored ads
We use cookies to create the best experience for you. Keep on browsing if you are OK with that, or find out how to manage cookies.
Contact Us