StudentShare
Contact Us
Sign In / Sign Up for FREE
Search
Go to advanced search...
Free

Analysis of Statistics Tests - Essay Example

Cite this document
Summary
From the paper "Analysis of Statistics Tests" it is clear that parametric tests are used only with data that is normally distributed. Only quantitative data can be used to perform parametric tests since; however, not all quantitative data have to be analyzed using parametric tests…
Download full paper File format: .doc, available for editing
GRAB THE BEST PAPER91.6% of users find it useful
Analysis of Statistics Tests
Read Text Preview

Extract of sample "Analysis of Statistics Tests"

Examples of parametric tests are t-tests and z tests which are used on both paired and independent quantitative data.

Nonparametric tests do not assume any particular distribution for the data; however, they look at the category or rank order of the values and ignore the absolute difference between them (Driscoll and Lecky 2001.). In addition to the application of these tests to quantitative data that are not normally distributed, nonparametric tests are also applied to nominal and ordinal data. According to Driscoll and Lecky (2001), examples of nonparametric tests include Chi-Square, Fisher exact test which is used for nominal data; and Wilcoxon, Mann-Whitney and Kolmogorov-Smirnov which are used for ordinal data.

Chi-Square (χ2) test is a very popular nonparametric test that is used on unpaired nominal data. This paper shows how the χ2 test is applied to data relating to gender and office locations of 60 sworn officers. The test is used to determine if there is a difference in the gender distribution among the three locations. According to Salkind (2009), the Chi-Square test is a very interesting test that allows the researcher to determine if what is observed in the distribution of frequencies represents what is expected to occur by chance.


Application of Chi-Square Test

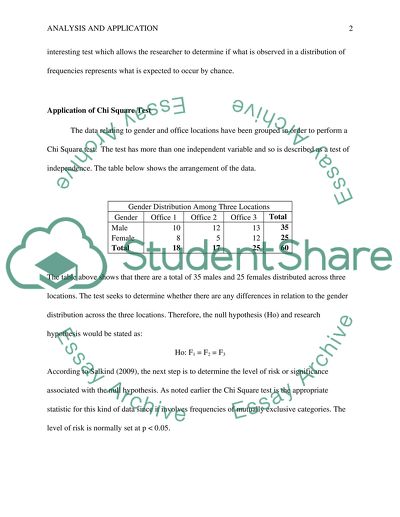
The data relating to gender and office locations have been grouped in order to perform a Chi-Square test.  The test has more than one independent variable and so is described as a test of independence. The table below shows the arrangement of the data.


Gender Distribution Among Three Locations

Gender

Office 1

Office 2

Office 3

Total

Male

10

12

13

35

Female

8

5

12

25

Total

18

17

25

60


The table above shows that there are a total of 35 males and 25 females distributed across three locations. The test seeks to determine whether there are any differences in relation to the gender distribution across the three locations. Therefore, the null hypothesis (Ho) and research hypothesis would be stated as:

Ho: F1 = F2 = F3

According to Salkind (2009), the next step is to determine the level of risk or significance associated with the null hypothesis. As noted earlier the Chi-Square test is the appropriate statistic for this kind of data since it involves frequencies of mutually exclusive categories. The level of risk is normally set at p < 0.05.

The Chi-Square test (CHITEST) was used to calculate the compute the Chi-Square value and the CHIDIST function along with the degrees of freedom was used to compute the probability. The results in the table below which were calculated in excel show the results of the test.

Gender Distribution Among Three Locations


Office 1

Office 2

Office 3

Total

Gender

fo

fe

fo

fe

fo

fe

fo

fe

Male

10

11

12

10

13

15

35

35

Female

8

8

5

7

12

10

25

25

Total

18

18

17

17

25

25

60

60

Chi-Sq. by Group

0.81107


0.30541


0.52067


 χ2

1.63715


CHIDIST

0.65035


The CHIDIST value of 0.65 is less than the computed χ2 value and so the null hypothesis is rejected and so we conclude that the gender distribution is different in all three locations.


Read More
Cite this document
  • APA
  • MLA
  • CHICAGO
(“Project 9 Essay Example | Topics and Well Written Essays - 500 words”, n.d.)
Project 9 Essay Example | Topics and Well Written Essays - 500 words. Retrieved from https://studentshare.org/statistics/1578064-project-9
(Project 9 Essay Example | Topics and Well Written Essays - 500 Words)
Project 9 Essay Example | Topics and Well Written Essays - 500 Words. https://studentshare.org/statistics/1578064-project-9.
“Project 9 Essay Example | Topics and Well Written Essays - 500 Words”, n.d. https://studentshare.org/statistics/1578064-project-9.
  • Cited: 0 times

CHECK THESE SAMPLES OF Analysis of Statistics Tests

Applied statistics for economics

analysis of time series data and forecasting has been used in many fields and most commonly in the stock market prediction using the past data.... Also to be illustrated in this report is the potential of Time-frequency Representation (TFR) techniques, for the analysis of stock markets data and compare their performances.... Applied statistics For Economics ... Time series analysis is a form of statistical data analysis on a series of sequential data points that are usually measured at uniform time intervals over a period of time....
10 Pages (2500 words) Essay

Statistics on Defensive efficiancy for NBA Basketball

From a physical analysis of the data, it seems to be ideal for further analytical review.... Further tests of the kinds may be referred to as significance tests, and when these tests are accessible, we can learn whether the first sample is different from the second.... Name Instructor Course Date NBA Standings Introduction statistics revolves around data collection, organizing or processing, analyzing, understanding and interpretation....
5 Pages (1250 words) Research Paper

Two Statistical Methods

Whatever be the approach or study that is taken up, the analysis of the data is done using any of the number of statistical methods that are available.... For our current consideration, we have taken up, the chi-square distribution and the analysis of Variance (ANOVA)1. ... Whatever be the approach or study that is taken up, the analysis of the data is done using any of the number of statistical methods that are available.... For our current consideration, we have taken up, the chi-square distribution and the analysis of Variance (ANOVA)1....
2 Pages (500 words) Essay

Statistical Analysis of Stock Indices

As the paper "Statistical analysis of Stock Indices" examines, the regression analysis especially the autoregressive model that is of interest in this case has successfully been used during the development of a series of robust tests of the 'intrinsic value measure.... technical overview of the nuances of the unit root test is presented followed by the analysis of the Stock indices given in SPSS v14.... Several possible reasons are offered for this difference, including the different market structures, the use of a different index, or the use of alternate statistical tests'....
14 Pages (3500 words) Research Paper

SPSS for analyzing data with one IV and more than one DV & one-way between subjects MANOVA

You will perform a one-way between subjects MANOVA on the data and report your output.... You will need to complete number 6 and write a Results section for this.... ... ... 3.... You will also need to submit the SPSS Output files showing the analyses you performed in SPSS to compute the answers for related questions....
1 Pages (250 words) Essay

Chi-Squared Testing

From the analysis of both the t-test and Mann Whitney U test, it is evident that there exists a significant difference in the average time.... From the analysis, it is evident that there is a significant difference in the preference of potato chips hence we fail to accept the null hypothesis.... Below we present a graphical representation to support the same;From the analysis, it is evident that the sample does not provide enough evidence to support the claim that there is a significant relationship between hair color and social extroversion hence we fail to reject the null hypothesis and conclude since the Kruska-Wallis test is not significant, a follow-up test is not necessary (Hollander, Wolfe, & Chicken, 2014)....
3 Pages (750 words) Essay

Research Methods - past exam paper

he given summary statistics could be used to interpret and compare the average scores of the class in the two tests and also comment on the dispersion of the scores from their average scores, the comparison among the highest and lowest scores in those two tests.... The median suggests that the mid-point score for all students arranged in ascending order for both the tests is same.... The 1st quartile shows that the lowest score for the two tests are different while the 3rd quartile shows that highest score is same for both the tests....
4 Pages (1000 words) Assignment

Statistical Analysis of Geographical Data

The study "Statistical analysis of Geographical Data" focuses on the critical analysis of geographical data using regression and correlation techniques to establish the relationship between two data sets, categorized as independent and dependent variables.... he data used was downloaded from the UK official national statistics site Neighborhood statistics at the website <http://neighbourhood....
6 Pages (1500 words) Case Study
sponsored ads
We use cookies to create the best experience for you. Keep on browsing if you are OK with that, or find out how to manage cookies.
Contact Us